www.ijiset.com
Optimization of EDM Process with Coated Electrode using GRA
Shantisagar Biradar1, Deepak Panchal2 and Vaibhav Gosavi3
1
Professor, Mechanical Engineering, CHH.SH College of Engineering, Aurangabad, Maharashtra, India
2
Associate Professor, Mechanical Engineering, CHH.SH College of Engineering, Aurangabad, Maharashtra, India
3
Assistant Professor, Mechanical Engineering, CHH.SH College of Engineering, Aurangabad, Maharashtra, India
Abstract
The correct selection of manufacturing conditions and technique is one of the most important aspects to take into consideration in the majority of manufacturing processes and, particularly, in processes related to Electrical Discharge Machining (EDM). Optimization is one of the techniques used in manufacturing sectors to arrive for the best manufacturing conditions, which is an essential need for industries towards manufacturing of quality products at lower cost. This paper aims to investigate the optimal set of process parameters such as current, voltage and pulse on time in EDM process to identify the variations in performance characteristics such as material removal rate and electrode wear rate for machining High Carbon High Chromium Die steel (HCHCr) using the titanium nitride coated copper electrode. Based on the experiments conducted using factorial design, analysis has been carried out using Grey Relational Analysis. The confirmation experiments were carried out to validate the optimal results. Thus, the machining parameters for EDM were optimized for achieving the combined objectives of higher material removal rate and lower electrode wear rate. Grey relational Analysis is being effective technique to deal with multi objective optimization problem.
Keywords: EDM, Factorial design, Tin coated electrode, GRA.
1. Introduction
With the industrial and technological growth, development of harder and difficult to machine materials, which find wide application in aerospace, nuclear engineering and other industries owing to their high strength to weight ratio, hardness and heat resistance qualities has been witnessed. New developments in the field of material science have led to new engineering metallic materials, composite materials and high tech ceramics having good mechanical properties and thermal characteristics as well as sufficient electrical conductivity so that they can readily be machined by non-conventional machining process like spark erosion. The Electrical Discharge Machining process is employed
widely for making tools, dies and other precision parts. The EDM has many advantages, such as non-contact with the workpiece during the machining process and ability to machine any conductive material, regardless of its hardness. Hence, it does not create any vibration during machining as compared to other conventional machining [1]. The quality of a product is the main factor for growth of a company. The quality of the product mainly depends upon the material and process parameters. Optimization of process parameter plays a vital role to increase the quality of the product [2]. Hence, many authors have presented their works on the optimization of process parameters for various machining processes. S. Dhanabalan and K Sivakumar have done EDM process optimization with multiple performance characteristics based on orthogonal array with grey relational analysis for Titanium grades with brass electrode [3]. Saha and Choudhury studied the process of dry EDM with tubular copper tool electrode and
mild steel work-piece [4]. Grey relational analysis
(GRA) has been used by many researchers for machining processes which include electric discharge machining [5], chemical mechanical polishing [6], determining condition of tool in turning [7], side milling [8], and flank milling [9] to analyse the performance of diamond tool carbide inserts in dry turning [10], and optimization of parameters in
drilling [11]. The objective of this paper is to determine
2. Experimentation
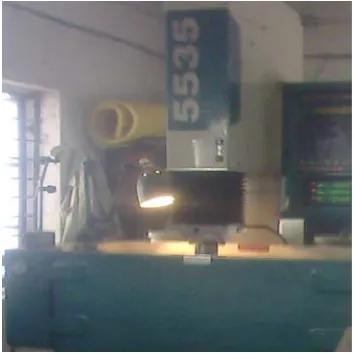
During this study, series of experiments on the HCHCr were conducted by EDM process (shown in Fig 1) to examine the effect of input machining parameters, such as current, voltage and pulse on time on material removal rate and electrode wear rate.
Fig. 1: EDM machine
In this experimental work the titanium nitride coated copper electrode was used as tool material. MRR and EWR was measured with digital weighing machine. On the basis of preliminary experiments conducted by using one variable at a time approach the range of input parameters were selected. The table 1 shows the Machining parameters and their level chosen for this study.
Table 1. Machining Parameters and their levels Values/
Variables
Coded values
Current (Amp)
Voltage (Volt)
Pulse ON time (µs)
Minimum -1 6 45 50
Maximum +1 10 55 200
Average 0 8 50 100
Design of experiment is an effective tool to design and conduct the experiments with minimum resources. In this work, factorial design is used to set the control parameters to evaluate the process performance. A
well designed factorial experiment 23+3=11 experiments
for three inputs variables at three levels were conducted as shown in table 2.
The design matrix with results and S/N ratio of output parameters is shown in table 3 and table 4
respectively. MRR and EWR are calculated by weight difference method.
Table 2. Design matrix with coded values Experimental
runs
Current (I) Voltage (V) Pulse ON time (Ton)
01 -1 -1 -1
02 -1 -1 +1
03 -1 +1 -1
04 -1 +1 +1
05 +1 -1 -1
06 +1 -1 +1
07 +1 +1 -1
08 +1 +1 +1
09 0 0 0
10 0 0 0
11 0 0 0
Table 3. Design matrix with actual values and experimental results Expt.
runs
Current (I)
Voltage (V)
Pulse ON Time (Ton)
MRR g/min
EWR g/min
01 6 45 50 0.0861 0.005
02 6 45 200 0.0762 0.01
03 6 55 50 0.0679 0.008
04 6 55 200 0.0617 0.017
05 10 45 50 0.159 0.016
06 10 45 200 0.162 0.021
07 10 55 50 0.1432 0.019
08 10 55 200 0.132 0.022
09 8 50 100 0.121 0.015
10 8 50 100 0.116 0.015
11 8 50 100 0.12 0.017
Table 4. S/N ratio of output parameter Expt.
runs
Current (I)
Voltage (V)
Pulse ON Time (Ton)
MRR g/min
EWR g/min
01 6 45 50 -21.29 46.02
02 6 45 200 -22.36 40.00
03 6 55 50 -23.36 41.93
04 6 55 200 -24.19 35.39
05 10 45 50 -15.97 35.91
06 10 45 200 -15.80 33.55
07 10 55 50 -16.88 34.42
08 10 55 200 -17.58 33.15
09 8 50 100 -18.34 36.47
10 8 50 100 -18.71 36.47
www.ijiset.com
3. Grey relational analysis
The grey relational analysis is a widely used analyzing system even when a model is uncertain or the information is incomplete. It provides an efficient solution to complicated interrelationships among multiple performance characteristics. Steps of grey relational analysis are given as follow:
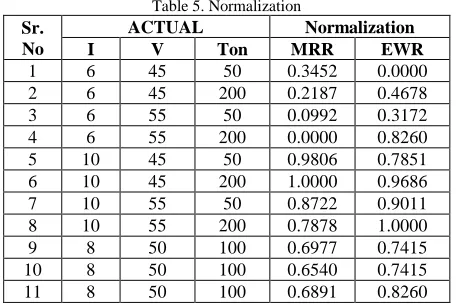
3.1 Normalization
There are three different types of data normalization according to whether we require the LB (lower-the-better), the HB (higher-the-better) and NB (nominal-the-best). The normalization is taken by the following equations.
(a) HB (higher-the-better)
………. (1)
(b) LB (lower-the-better)
…………....…... (2)
(c) NB (nominal-the-best)
……….. (3)
Where xi (k) is the value after the grey relational
generation, min yi (k) is the smallest value of yi (k) for the
kth response, and max yi (k) is the largest value of yi (k)
for the kth response. An ideal sequence is x0 (k) for the
responses. The purpose of grey relational grade is to reveal the degrees of relation between the sequences say, [x0 (k )
and x i (k ) , i = 1, 2,3...,9].
Table 5. Normalization
Sr. No
ACTUAL Normalization
I V Ton MRR EWR
1 6 45 50 0.3452 0.0000
2 6 45 200 0.2187 0.4678
3 6 55 50 0.0992 0.3172
4 6 55 200 0.0000 0.8260 5 10 45 50 0.9806 0.7851 6 10 45 200 1.0000 0.9686 7 10 55 50 0.8722 0.9011 8 10 55 200 0.7878 1.0000 9 8 50 100 0.6977 0.7415 10 8 50 100 0.6540 0.7415 11 8 50 100 0.6891 0.8260
3.2 Deviation sequence
The deviation sequence is the absolute the reference
sequence x0 (k) and the comparability sequence xi (k) after normalization. It is determined using
= |x0 (k) - xi (k)|………….……… (4)
Table 6. Deviation sequence
Sr. No
ACTUAL Deviation sequence
I V Ton MRR EWR
1 6 45 50 0.6548 1.0000
2 6 45 200 0.7813 0.5322
3 6 55 50 0.9008 0.6828
4 6 55 200 1.0000 0.1740
5 10 45 50 0.0194 0.2149
6 10 45 200 0.0000 0.0314
7 10 55 50 0.1278 0.0989
8 10 55 200 0.2122 0.0000
9 8 50 100 0.3023 0.2585
10 8 50 100 0.3460 0.2585
11 8 50 100 0.3109 0.1740
3.3 Grey relational coefficient
GRC for all the sequences expresses the relationship between the ideal (best) and actual normalized S/N ratio. If the two sequences agree at all points, then their grey relational coefficient is 1.
……….……… (5)
Where, difference of the
absolute value ; is the
distinguishing coefficient 1;
= the
smallest value of ; and =
= largest value
of . Comparability sequence and ζ is the distinguishing
coefficient. The value of can be adjusted with the
systematic actual need and defined in the range between 0
Table 7. Grey relational coefficient
Sr. No
ACTUAL GRC
I V Ton MRR EWR
1 6 45 50 0.4330 0.3333
2 6 45 200 0.3902 0.4844
3 6 55 50 0.3569 0.4227
4 6 55 200 0.3333 0.7418
5 10 45 50 0.9627 0.6994
6 10 45 200 1.0000 0.9409
7 10 55 50 0.7964 0.8348
8 10 55 200 0.7021 1.0000
9 8 50 100 0.6232 0.6592
10 8 50 100 0.5910 0.6592
11 8 50 100 0.6166 0.7418
3.3 Grey relational grade
The overall evaluation of the multiple performance characteristics is based on the grey relational grade. After averaging the grey relational coefficients, the grey
relational grade can be computed as:
…………...……… (6)
Where, n = number of process responses.
In this experiment, the normalized MRR corresponds to “higher-the-better” and TWR values corresponds to “smaller-the-better” (SB) criterion that can be calculated Using equation 1 and 2 respectively. The overall performance characteristic of the multiple response process depends on the calculated grey relational grade.
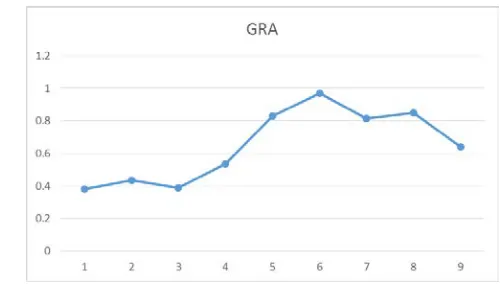
Table 8. Grey relational grade
Sr. No ACTUAL GRG
I V Ton
1 6 45 50 0.383154
2 6 45 200 0.437318
3 6 55 50 0.389836
4 6 55 200 0.537575
5 10 45 50 0.831039
6 10 45 200 0.970457
7 10 55 50 0.815622
8 10 55 200 0.851048
9 8 50 100 0.641206
10 8 50 100 0.625104
11 8 50 100 0.679213
Fig. 2: GRA at different combinations
4. Result and discussion
According to Table 9, the factor A, the current is the most significant controlled parameter for the EDM operation followed by Ton and voltage for maximization of MRR and minimization of EWR. The A2-B1-C2 is an optimal parameter combination of the EDM process with the titanium nitride coated copper electrode.
Table 9: Response table for the Grey Relational Grade
parameters
Grey Relational Grade
Main
effect Rank
Level-1
Level-2 average
A) current 0.4369 0.8670 0.6485 0.2185 1
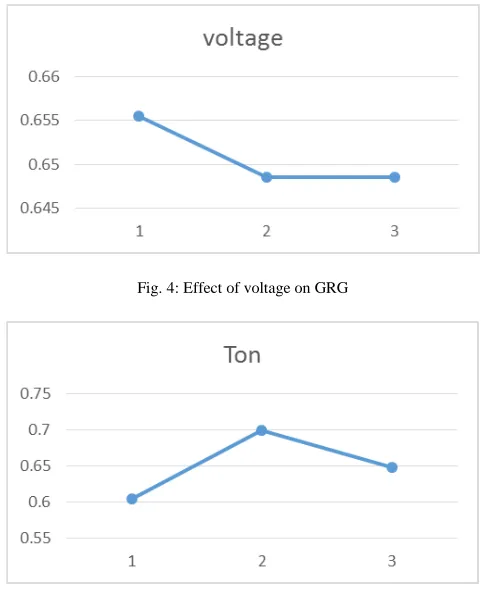
B) voltage 0.6554 0.6485 0.6485 0.0070 3
c) Ton 0.6049 0.6991 0.6485 0.0942 2
www.ijiset.com
Fig. 4: Effect of voltage on GRG
Fig. 5: Effect of Ton on GRG
The optimal combinations of the machining parameter levels is determined from Table 9, as A2 (current 10 Amp), B1 (voltage 45 volt) and C2 (Ton 200 µs). Regression models were prepared and used for prediction of responses.
MRR = 0.0649 + 0.0190 I - 0.00196 V - 0.000049 Ton
… (7)
EWR = - 0.0256 + 0.00237 I + 0.000350 V + 0.000035 Ton
… (8)
The % errors between experimental and predicted values were found within a range of ±0.20. Confirmatory experiments were performed using the optimum values and it was found that experimental response values were close enough to predicted values. If the optimum setting with current of 10 Amp, voltage of 45 volt and Ton of 200 µs is used, it gives MRR of 0.1568 g/min and EWR of 0.02088 g/min.
4. Conclusions
Based on the experimental and predicted results, following conclusions are drawn:
1. The Optimal combination of process parameters for obtaining maximum MRR and minimum EWR are current of 10 Amp, voltage of 45 volt and Ton of 200 µs.
2. If the optimum setting is used, it gives MRR of 0.1568 g/min and EWR of 0.02088 g/min.
3. It was found that current is the most dominant parameter for the titanium nitride coated copper electrode that has high influence on both MRR and EWR followed by Ton.
4. Regression models prepared were used for prediction of responses. The % errors between experimental and predicted values were within a range of ± 0.20.
Acknowledgments
I am very much thankful to management and staff of kishor industries Aurangabad for their kind support.
References
[1] Vaibhav Gosavi, Dr. Nitin Phafat, Dr. Sudhir Deshmukh “Investigation of effect of process parameters in micro hole drilling” International Journal of Modern Trends in Engineering and Research (IJMTER) Volume 07, Issue 02, [August – 2015] [2] Venkata Rao. R., Advanced Modelling and Optimization of Manufacturing Processes, Springer. 2011.
[3] Dhanabalan. S , Sivakumar. K., “Optimization of EDM parameters with multiple Performance characteristics for Titanium grades”, European Journal of Scientific Research,Vol. 68, pp. 297-305, 2011.
[4] Saha, S.K. and Choudhury, S.K., “Experimental investigation and empirical modelling of the dry electric discharge machining process”. International Journal of Machine Tools and Manufacture, Vol.49 (3-4), pp.297-308, 2009
[5] Lin CL, Lin JL, Ko TC , “Optimization of the EDM process based on the orthogonal array with fuzzy logic and grey relational analysis method”, International Journal of Advanced Manufacturing Technology, Vol.19, pp.271–277, 2002.
[6] Lin, Z.C., Ho, C.Y., “Analysis and application of grey relation and ANOVA in chemical-mechanical polishing process parameters”, International Journal of Advanced Manufacturing Technology, Vol. 21, pp.10–14, 2003.
[7]Lo, S.P., “The application of ANFIS and grey system method in turning tool-failure detection”, International Journal of Advanced Manufacturing Technology, Vol.19, pp.564–572, 2002.
[8] Chang, C.K., Lu, H.S., “Design optimization of cutting parameters for side milling operations with multiple performance characteristics”, International Journal of Advanced Manufacturing Technology, Vol.32 (1/2), pp.18–26, 2007.
of Advanced Manufacturing Technology, Vol. 191, pp.400–403, 2007.
[10] Arumugam Prabhu. U., Malshe Ajay, P., Batzer Stephen. A., “Dry machining of aluminium silicon alloy using polished CVD diamond-coated cutting tools inserts”, Surface Coating Technology, Vol.200, pp.3399–3403, 2006.
[11] Tosun, N., “Determination of optimum parameters for multi-performance characteristics in drilling by using grey relational analysis”. International Journal of Advanced Manufacturing Technology, Vol.28, pp.450–455, 2006.
[12] Lin, J.L., Lin, C.L., The use of the orthogonal array with grey relational analysis to optimize the electrical discharge machining process with multiple performance characteristics, International Journal of Machine Tools & Manufacture, Vol. 44, pp.237-244 2002.
[13] Kadirgama, K., Noor. M.M., Zuki.N.M, Rahman, M.M., Rejab M.R.M, Daud, R., K. Abou-El-Hossein, A., “Optimization of S urface Roughness in End Milling on Mould Aluminium Alloys (AA6061-T6) Using Response Surface Method and Radian Basis Function Network”, Jordan Journal of Mechanical and Industrial Engineering, Vol 2, 2008.
[14] Taguchi, G., “Off-line quality control”, Central Japan Quality Control Association, Nagaya, Japan, 1979.
[15] Deng, J. L , “Basic methods of Grey system”, Journal of Grey System, Vol.1, pp.1-24, 1987.
[16] Ng David, K.W., “Grey system and grey relational model”, ACM SIGICE Bulletin, Vol.20 (2), pp.1–9, 1994.
[17] Chang, C.K., and Lu, H.S., “Design optimization of cutting parameters for side milling operations with multiple performance characteristics”, International Journal of Advanced Manufacturing Technology, Vol.32, pp.18–26, 2007.
[18] Pan,L.K., Wang,C.C., Wei,S.L., and Sher,H.F., “Optimizing multiple quality characteristics via Taguchi method-based grey analysis”, Journal of Material Processing Technology, Vol.182, pp.107–116, 2007.
[19] Kopac, J., and Krajnik, P., “Robust design of flank milling parameters based on grey-Taguchi method”, Journal of Material Processing Technology, Vol.191, pp.400–403, 2007.