Abstract—In this work, we present a three-component hierarchical structure to simultaneously improve the red, green, and blue (RGB) light extraction efficiency (LEE) of white light-emitting diodes (LEDs) based on color mixing method. With the help of 3D finite-difference time-domain (FDTD) simulations, the effects of the embedded photonic crystals (PhCs) the normal surface PhCs and the nano-rods on the enhancement of RGB light extraction were investigated. The results were compared with those of the conventional planar LEDs and the normal surface PhCs LEDs over the whole visible spectrum. Results from the simulations demonstrated that the maximum LEE for the hierarchical structures LEDs gave 112%, 327%, and 284% RGB LEE enhancement, respectively, compared to that of the conventional planar LEDs, and achieved 104%, 191%, and 187% RGB LEE enhancement compared to that of LEDs with normal surface PhCs. The emission characteristics of the hierarchical structures LEDs were also revealed in detail by FDTD simulations. The results shown in this paper would do a favor for the design and fabrication of high efficiency LEDs.
1. INTRODUCTION
Recently, LEDs especially white LEDs have been widely used in our daily life, such as lighting, flat-panel displays, and optical communications [1, 2]. Two approaches can be used to produce white LEDs: one is based on phosphor conversion, and the other is the so-called RGB color mixing method. With the phosphor conversion method, one or two color LEDs die is used to excite different color phosphors, and then these colors are combined to get the white LEDs. Between them, combining the blue emission from GaN LEDs die and the yellow fluorescence from the phosphors excited by the blue light is a typical method [3]. However, both the conversion efficiency and the color rending index are very low. Some researchers use ultraviolet light to excite blue, green, and red phosphors to get white light emission. With this method, higher efficiency and color rending index are obtained; however, this method is very complicated with rising costs [4]. As far as the RGB color mixing method is concerned, the red, green, and blue lights are directly combined to produce white light emission without the participation of phosphors [5]. Although the efficiency of white light LEDs obtained from color mixing method is still a little lower than that based on phosphor conversion method because of the low emission efficiency of the green and yellow LEDs, the lifetime of the white LEDs based on phosphor conversion is usually degraded to some extent due to the involvement of the phosphors which are easily degraded. And because of the non-radiative recombination of the phosphors, the efficiency the white LEDs based on phosphor conversion cannot reach 200 lm/W. On the other hand, since the RGB system white LEDs are phosphors free, the lifetime and color rendering are much better than the phosphor conversion white
Received 19 January 2017, Accepted 18 April 2017, Scheduled 10 July 2017
* Corresponding author: Kang Li ([email protected]).
1 School of Information Science and Engineering, Shandong University, Jinan 250100, China. 2 School of Physics and Electronics
LEDs, and it is expected that their emission efficiency can reach 250 lm/W, so the white LEDs based on color mixing are becoming the main trend of white LEDs [6, 7].
In order to realize the RGB color mixing white LEDs, various methods have been implemented. In 2002, Yamada et al. [6] used quantum wells (QWs) with different In compositions to form multi-color-emitting multiple quantum wells (MQWs) and fabricated a high efficiency monolithic white LEDs. However, the intensity of different wavelengths varied largely due to nonuniform carriers spatial distribution, especially nonuniform distribution of the holes. Recently, RGB color mixing system by the combination of independent emitting quantum dots (QDs) is becoming a promising white LEDs fabrication method due to its high luminescence quantum yield, good photo-stability, size-tunable emission, and cheap solution process ability [8]. In this method, different scale QDs are fabricated in different QWs to realize multi-wavelength emission and then monolithic white LEDs. The intensity of certain wavelength can be tuned by tuning the QDs density distributions. Nowadays, combined with ultraviolet light, high efficiency white light emission has been realized by RGBQDs [9, 10]. However, most of these white LEDs based on the QDs have low LEE resulting from scattering problem [11]. Therefore, it is still a challenge to fabricate QDs white LEDs with high LEE along with their high luminescent performance.
During the last decades, numerous methods have been implemented to increase the LEE of GaN-based blue LEDs, such as surface roughing [12], PhCs [13–15], and nano-array surfaces [16, 17]. Among these methods, surface roughing is easy to be carried out and has been used commercially in the fabrication of LEDs. However, it has no control of the direction of the emission light, and the productive process is uncontrollable too. Recently, PhCs and nano-array surfaces have shown great potential in the improvement of LEE. Tsai et al. [18] have fabricated embedded PhCs within the GaN/InGaN green LEDs to enhance the LEE of LEDs by 78%, and meanwhile, the view angle of LEDs has also been collimated from 131.5◦ to 114.0◦. Chen et al. [19] have used nano-pillar array to improve the LEE of GaN-based blue LEDs and achieved a factor of 1.41 enhancement at 20 mA current injection. However, these methods were all aiming at a single wavelength extraction which had little effect on the LEE enhancement of other wavelengths. Li et al. [20] have enhanced the LEE of white LEDs by applying the hetero-structure PhCs as the substrate, and an obvious enhancement of white light intensity has been achieved. However, it was very difficult to engineer the structure of PhCs to make tri-stopbands overlapping the emission wavelength of RGB QDs.
In this work, we design a three-component hierarchical structures to simultaneously enhance the RGB light extraction. The 3D FDTD method was used to calculate the LEE of LEDs with different configurations. And results indicated that the LEE of RGB light had a great increase, then more white light intensity would be obtained.
2. MODEL OF SIMULATION AND NUMERICAL METHOD
The schematic of three-component hierarchical structures LEDs is shown in Figure 1(a). The LEDs were composed of a 1µm sapphire substrate a 1.8µm n-GaN layer, a 200 nm p-GaN layer and a 250 nm ITO current spreading layer from bottom to top. Embedded PhCs were fabricated within n-GaN layer to enhance the LEE of green light emission, and the normal surface PhCs were used to extract the blue light, while the nano-rods were applied to red light extraction. Balancing the accuracy and calculation time, the simulation volume was selected as 4µm×4µm×3.25µm since the LEE did not change significantly as it was further increased [21]. As shown in Figure 1(b), a classical dipole source embedded between the p-GaN layer and the n-GaN layer was used to represent the carrier recombination within the active layer. The emission wavelengths were set as 620 nm, 520 nm, and 465 nm which are most representative of red, green, and blue light emissions, respectively [22–24].
To eliminate any reflection at the boundaries which would result in unphysical interference pattern, we applied perfectly matched layer (PML) [25] to the edge of the simulation domain. Here, the width of PML was set as 100 nm which could effectively absorb all incident energy. Moreover, a homogeneous mesh-grid of 10 nm was used during the simulations. As far as the absorption of the materials was concerned, the intensity of light traveling in the semiconductor can be written as a function of distance
z as follows:
(a) (b)
Figure 1. (a) The schematic of three-component hierarchical structures LEDs. (b) The cross section of the model setup for FDTD simulations.
(a) (b)
Figure 2. (a) The refractive index (n) of GaN and ITO. (b) The extinction coefficient (k) of GaN and ITO.
where I is the wave intensity of the light source, k the extinction coefficient, and λ the wavelength of the light in free space. The refractive index (n) and extinction coefficient (k) of GaN and ITO along the whole visible spectrum are shown in Figure 2. Since the extinction coefficients of GaN, ITO were close to zero at the wavelengths of interest, the materials absorption was ignored during the simulations [26, 27]. A power monitor was used to measure the power flux (Pout) passing through a plane placed above the top surface of LEDs, and a box monitor enclosing the dipole source was used to calculate the whole power emitted from the dipole source (Psource). Then the LEE of LEDs was defined as [28]:
ηextr = Pout
Psource (2)
In order to show the effects of hierarchical structures on the LEE improvement, the enhancement of LEE is used. And the LEE enhancement factorF was defined as
F = ηextr−η0
where ηextr is the LEE of LEDs with various structures and η0 the LEE of the conventional planar LEDs.
3. RESULTS AND DISCUSSIONS
3.1. The Light Extraction of Planar LEDs
As we know, the low LEE of LEDs was mainly due to the effects of total internal reflection (TIR) and Fresnel reflection [29], especially the TIR. Under the influence of TIR, the LEE of LEDs can be defined as
ηextr = Pout
Psource =
θc
0 2πr
2sinθdθ
4πr2 =
1
2(1−cosθc) (4)
where θc = arcsin(n1/n2) is the critical angle. For example, for GaN planar LEDs, namely, there was no additional structure on the top of the LEDs, and the LEE was about 4%. While adding ITO on the top of GaN, the LEE of the top surface was about 6.7%. However, because of the TIR between the GaN and ITO layer, the overall LEE would be between 4% and 6.7%. As far as the Fresnel reflection was concerned, the reflection ratio of the top surface of the ITO planar LEDs was:
R=
nIT O−nair
nIT O+nair
2
≈0.11 (5)
which would further reduce the LEE. According to our simulation, the LEE of planar ITO LEDswas 4.6%, which could be reliable.
3.2. The Green Light Extraction-embedded PhCs
3.2.1. The Dependence of LEE on the Distance between Embedded PhCs and the Active Layer
Firstly, we used the embedded PhCs to improve the light extraction of the green light. The simulations of the dependence of green light LEE on the distance dbetween embedded PhCs and the active layer was first conducted. It has been proved in [30] that the triangular lattice PhCs had better performances than square ones, so triangular lattice PhCs were chosen during the simulations. Then the filling factor can be defined as:
ftriangle=
2πR2P hCs
√
3a2
P hCs
(6)
Here,RP hCsis the radius of PhCs, andaP hCsis the PhCs lattice constant, i.e., center-to-center distance between the neighboring PhCs.
Then the lattice constant aP hCs of the embedded PhCs was kept at 498 nm, radiusRP hCs set as 150 nm, and depth fixed at 500 nm for the time being, which have been used to improve the LEDs green light output performance in [18]. We could calculate the filling factor from Equation (6), that was about 0.33. Then the LEE of LEDs with the distance dbetween embedded PhCs and the active layer varied from 60 nm to 400 nm was calculated, and the results are shown in Figure 3.
Figure 3. The dependence of LEE on the distance d between the embedded PhCs and the active layer.
Figure 4. The influence of the embedded PhCs depth h1 on the LEE.
3.2.2. The Influence of the Embedded PhCs Depth on the LEE
Then, in the following simulations, the distancedbetween the embedded PhCs and the active layer was fixed at 100 nm where the maximum LEE has been obtained from above calculations, and the etching depth of PhCs varied from 50 nm to 800 nm in step of 50 nm. Figure 4 demonstrates the variation of LEE for numerous etched depthsh1 of the embedded PhCs. As shown in Figure 4, with the increase of the etching depth, the LEE of green light presents a decremented sinusoidal-like behavior. The largest enhancement of LEE is obtained at a embedded PhCs depth between 100 and 200 nm. When the PhCs depth h1 equals 150 nm, the LEE obtains a 83.1% enhancement. This can be explained by the confinement of light emission between the embedded PhCs and the top surface of the LEDs. The enhancement of LEE will be high when the interference is constructive. This is in good agreement with the conclusion of. [32, 33].
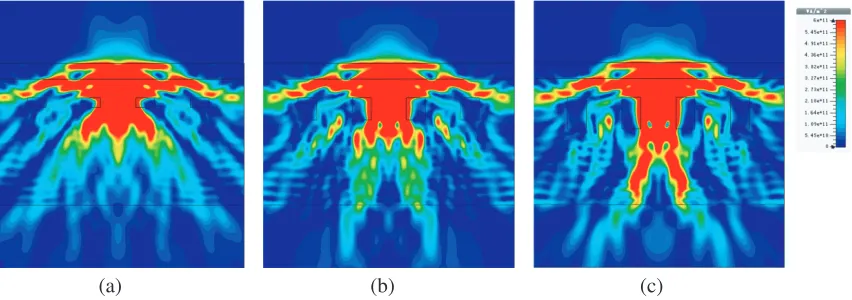
This can also be manifested by the power flow intensity of the LEDs with different embedded PhCs depths, such as 150 nm, 350 nm, and 500 nm, as shown in Figure 5. From Figure 5, we can find that when the embedded PhCs depth equals 150 nm, the photonic power is better confined between the embedded PhCs and the top surface of LEDs, and the power travels towards the bottom of LED decrease, which has more chances to be extracted. However, when the etching depth equals 350 nm and 500 nm, more power travels toward the bottom of LED, and is absorbed by the PML placed around the LED, then the LEE will decrease.
(a) (b) (c)
3.2.3. The Influences of the Embedded PhCs Radius and Filling Factor on the LEE
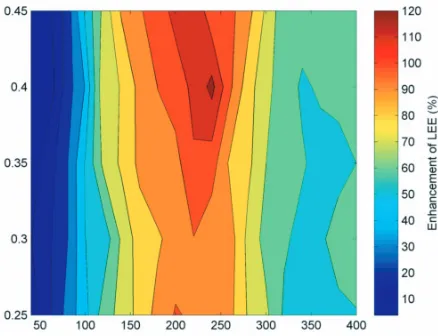
Then, the influences of the embedded PhCs radiusr1 and filling factorf1 on the LEE were investigated simultaneously, since they have close relations with each other, while the other parameters were fixed at the optimal values obtained above, i.e., the distancedbetween the embedded PhCs and the active layer was set as 100 nm, and the embedded PhCs depth was 150 nm. Then the enhancement of LEE which is depicted as a function of the embedded PhCs radiusr1 and filling factor f1 is shown in Figure 6. Here, the embedded PhCs radiusr1 varies from 40 nm to 400 nm, and the filling factorf1is between 0.25 and 0.45. It can be seen from Figure 6 that the best radius r1 for light extraction is between 180 nm and 260 nm, and the best filling factorf1 is between 0.3 and 0.45. When the filling factorf1 equals 0.4 and the radiusr1 equals 240 nm, the highest LEE enhancement of 123% is achieved.
Figure 6. Influences of the embedded PhCs radiusr1 and filling factor f1 on the LEE.
3.3. The Blue Light Extraction-surface PhCs
3.3.1. The Dependence of Surface PhCs Depth on the LEE
Then the normal surface PhCs were used to extract the blue light of the RGB white LEDs. It is worth mentioning that since the fabrication of PhCs etching through the active layer was still very complicated and difficult, we considered only shallow etched PhCs during the simulations [34]. The lattice constant of the surface PhCs was kept at 200 nm and the radius set as 60 nm for the time being, which have been used to improve the light output performance of LEDs in [21]. Then the LEE of surface PhCs LEDs with PhCs depth varied from 40 nm to 440 nm was calculated, and the results are shown in Figure 7(a). From Figure 7(a), it is clearly visible that with the increase of PhCs etching depth, the LEE increases periodically. When the depth is about 360 nm, above 190% enhancement of LEE has been achieved. Then it begins to decrease drastically as the depth further increases. Furthermore, in order to show the application of surface PhCs as a light extractor of light emission, we plot the far-field intensity distributions of LEDs in Figure 7(b).
From Figure 7(b), it can be seen that as PhCs are etched on the surface of LEDs, the far-field intensity distribution is well modified accordingly. As shown in Figure 7(b), the power flux between angular−90◦ ∼90◦ can be collected by the monitor placed above the top side of LEDs. It means that the output power of LEDs can be represent by the area under the far-field distribution curve, which is
far-field intensity distributions of the surface PhCs LEDs with different etched depths, the far-field intensity distributions of the conventional surface planar LEDs is also shown here for comparison.
3.3.2. The Influence of Surface PhCs Radius and Filling Factor on the LEE
Then the influences of the surface PhCs radius r2 and filling factor f2 on the LEE were investigated simultaneously, while the other parameters were fixed at the optimal values obtained above. The LEE was calculated asr2 varied from 20 nm to 400 nm for various values off2 between 0.25 and 0.45 in 0.05 intervals. As shown in Figure 8, as the filling factorf2 varies from 0.25 to 0.45, all the LEEs exhibit a similar tendency: each line firstly increases to a peak value when r2 is about 60 nm and then decreases periodically as r2 further increases. This can be manifested by the electric field intensity distributions in the LEDs.
Figure 8. Influences of the surface PhCs radiusr2 and filling factor f2 on the LEE.
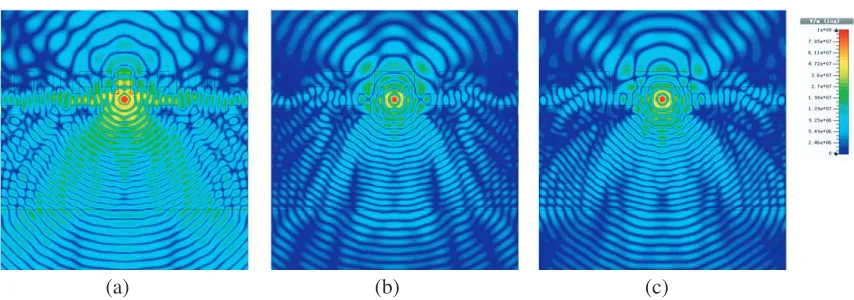
Figure 9 shows the electric field intensity distributions of LEDs with different PhCs filling factors and radii. From Figure 9, we can find that when f2 = 0.4 and r2 = 60 nm, the power can be more effectively diffracted out of the LEDs than the other configurations, then more LEE enhancement will be obtained. As calculated, about 208% enhancement of LEE is achieved.
3.4. The Red Light Extraction-Nano-Rods
(a) (b) (c)
Figure 9. The electric field intensity distribution of different filling factor and radius surface PhCs: (a)f2 = 0.4,r2= 60 nm. (b)f2 = 0.4,r2= 200 nm. (c)f2 = 0.25,r2= 200 nm.
(a) (b)
Figure 10. (a) The dependence of nano-rods radius on the LEE. (b) The enhancement of LEE as a function of the nano-rods height h3.
Then we could get that the period of the surface photonic crystal was 180 nm from Equation (6). Since the nano-rods were fabricated on the un-etched surface of LEDs, the radius of the nano-rods would be no bigger than 40 nm as calculated. Thus, although the LEE might continue increase and achieve a peak value with the radius increasing, we could not increase the radius of the nano-rods anymore. The dependence of nano-rod radius on the LEE is shown in Figure 10(a). As can be seen from Figure 10(a), the LEE increases dramatically as the radius increases, and achieves a biggest enhancement of 90.6% when the radius equals 40 nm, which gets benefit from the waveguide effect of the nano-rods.
Then, we fixed the nano-rods radius at 40 nm as calculated above, and varied the nano-rods height from 50 nm to 500 nm to calculate the corresponding LEE enhancement. The results are shown in Figure 10(b). From Figure 10(b), we can find a declined oscillation with the increase of the nano-rods height. It is much the same when the nano-rods height h3 equals 150 nm and 200 nm. However, as we have calculated, the enhancement of LEE for nano-rod height 150 nm is 105.3%, and that of nano-rod height 200 nm is 105.4%. Then we can find that when the nano-height is 200 nm, more LEE enhancement can be achieved.
3.5. The Lee Enhancement over the Whole Visible Spectrum
Figure 11. The LEE enhancement of the hierarchical structures LEDs and the normal surface PhCs structure LEDs over the whole visible spectrum.
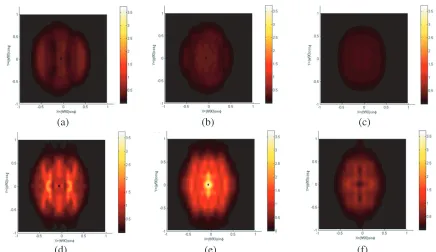
(a) (b) (c)
(d) (e) (f)
then is that of the blue light, and at last is that of the red light. These conclusions are well in line with the simulations results obtained above.
4. CONCLUSIONS
A three-component hierarchical structure is used to simultaneously improve the red, green, and blue LEEs of white LEDs based on RGB color mixing. According to our FDTD calculations, the maximum LEE for the hierarchical structures LEDs achieves 112%, 327%, and 284% for red, green, and blue LEE enhancements, respectively, compared to that of the conventional planar LEDs, hence more LEE enhancement for white LEDs will be obtained. We also compare the proposed structure with the normal surface PhCs LEDs along the whole visible spectrum. From simulations, we can find that the hierarchical structures LEDs have greater LEE enhancement than that of the normal surface PhCs LEDs over the whole visible spectrum. And a maximum LEE enhancement of 280% higher than normal surface PhCs LEDs at around 520 nm compared to the normal planar LEDs has been achieved. These results can serve as guidelines for the design and fabrication of high efficiency LEDs.
ACKNOWLEDGMENT
This work is supported by the National Natural Science Foundation of China (61475084, 61327808), National High Technology Research and Development Program of China (2015AA03A102), and the Science-Technology Foundation of the Higher Education Institutions of Shandong Province, China (J17KA054).
REFERENCES
1. Schubert, E. F., “Solid-state light sources getting smart,” Science, Vol. 308, 1274–1278, 2005. 2. Krames, M. R., O. B. Shchekin, R. Mueller-Mach, G. O. Mueller, L. Zhou, G. Harbers, and
M. George Craford, “Status and future of high-power light-emitting diodes for solid-state lighting,”
Journal of Display Technology, Vol. 3, 160–175, 2007.
3. Nishiura, S., S. Tanabe, K. Fujioka, and Y. Fujimoto, “Properties of transparent Ce:YAG ceramic phosphors for white LED,”Optical Materials, Vol. 33, 688–691, 2011.
4. Huang, C.-H. and T.-M. Chen, “A novel single-composition trichromatic white-light Ca3Y(GaO)3(BO3)4:Ce3+,Mn2+,Tb3+ phosphor for UV-light emitting diodes,” The Journal of
Physical Chemistry C, Vol. 115, 2349–2355, 2011.
5. Yang, C. J., C. S. Huang, C. W. Chen, and P. W. Chen, “The color mixing white-light LEDs,”
Applied Mechanics and Materials, Vol. 378, 440–443, 2013.
6. Yamada, M., Y. Narukawa, and T. Mukai, “Phosphor free high-luminous-efficiency white light-emitting diodes composed of InGaN multi-quantum well,” Japanese Journal of Applied Physics, Vol. 41, L246–L248, 2002.
7. U. S. DOE, “Solid-state lighting research and development: Multi year program plan,” 2011. 8. Kim, J. Y., O. Voznyy, D. Zhitomirsky, and E. H. Sargent, “25th Anniversary article: Colloidal
quantum dot materials and devices: A quarter-century of advances,”Advanced Materials, Vol. 25, 4986–5010, 2013.
9. Kim, S., S. H. Im, and S.-W. Kim, “Performance of light-emitting-diode based on quantum dots,”
Nanoscale, Vol. 5, 5205, 2013.
10. Sun, C., Y. Zhang, Y. Wang, W. Liu, S. Kalytchuk, S. V. Kershaw, T. Zhang, X. Zhang, J. Zhao, W. W. Yu, and A. L. Rogach, “High color rendering index white light emitting diodes fabricated from a combination of carbon dots and zinc copper indium sulfide quantum dots,”Applied Physics Letters, Vol. 104, 261106, 2014.
17. Lee, C.-T. and T.-J. Wu, “Light distribution and light extraction improvement mechanisms of remote GaN-based white light-emitting-diodes using ZnO nanorod array,”Journal of Luminescence, Vol. 137, 143–147, 2013.
18. Tsai, Y.-L., C.-Y. Liu, C. Krishnan, D.-W. Lin, Y.-C. Chu, T.-P. Chen, T.-L. Shen, T.-S. Kao, M. D. B. Charlton, P. Yu, C.-C. Lin, H.-C. Kuo, and J.-H. He, “Bridging the ‘green gap’ of LEDs: Giant light output enhancement and directional control of LEDs via embedded nano-void photonic crystals,” Nanoscale, Vol. 8, 1192–1199, 2016.
19. Chen, Z.-X., Y. Ren, G.-H. Xiao, J.-T. Li, X. Chen, X.-H. Wang, C.-J. Jin, and B.-J. Zhang, “Enhancing light extraction of GaN-based blue light-emitting diodes by a tuned nanopillar array,”
Chinese Physics B, Vol. 23, 018502, 2014.
20. Li, H., Z. Xu, B. Bao, and Y. Song, “Enhanced light extraction by heterostructure photonic crystals toward white-light-emission,” Journal of Colloid and Interface Science, Vol. 465, 42–46, 2016. 21. Gao, H., K. Li, F.-M. Kong, X.-L. Chen, and Z.-M. Zhang, “Improving light extraction efficiency of
GaN-based LEDs by AlxGa1−xN confining layer and embedded photonic crystals,” IEEE Journal
of Selected Topics in Quantum Electronics, Vol. 18, 1650–1660, 2012.
22. Yu, Z.-G., L.-X. Zhao, S.-C. Zhu, X.-C. Wei, X.-J. Sun, L. Liu, J.-X. Wang, and J.-M. Li, “Optimization of the nanopore depth to improve the electroluminescence for GaN-based nanoporous green LEDs,”Materials Science in Semiconductor Processing, Vol. 33, 76–80, 2015.
23. Chen, T. P., C. L. Yao, C. Y. Wu, J. H. Yeh, C. W. Wang, and M. H. Hsieh, “Recent developments in high brightness LEDs,” International Society for Optics and Photonics, 2008.
24. Xu, F., Z. Lv, X. Lou, Y. Zhang, and Z. Zhang, “Nitrogen dioxide monitoring using a blue LED,”
Applied Optics, Vol. 47, 5337–5340, 2008.
25. Sacks, Z. S., D. M. Kingsland, R. Lee, and J.-F. Lee, “A perfectly matched anisotropic absorber for use as an absorbing boundary condition,” IEEE Transactions on Antennas and Propagation, Vol. 43, 1460–1463, 1995.
26. Kohler, U., D. J. As, B. S. Ttker, T. Frey, K. Lischka, J. Scheiner, and R. Goldhahn, “Optical constants of cubic GaN in the energy range of 1.5–3.7 eV,” Journal of Applied Physics, Vol. 85, 404–407, 1999.
27. Synowicki, R. A., “Spectroscopic ellipsometry characterization of indium tin oxide film microstructure and optical constants,” Thin Solid Films, Vol. 313, 394–397, 1998.
28. Wiesmann, C., K. Bergenek, N. Linder, and U. T. Schwarz, “Photonic crystal LEDs — Designing light extraction,” Laser &Photonics Review, Vol. 3, 262–286, 2009.
29. Zhmakin, A. I., “Enhancement of light extraction from light emitting diodes,” Physics Reports, Vol. 498, 189–241, 2011.
30. David, A., C. Meier, R. Sharma, F. S. Diana, S. P. DenBaars, E. Hu, S. Nakamura, C. Weisbuch, and H. Benisty, “Photonic bands in two-dimensionally patterned multimode GaN waveguides for light extraction,” Applied Physics Letters, Vol. 87, 101107, 2005.
modes distribution,”Applied Physics Letters, Vol. 88, 061124, 2006.
32. Long, D. H., I.-K. Hwang, and S.-W. Ryu, “Design optimization of photonic crystal structure for improved light extraction of GaN LED,”IEEE Journal of Selected Topics in Quantum Electronics, Vol. 15, 1257–1263, 2009.
33. Shen, X. X., Y. Z. Ren, G. Y. Dong, X. Z. Wang, and Z. W. Zhou, “Optimization design of holographic photonic crystal for improved light extraction efficiency of GaN LED,” Superlattices Microstructure, Vol. 64, 303–310, 2013.