Implementation of Logistic Regression Algorithm for Complaint
Text Classification in Indonesian Ministry of Marine and Fisheries
UmniySalamah *, DesiRamayanti **
*Faculty of Computer Science, UniversitasMercuBuana, Jakarta, Indonesia Email: *[email protected], **[email protected]
---
************************
---Abstract:
Social media is usually used to express emotion in opinion or complaint statement regarding an object. In organization, this statement contained opinion and complaint to a service or program by it organization. This feedback can be used by organization to improve and enhance their quality. This research attempted to classify the reports from LAPOR! based on complaint and non-complaint using machine learning algorithm named Logistic regression (LR). This research completed through five research phases. The first phase is data collection, which is followed by crawling and labelling dataset, procession data, modelling dataset using Logistic Regression (LR), and evaluating classifier performance. As the result, the Logistic Regression model using Count Vectorizer feature extraction achieved better performance than Tfidf Vectorizer.
Keywords —Indonesian text,marine and fisheries sciences, logistic regression, text classification
---
************************
---I. INTRODUCTION
Today, information and communication technology development contribute to the new application that support our daily life in many sectors, including cultural heritage [1], [2], government [3], [4], medical [5] and so forth. One of the current famous applications is social media that has been used by people for all range of ages. Social media is usually used to express emotion in opinion or complaint statement regarding an object [6]. The growth of text data contained opinion or complaint in social media indicated the importance of social media channels to campaign or publish about programs or services that is launched by governments or other organizations [7].
One of online aspiration in Indonesia based social media. The people's online aspiration and complaints services (LAPOR!) is a means of social media-based aspirations and compliants that are
carried out with the principles of easy, integrated, and complete. LAPOR!'s site is managed and developed by the Ministry of State Apparatus Empowerment and Bureaucratic Reform with the Ministry of Home Affairs, the President's Staff Office, and the Republic of Indonesia Ombudsman as a channel for community participation for the supervision of development and public services in Indonesia.
Reports from people will be verified and forwarded to the authorized agency to be followed up. To manage the reports and accelerate the feedback, it required the application that can classify complaint and non-complaint report.
One of machine learning algorithms has been used in text classification is Logistic Regression. Logistic Regression can predict output or target in several categories. In this case, the algorithm will classify text data into two classes (1, -1), including complaint and non-complaint. Logistic regression
International Journal of Computer Techniques -– Volume 5 Issue 5, Sep- Oct 2018
ISSN: 2394-2231 http://www.ijctjournal.org Page 75
(LR) have been used to several problems in data mining and machine learning in which Logistic regression (LR) explained between response variable and predictor variables.
This research is focused to classify complaint and non-complaint reports from LAPOR!.This study implemented machine learning algorithm named Logistic regression (LR) for predicting the reports data.
II. LITERATURE REVIEW
Logistic Regression
Logistic Regression (LR) is the development of linear regression techniques for situations where outputs are categorical variables. Logistic Regression has been widely used in various data mining and machine learning problems where LR describes the response variables with one or more predictor variables [9].
In practice, situations involving categorical results are very common. In the case of sentiment analysis, for example, predictions can be made for positive, negative, or neutral outcomes. Like a linear regression method, logistic regression describes the predictor variable with its response variable. In logistic regression generally the response or target is dichotomous (consisting of two categories including 0 and 1), so it will follow the Bernoulli distribution with probabilistic functions as follows [9]:
= 1 −
with = 0,1, and for
=1 + ++ + ⋯ ++ ⋯ +
The equation is then transformed by a logit transformation to get the function which is linear in its parameters. So it is easier to predict the regression parameters, formulated as follows:
= 1 − = + + ⋯ +
Related Work
The recent works have been proposed Logistic regression (LR) algorithm to solve the research problems, e.g. Cheng and Eyke (2009), Rus et al. (2009), Freyberger et al. (2004), Feng and Back (2009), Kotsiantis et. al (2003), Mittal (2009) and Felix (2014).
Cheng and Eyke (2009) proposed the combination of Instance Based Learning and Logistic Regression to complete the multi-label classification [10]. Freyberger et al. (2004) proposed Logistic regression (LR) algorithm to find the best fitting of transfer model in case student learning data [11].
Rus et al. (2009) attempted to compare the result of data processing using several machine learning method for student mental model detection, e.g. Naïve Bayes, Bayes net, Support Vector Machines (SVM), Logistic Regression and Decision Trees [12].
Feng and Back (2009) proposed logistic regression for construction model of transfer in order to predict student can represent their knowledge [13]. Kotsiantiset. al (2003) attempted to classify student dropout prediciton by using Neural Network, Decision Tree, Naïve Bayes, Instance Based Learning, Logistic Regression, and Support Vector Machine (SVM) [14].
Mittal (2009) completed research about stock prediction based on twitter data using Linear Regression, Logistic Regression, SVM, and SOFNN [15]. Felix (2014) proposed classifier ensembls learning to increase accuration of tweet sentiment analysis [16]
III. METHODOLOGY
Fig.Error! No sequence specified. Research methodo
IV. EXPERIMENTS AND RESULTS
The stages in this research such as preprocessing, classification, validation and evaluation, are conducted in python programming language and scikit-learn library.
The preprocessing stage is done by removing stop words and extracting features using TfidfVectorizer and CountVectorizer, the feature extraction function in sklearn library. Classification in this stage is done using the Logistic Regression in sklearn library. The Validation in this stage is done using Cross Validation where the precentage of training sample 70% and testing sample 30%.
The feature that we extracted using TfidfVectorizer and CountVectorizer
step then we used them to compare the best model.
Data Collection
Crawling and Labeling
Dataset
Data Preprocessing Modelling
using Logistic Regression
Classifier Perfomance
Evaluation
Research methodology
In first phase we collect dataset from
select text reports from Maritime categories. Then, we label the dataset based on tag label. The dataset are presented in Figure 1. In the second phase, the collected and labelled data is pre
delete unimportant text data (stop
and then we conducted a feature extraction using TfidfVectorizer and CountVectorizer to be compare in modeling phase. In third phase, we model the data using training data, and then classified the testing data using this model. The last phase, we evaluated performance of classifier logistic regression for dataset with marine and fisheries domain.
Fig. 1 Dataset
The stages in this research such as preprocessing, classification, validation and evaluation, are conducted in python programming
The preprocessing stage is done by removing stop words and extracting features using TfidfVectorizer and CountVectorizer, the feature extraction function in sklearn library. Classification in this stage is done using the Logistic Regression in sklearn library. The Validation in this stage is done using Cross Validation where the precentage of training sample 70% and testing sample 30%.
The feature that we extracted using TfidfVectorizer and CountVectorizerin previous step then we used them to compare the best model.
The performance evaluation results for Logistic Regression using TfidfV
CountVectorizer feature extraction are presented in Table 1.
Table.1 Research methodology
Acc F1 score
Precision
Tfidf 0.9181 0.9181 0.9191
Count 0.9356 0.9355 0.9406
Crawling and Labeling
Dataset
Data Preprocessing
In first phase we collect dataset from twitter, and select text reports from Maritime categories. Then, we label the dataset based on tag label. The dataset are presented in Figure 1. In the second phase, the collected and labelled data is pre-processed to
stop-word removal), and then we conducted a feature extraction using TfidfVectorizer and CountVectorizer to be compare in modeling phase. In third phase, we model the data using training data, and then classified the ting data using this model. The last phase, we evaluated performance of classifier logistic regression for dataset with marine and fisheries
The performance evaluation results for Logistic Regression using TfidfVectorizer and CountVectorizer feature extraction are presented in
Table.1 Research methodology
Precision Recall Kappa
0.9181 0.8363
International Journal of Computer Techniques -– Volume 5 Issue 5, Sep- Oct 2018
ISSN: 2394-2231 http://www.ijctjournal.org Page 77
The result shows that Logistic Regression using CountVectorizer feature extraction achieved better performance than TfidfVectorizer feature extraction.
The precision, recall, and f1-score for each class using TfIdfVectorizer presented in Table 2:
Table.2 precision, recall, and f1-score for each class using TfIdfVectorizer
class precision recall F1-score
0 0.94 0.90 0.92
1 0.90 0.94 0.92
average 0.92 0.92 0.92
The precision, recall, and f1-score for each class using Count Vectorizer presented in Table 3:
Table.3 precision, recall, and f1-score for each class using CountVectorizer
class precision recall F1-score
0 0.99 0.89 0.93
1 0.89 0.99 0.94
average 0.94 0.94 0.92
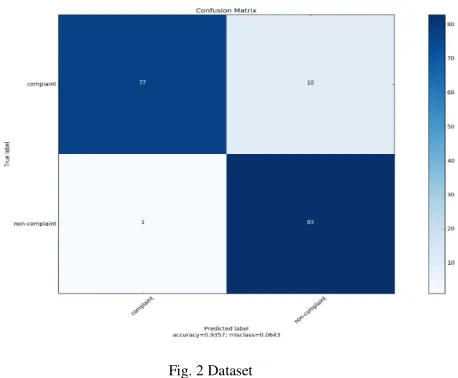
The confusion matrix for the testing data using
TfidfVectorizer is presented in Figure 2.
Fig. 2 Dataset
The confusion matrix for the testing data using CountVectorizer is presented in Figure 2.
V.CONCLUSION
This research attempted to classify the reports based on complaint and non-complaint using machine learning algorithm named Logistic regression (LR). This research completed through five phases. The first phase is data collection, which is followed by crawling and labelling dataset, pre-processing data include stop-word removal and feature extraction, modelling dataset using Logistic Regression (LR), and evaluating classifier performance. As the result, the Logistic Regression model using CountVectorizer feature extraction achieved better performance than TfidfVectorizer.
VI. ACKNOWLEDGMENT
This research was supported and funded by an internal research grant (named penelitian internal) from UniversitasMercuBuana.
VII. REFERENCES
Science and Computational Intelligence, Jakarta, 2015.
[2] H. Noprisson, E. Hidayat, and N. Zulkarnaim, “A Preliminary Study of Modelling Interconnected Systems Initiatives for Preserving Indigenous Knowledge in Indonesia,” in 2015 International Conference on Information Technology Systems and Innovation (ICITSI), 2015, pp. 1–6.
[3] W. P. Sari, E. Cahyaningsih, D. I. Sensuse, and H. Noprisson, “The welfare classification of Indonesian national civil servant using TOPSIS and k-Nearest Neighbour (KNN),” in Research and Development (SCOReD), 2016 IEEE Student Conference on, 2016, pp. 1–5.
[4] D. Fitrianah, A. N. Hidayanto, R. A. Zen, and A. M. Arymurthy, “APDATI: E-Fishing Logbook for Integrated Tuna Fishing Data Management,” J. Theor. Appl. Inf. Technol., vol. 75, no. 2, 2015.
[5] M. Sadikin, M. I. Fanany, and T. Basaruddin, “A New Data Representation Based on Training Data Characteristics to Extract Drug Name Entity in Medical Text,”
Comput.Intell.Neurosci., vol. 2016, 2016.
[6] M. O. Pratama, R. Meiyanti, H. Noprisson, A. Ramadhan, and A. N. Hidayanto, “Influencing factors of consumer purchase intention based on social commerce paradigm,” in Advanced Computer Science and Information Systems (ICACSIS), 2017 International Conference on, 2017, pp. 73– 80.
[7] H. Noprisson, N. Husin, M. Utami, PujiRahayu, Y. G. Sucahyo, and D. I. Sensuse, “The Use of a Mixed Method Approach to Evaluate m-Government Implementation,” in 2016 International Conference on Information Technology Systems and Innovation (ICITSI), 2016.
[8] B. J. Jansen, M. Zhang, K. Sobel, and A. Chowdury, “Twitter Power: Tweets as Electronic Word of Mouth,” J. Am. Soc. Inf. Sci. Technol., vol. 60, no. 11, pp. 2169–2188, 2009.
[9] D. W. Hosmer and S. Lemeshow, “Applied Logistic Regression.” New York: John Wiley & Sons, Inc, 2000.
[10] W. Cheng and H. Eyke, “Combining Instance-Based Learning and Logistic Regression for Multilabel Classification,” pp. 1–15, 2009.
[11] J. Freyberger, N. T. Heffernan, and C. Ruiz, “Using Association Rules to Guide a Search for Best Fitting Transfer Models of Student Learning,” 2004.
[12] V. Rus, M. Lintean, and R. Azevedo, “Automatic Detection of Student Mental Models During Prior Knowledge Activation in MetaTutor,” pp. 161–170, 2009.
[13] M. Feng and J. Beck, “Back to the future : a non-automated method of constructing transfer models,” pp. 240–249, 2009.
[14] S. B. Kotsiantis, C. J. Pierrakeas, and P. E. Pintelas, “Preventing Student Dropout in Distance Learning Using Machine Learning Techniques,” pp. 267–274, 2003.
[15] A. Mittal, “Stock Prediction Using Twitter Sentiment Analysis,” no. June, 2009.