Scholarship@Western
Scholarship@Western
Electronic Thesis and Dissertation Repository
11-12-2018 5:00 PM
The Effect of Function-blocking RHAMM Peptides in a Mouse
The Effect of Function-blocking RHAMM Peptides in a Mouse
Model of Bleomycin-induced Systemic Sclerosis
Model of Bleomycin-induced Systemic Sclerosis
Kitty Y. Wu
The University of Western Ontario
Supervisor Turley, Eva A
The University of Western Ontario Co-Supervisor Yazdani, Arjang
The University of Western Ontario Graduate Program in Surgery
A thesis submitted in partial fulfillment of the requirements for the degree in Master of Science © Kitty Y. Wu 2018
Follow this and additional works at: https://ir.lib.uwo.ca/etd
Part of the Skin and Connective Tissue Diseases Commons
Recommended Citation Recommended Citation
Wu, Kitty Y., "The Effect of Function-blocking RHAMM Peptides in a Mouse Model of Bleomycin-induced Systemic Sclerosis" (2018). Electronic Thesis and Dissertation Repository. 5884.
https://ir.lib.uwo.ca/etd/5884
This Dissertation/Thesis is brought to you for free and open access by Scholarship@Western. It has been accepted for inclusion in Electronic Thesis and Dissertation Repository by an authorized administrator of
i
Systemic sclerosis is a chronic, fibrotic disorder associated with high disease-specific mortality
and morbidity. Cutaneous manifestations include dermal thickening and obliteration of dermal
adipose tissue. The efficacy of function-blocking Rhamm peptides, NPI-110 and NPI-106, were
tested in reducing skin fibrosis and promoting adipogenesis in a bleomycin-induced mouse model
of systemic sclerosis. NPI-110 reduced both visible measures of fibrosis (dermal thickness,
collagen density, and fibril bundling) and mRNA expression of pro-fibrotic genes (Tgfb1, c-Myc,
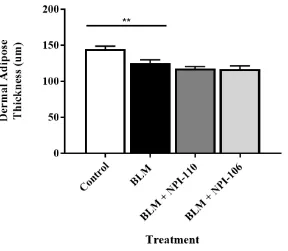
Col1a1, Col3a1). While there was no measurable change in dermal adipose thickness, NPI-110
treatment upregulated Perilipin mRNA and Adiponectin protein expression and is therefore
hypothesized to create a pro-adipogenic microenvironment. NPI-106 was less effective in
reversing dermal fibrosis and did not affect adipogenesis. Transcriptomic analyses suggest a
mechanism where Rhamm stabilizes β-catenin, activates Erk1 and c-Myc, and causes fibroblast
activation and suppression of adipocyte differentiation. Rhamm function-blocking peptides
reverse these effects and present a novel treatment method for cutaneous fibrosis in systemic
sclerosis.
ii
Animal experiments, including peptide injection, animal sacrifice, and collection of skin tissue
samples were conducted by Stelic MC, Inc under the direction of Dr. Yuichiro Shibazaki.
Histology slides stained with Masson’s Trichrome, Picrosirius Red, and H&E were kindly
provided by Stelic MC. All subsequent experiments were performed in Dr. Eva Turley’s
laboratory.
I performed all preliminary experiments including RT-PCR (Col1a1, Col3a1, c-Myc, Rhamm,
Tgfb1), immunohistochemistry (Tgfb1, c-Myc, adiponectin), polarized microscopy, and RT2
transcriptomic profile assays to optimize the protocol, define antibody/cDNA concentrations, and
determine imaging and analysis parameters. I performed polarized microscopy imaging of
picrosirius red stained slides in Dr. Geoffrey Pickering’s laboratory at Robarts Research Institute,
under the guidance of Caroline O’Neil and Hao Yin.
Stephanie Kim assisted in completing technical replicates for immunohistochemistry (Tgfb1,
adiponectin) and RT-PCR (Col3a1, Plin, c-Myc, Rhamm) experiments. Alexis Sabino assisted in
iii
I am very grateful for the opportunity to participate in the Master of Science in Surgery program.
In addition to all of the wonderful lecturers, I would like to thank Dr. Abdel Lawendy, Janice
Sutherland, and Kristine Schroeder for coordinating an extremely cohesive and enriching
academic program.
To Dr. Eva Turley and Dr. Arjang Yazdani, my deepest gratitude for your continued mentorship,
guidance, and support. Thank you for always making the time for research meetings and weekend
emails and for providing the inspiration and encouragement for this project. Thank you to all of
the members of the Turley lab, Conny, Kaustuv, Jenny, Jess, Katelyn, Violet, Alexis, Leslie,
Joselia and Khandakar, for your help in troubleshooting experiments. A very special thanks to
Stephanie Kim. I cannot describe how grateful I am to have had the opportunity to work with you.
Your work ethic and dedication continue to inspire me.
To my parents, thank you for your unwavering love and support.
And to Eugene, who makes all of this possible.
iv
Table of Contents
ABSTRACT……….i
CO-AUTHORSHIP STATEMENT……….ii
ACKNOWLEDGEMENTS……….iii
TABLE OF CONTENTS……….iv
LIST OF TABLES………...vii
LIST OF FIGURES………viii
LIST OF SUPPLEMENTAL TABLES.………..x
LIST OF ABBREVIATIONS………..xi
1 INTRODUCTION……….1
1.1 Systemic Sclerosis……….1
1.1.1 Classification………...1
1.2 Pathophysiology……….2
1.2.1 Etiology………...2
1.2.2 Fibroblasts………...3
1.2.3 Tgfb1..……….3
1.2.4 Dermal adipose tissue……….4
1.2.5 Ppary..……….6
1.2.6 Adiponectin……….6
1.2.7 Wnt/β-catenin………..7
1.3 Hyaluronic Acid……….7
1.3.1 HA receptors………...8
1.4 Developing targeted therapies………9
1.4.1 Function-blocking Rhamm peptides...………..10
1.5 Animal Models……….11
v
3 METHODS………...16
3.1 Injectable peptide NPI-110 and NPI-106 Formulations………..16
3.2 Animal Studies……….16
3.2.1 Animal Care………..16
3.2.2 Mouse Treatment Groups……….17
3.2.3 Tissue Collection………..19
3.3 Effect of Peptide NPI-110 and NPI-106 on Fibrosis………...19
3.3.1 Effect of peptides on body weight………19
3.3.2 Effect of peptides on dermal thickness……….19
3.3.2.1 Masson’s Trichrome staining……….19
3.3.2.2 Quantification of dermal thickness………19
3.3.3 Effect of peptides on collagen density, bundling, and gene expression…...20
3.3.3.1 Picrosirius Red staining……….20
3.3.3.2 Quantification of area fraction of collagen………20
3.3.3.3 Quantification of collagen bundling………..20
3.3.3.4 RT-PCR analysis of Col1a1 and Col3a1 mRNA expression…....21
3.4 Effect of Peptide NPI-110 and NPI-106 on Adipogenesis………..24
3.4.1 Effect of peptides on dermal adipose thickness………24
3.4.2 Effect of peptides on Adiponectin protein expression………...24
3.4.3 Effect of peptides on Perilipin mRNA expression………...…………25
3.5 Elucidating the mechanism of NPI-110 and NPI-106 Function………..25
3.5.1 Bioinformatic analyses……….25
3.5.1.1 RT2 Profiler PCR Mouse Fibrosis Array………...25
3.5.1.2 RT2 Profiler PCR Mouse Adipogenesis Array………..26
3.5.1.3 Bioinformatic Analysis………..29
3.5.1.4 Confirmation of Tgfb1 mRNA expression with RT-PCR……...29
vi
3.5.1.7 c-Myc Immunohistochemistry………...30
3.5.2 Effect of peptides on Rhamm mRNA expression…...………..31
3.6 Statistical Analysis………...31
4 RESULTS……….32
5 DISCUSSION………...61
6 CONCLUSIONS………..73
7 REFERENCES……….74
vii
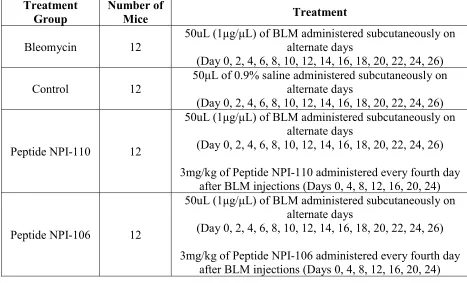
Table 1. Study protocol treatment groups………18
viii
Figure 1. Comparative anatomy of human and mouse skin………..….5
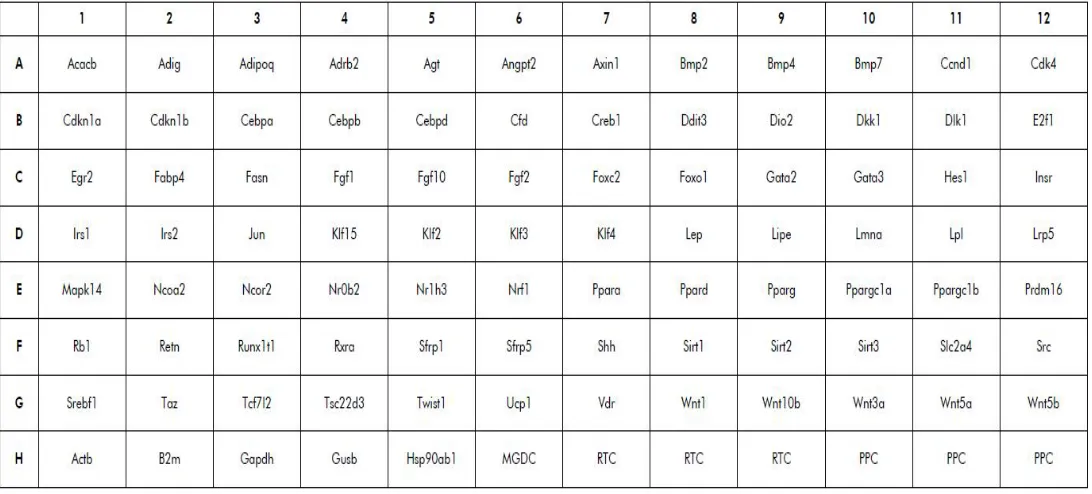
Figure 2. Fibrosis pathway-focused 96-well plate set-up………..…..27
Figure 3. Adipogenesis pathway-focused 96-well plate set-up………...28
Figure 4. Peptide NPI-110 and NPI-106 treatment does not restore normal weight gain……….33
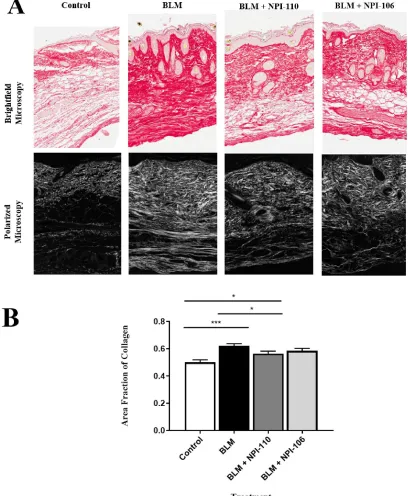
Figure 5. Peptide NPI-110 and NPI-106 reduces collagen deposition and dermal thickening…....36
Figure 6. Peptide NPI-110 but not NPI-106 reduces the area fraction of collagen…………...…...37
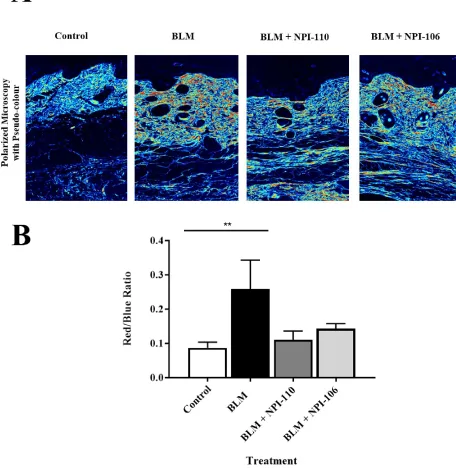
Figure 7. Neither NPI-110 or NPI-106 restores collagen density to baseline …………..……...…38
Figure 8. Peptide NPI-110 and NPI-106 suppress Col1a1 mRNA expression and reduce the
Col1a1:Col3a1 ratio ………..………...40
Figure 9. Peptide NPI-110 and NPI-106 treatment does not ameliorate the detectable loss of dermal adipose issue………..42
Figure 10. Peptide NPI-110 treatment restores Adiponectin protein expression…………..……43
Figure 11. Peptide NPI-110 and NPI-106 treatment partially restores Perilipin mRNA
expression………..44
Figure 12. Transcriptional profiling of fibrosis-specific (A) and adipogenesis-specific (B)
ix
Figure 13. Focused pathway analysis of top affected canonical pathways and regulators with peptide NPI-110 and NPI-106 treatment………...52
Figure 14. Peptide NPI-110 and NPI-106 treatment does not affect Tgfb1 mRNA expression…...53
Figure 15. NPI-110 but not NPI-106 reduces Tgfb1 protein levels within the dermis and dermal adipose tissue layers………...54
Figure 16. Inhibition of c-Myc mRNA expression is predicted within three signalling cascades of the canonical metastatic colorectal cancer pathway………...……...56
Figure 17. Peptide NPI-110 and NPI-106 treatment decrease c-Myc mRNA expression below baseline………..57
Figure 18. Peptide NPI-110 and NPI-106 treatment reduce c-Myc protein expression……..…...58
Figure 19. Peptide NPI-110 and NPI-106 attenuate Rhamm mRNA expression………….……..60
x
Supplementary Table 1. Expression of 84 fibrosis-pathway specific genes………..……47
xi
ADSC Adipose-derived stem cell
ANOVA Analysis of variance
αSMA Alpha smooth muscle actin
BLM Bleomycin
BSA Bovine serum albumin
CD44 Cluster differentiation 44
c-Myc c-Myelocytomatosis gene
Col1a1 Collagen 1 gene
Col3a1 Collagen 3 gene
Ctgf Connective tissue growth factor
Ctnnb1 Catenin-beta 1 gene
DcSSc Diffuse cutaneous systemic sclerosis
DHLNL Dihydroxyl lysine-norleucine
Dkk Dickkopf
ECM Extracellular matrix
EMT Epithelial-mesenchymal transition
EndoMT Endothelial-mesenchymal transition
Erk1/2 Extracellular signal-related kinase 1/2
Gapdh Glyceraldehyde 3-phosphate dehydrogenase
H&E Hematoxylin and eosin
HA Hyaluronic acid
Hare Hyaluronan receptor for endocytosis
HLA Human leukocyte antigen
Hmmr Hyaluronan-mediated motility receptor gene
HMW-HA High molecular weight hyaluronic acid
xii
LMW-HA Low molecular weight hyaluronic acid
LSD Least significant difference
Lyve1 Lymphatic vessel endothelial hyaluronan receptor 1
MAP kinases Mitogen-activated protein kinases
Micro-CT Micro computer tomography
MSC Mesenchymal stem cell
PBS Phosphate-buffered saline
Plin Perilipin gene
Ppary Peroxisome proliferator-activated receptor gamma
RGB Red, green, blue
Rhamm Receptor for hyaluronan-mediated motility
RT-PCR Real-time polymerase chain reaction
SEM Standard error of measurement
SSc Systemic sclerosis
Tgfb1 Transforming growth factor beta
Tlr2,4 Toll-like receptor 2, 4
Tnf Tumour necrosis factor
Wisp2 WNT inducible signaling pathway protein 2
1
Introduction
1.1Systemic Sclerosis
Systemic sclerosis (SSc) is a chronic, progressive, disorder characterized by extensive cutaneous
and visceral fibrosis1,2. The estimated prevalence ranges from 0.07 to 5 per 100 000 depending on ethnicity and geographic location, with the highest prevalence in North America3,4 Although a rare disease, SSc has the highest mortality of all rheumatologic conditions with a median survival from
time of diagnosis of 11 years5. The cumulative 5-year survival following diagnosis is 74.9%, and 10-year survival is only 62.5%1,3 with mortality due to progressive visceral organ fibrosis, interstitial lung disease, and pulmonary arterial hypertension6,7.
This high disease-specific mortality rate is also associated with substantial morbidity, as the
disabling multisystemic effects of SSc pervade across all aspects of daily life. Although not life
threatening, progressive fibrosis and thickening of the skin, especially of the hands and face,
present a significant burden for patients. Skin tightness and joint contractures can lead to
impairments in hand function, mobility, and significant disability. Fibrosis around the mouth
results in difficulties with mouth opening that interfere with the basic tasks of speaking and eating1. Similarly, disfiguring changes in facial appearance causing ‘mask-like facies’ and loss of facial
expressions are a source of social distress and self-image issues8,9. This is further compounded by the psychologic impact due to the progressive and heterogenous disease course with the
uncertainty of future disease progression10–12.
1.1.1 Classification
The term scleroderma has recently been replaced with more precise nomenclature to describe the
four subtypes of systemic sclerosis based on clinical symptoms, autoantibody production, and
systemic involvement: limited cutaneous systemic sclerosis (LcSSc, previously also CREST
syndrome), diffuse cutaneous systemic sclerosis (DcSSc), morphea, and systemic sclerosis sine
scleroderma13. LcSSc describes a disease subset with sclerotic changes of the face and only of the
skin distal to the elbow and knees, associated with a high risk of interstitial lung disease and
extremities and a predilection towards developing interstitial lung disease, progressive lung
fibrosis, renal crisis, and significant hand disability with Raynaud’s phenomenon and digital
ulcers13. Morphea, previously known as localized scleroderma, refers to involvement limited to
the skin without associated visceral organ fibrosis. Controversy still exists as to whether morphea
represents an early manifestation of systemic sclerosis or actual distinct subtypes14. Systemic
sclerosis sine scleroderma manifests with the fibrosis of visceral organs without cutaneous
fibrosis15.
Currently, there are no curative or disease modifying therapies for systemic sclerosis. Treatment
is directed towards symptom and complication management and there remains an urgent need for
the development of targeted anti-fibrotic therapies. This lack of effective treatment options stems
from the incomplete understanding of the etiology of systemic sclerosis.
1.2 Pathophysiology
1.2.1 Etiology
Systemic sclerosis is an autoimmune disease emerging from the complex interplay of genetic
predisposition and environmental factors, with an unknown exact etiology. Geo-epidemiologic
studies show higher prevalence and mortality rates within African American populations16 as well
as in certain rural communities found to have specific HLA haplotypes that confer disease
susceptibility17. However, genetic factors cannot fully explain the development of SSc, as there is an extremely low clinical concordance of SSc within monozygotic twins18,19, suggesting the presence of secondary acquired genetic or environmental triggers. Occupational exposures (silica
dust, organic and chlorinated solvents, epoxy resins)1,20, chemotherapy or radiotherapy treatment21, and certain infection (cytomegalovirus, parvovirus B19, Ebstein Barr virus, and
Helicobacter pylori)2 have all been implicated as possible inciting agents. This is further complicated by the multitude of systemic sclerosis-like diseases (scleromyxedema, eosinophilic
1.2.2 Fibroblasts
A cardinal feature of SSc is thickening and fibrosis of the skin. Fibrosis occurs from the excessive
deposition of extracellular matrix (ECM) products such as collagen, fibronectin, and hyaluronan
by activated fibroblasts23,24. Fibroblasts are the predominant cells in connective tissues that
regulate ECM synthesis and turnover. During homeostasis, they maintain a balance between
matrix production and breakdown through expression of matrix proteins/proteoglycans as well as
various matrix proteinases and glycosidases25.
A primary event, such as viral toxins, aberrant autoantibody activation, or vascular endothelial
injury precedes fibrosis and causes the upregulation of pro-inflammatory signals resulting in the
activation of fibroblasts23,26. Activated fibroblasts are able to differentiate into myofibroblasts,
which resemble smooth muscle cells in phenotype. Myofibroblasts are positive for the marker
alpha-smooth muscle actin (αSMA) and actively synthesize, bundle, and contract collagen fibrils.
These processes are normal parts of wound healing, where myofibroblasts help to contract the
wound edges and deposit ECM products required for granulation tissue formation. This activity is
normally attenuated by myofibroblast apoptosis; however, if myofibroblast activity is sustained,
then tissue fibrosis ensues. For example in SSc, fibroblasts subvert these intrinsic regulatory
mechanisms, resulting in unopposed fibroblast activation independent of external stimuli, leading
to the ongoing pathologic remodelling of the ECM26,27.
1.2.3 Tgfb1
Tissue fibrosis is driven by transforming growth factor β (Tgfb1), a master regulator involved in
wound healing, inflammation, and pathologic fibrosis28,29. Tgfb1, a fibrogenic cytokine, is uniformly upregulated in fibrotic tissues and induces fibroblasts to differentiate into
myofibroblasts29. Activated fibroblasts both upregulate the production of Tgfb1, increase their own expression of Tgfb1 receptors, and produce factors such as connective tissue growth factor (Ctgf),
a cofactor that enhances Tgfb1 binding30, to establish a vicious cycle of autocrine stimulation31.
Understanding of the origin of activated fibroblasts and myofibroblasts is evolving.
Myofibroblasts in SSc have long been thought to arise from resident fibroblasts in the affected
tissues; however, recent research using new experimental tools for lineage tracing suggest a role
cells33,34, endothelial cells35, pericytes36, fibrocytes37, and adipocytes38,39 have been shown to
trans-differentiate into activated myofibroblast-like cells which are positive for αSMA and can
produce and bundle collagen. Tgfb1 signaling has been implicated in guiding this cellular plasticity
since it can induce both epithelial-mesenchymal transition (EMT) and endothelial-mesenchymal
transition (EndoMT) in culture35,40. In vivo lineage tracing studies have shown that dermal
adipocyte progenitors also contribute to the population of activated fibroblasts and
myofibroblasts39. In culture analyses of human adipocyte-derived progenitor cells confirm that Tgfb1 induce myofibroblast-like changes in adipocyte phenotype and transcriptome39. Collectively these studies point to a more complex and active role of the dermal adipose tissue in
the development of cutaneous fibrosis, rather than just mere consequence of fibrotic changes.
1.2.4 Dermal adipose tissue
In addition to dermal thickening, a consistent but less well-recognized finding is the loss of dermal
adipose tissue in SSc41. This is seen in both excisional biopsies of patients with SSc and in multiple animal models of SSc and cutaneous fibrosis42–44. This loss of dermal adipose tissue is a result of both adipocyte apoptosis and cellular reprogramming of adipocytes into myofibroblasts,
suggesting the primary pathological mechanism of SSc may reside within dermal adipose tissue
rather than in the dermis39.
Dermal adipose tissue is a layer of unilocular adipocytes found surrounding hair follicles and
pilosebaceous units45. In rodents, which are loose skinned, the dermal adipose tissue is between the reticular dermis and panniculosus carnosus muscle layers. This is an adipocyte depot separate
from the subcutaneous adipose tissue layer, which is found deeper to the panniculosus carnosus45. Human skin does not have a panniculosus carnosus layer and the dermal adipose tissue form
cone-like extensions surrounding the hair follicular unit. The dermal adipose tissue lies superficial to,
and is histologically and metabolically distinct from, the subcutaneous adipose tissue46 (Figure 1). In both human and rodent skin, dermal adipose tissue lies directly below the reticular dermis, and
this positional information may inform cell-fate decision making. Fibroblasts demonstrate
‘positional identity’ and their transcriptomic profiles vary according to anatomic location47. Aberrant signalling within dermal adipose tissue may cause the adjacent reticular fibroblasts to
1.2.5 Ppary
The nuclear transcription factor peroxisome proliferator-activated receptor gamma (Ppary) is a
master regulator of adipogenesis and lipoprotein metabolism. Originally identified in adipocytes,
Ppary is also expressed in macrophages, endothelial cells, and fibroblasts48,49. Adipocyte
development occurs in two main steps. Mesenchymal stem cells first become preadipocytes, which
are cells restricted to an adipocytic fate, and then Ppary directs the terminal differentiation of
preadipocytes into mature adipocytes50.
Importantly, Ppary not only promotes adipogenesis but also has potent intrinsic anti-fibrotic
effects23,26. The expression of Ppary is reduced in skin biopsies from SSc patients as well as in
monocytes of healthy African Americans, who have a much higher susceptibility to developing
SSc51,52. Ppary expression attenuates Tgfb1-stimulated collagen production and myofibroblast
differentiation53,54. Furthermore, exogenous ligands of Ppary block Tgfb1-induced
epithelial-mesenchymal transition in lung fibrosis and promote the differentiation of epithelial-mesenchymal
progenitor cells into adipocytes instead of fibroblasts55,56. Rosiglitazone, an approved insulin-sensitizing agent and Ppary agonist, reduces both dermal fibrosis and loss of dermal adipose tissue
in animal models of SSc42,56. This effect is, however, reduced by Tgfb1 which has also been shown to potently inhibit Ppary expression42. The reciprocally inhibitory nature of Tgfb1 and Ppary highlight the intricate and complex balance between adipogenesis and fibrosis.
1.2.6 Adiponectin
The circulating adipokine, adiponectin, is only produced by adipocytes and mediates many of the
anti-fibrotic effects of Ppary. Patients with DcSSc have lower circulating levels of serum
adiponectin, which inversely correlates with disease severity57–59. Adiponectin expression is under the direct transcriptional control of Ppary60, which induces the production of circulating adiponectin by adipocytes. In SSc fibroblasts, adiponectin suppresses collagen and αSMA
expression and attenuates Tgfb1-induced activation of fibroblasts54,61. This illuminates a key feedback mechanism for blocking fibrosis whereby the downstream effector of Ppary, adiponectin,
1.2.7 Wnt/β-catenin
Another key player in the pathogenesis of SSc is Wingless (Wnt), a member of a large family of
secreted glycoproteins that regulate cell fate determination and morphogenesis in early
development. Through its canonical signalling pathway, binding of Wnt ligands stabilize
β-catenin, which translocates to the nucleus and controls transcription of downstream pro-fibrosis
target genes62,63. One specific Wnt ligand, Wnt10b, is increased in lesional SSc skin and drives
fibrosis64. Mice over-expressing Wnt10b exhibit increased collagen production and activation of fibroblasts64.
The canonical Wnt signalling pathway also inhibits adipogenesis and causes lipoatrophy in
transgenic mice64–67. Elegant lineage tracing studies have demonstrated that the lower reticular
dermis shares a common embryologic origin with pre-adipocytes and mature adipocytes68. In early
development, selective activation of β-catenin in the lower reticular dermis increases fibroblast
proliferation and decreases adipocyte differentiation69. Based on in vitro studies, β-catenin suppresses adipogenesis by inhibiting Ppary-directed terminal differentiation of adipocytes, and
thus switches the transcriptional programme towards a fibroblastic fate63.
SSc was initially understood to result from dysregulated signalling within the dermis; however,
recent research has refocused the lens on the interface between the reticular dermis and dermal
adipose tissue. Tgfb, Ppary, and Wnt/β-catenin demonstrate mutually antagonistic effects and
multiple layers of control that maintain the tight balance between adipogenesis and fibrosis. The
disruption in this equilibrium may be the hallmark in the pathogenesis of SSc.
1.3Hyaluronic Acid
Hyaluronic acid (HA), which is found ubiquitously in the ECM and affects both fibrosis and
adipocyte differentiation, may be the homeostatic thermostat regulating this equilibrium. HA is a
large, linear glycosaminoglycan consisting of the repeating disaccharides D-glucuronic acid and
provides hydration and mechanical integrity to tissues. HMW-HA also acts as a template for the
organization of extracellular matrix structures72,73. HMW-HA suppresses inflammation and
fibrosis72,74–76 by spatially protecting cells from immune recognition, and blocking macrophage
infiltration77,78. Locally, HMW-HA provides an ‘adipogenic niche’ supporting pre-adipocyte
survival and differentiation, maintaining the ‘stemness’ of mesenchymal progenitors79–81.
In the event of tissue injury, reactive oxygen/nitrogen species and hyaluronidases are released from
damaged cells which fragment HMW-HA into pro-inflammatory lower molecular weight
oligosaccharides (<500kDa)82–84. These fragments stimulate wound repair processes, such as inflammation, fibroblast migration, myofibroblast differentiation, and ECM production85–87. The persistence of fragmented low molecular weight HA (LMW-HA) leads to unremitting
inflammation with a pathologic consequence of fibrogenesis and tissue architecture destruction88. The accumulation of LMW-HA fragments is demonstrated in liver fibrosis, asthma, inflammatory
bowel disease, and rheumatoid arthritis amongst many other diseases75,89–91. SSc patients have also been found to have higher serum levels of LMW-HA, which is positively correlated with the extent
of cutaneous involvement and severity of systemic disease92–95. LMW-HA fragments are not only pro-fibrotic76,96,97 but anti-adipogenic98,99 and suppress adipocyte differentiation. Collectively this strongly suggests a role for LMW-HA in mediating the pathologic effects of dermal thickening
and dermal adipose atrophy in SSc.
1.3.1 HA Receptors
HA acts through a variety of receptors, most importantly, CD44 and Rhamm (CD168, receptor for
hyaluronan-mediated motility, encoded by gene hmmr). CD44 is a constitutively expressed
integral membrane protein involved in the cellular cytoskeletal dynamics of proliferation and
migration96,100,101. Conversely, Rhamm is transiently expressed only following tissue injury102 and
preferentially binds to LMW-HA fragments. Rhamm is found as an extracellular and intracellular
protein101,103,104. Extracellular Rhamm, which binds to CD44, activates a number of intracellular
kinases, in particular the mitogen-activated protein (MAP) kinases, Erk1 and 2, (extracellular
signal-related kinase 1, 2), which are involved in fibroblast motility and mesenchymal cell
Rhamm-deficient mice exhibit increased adiposity attributed to relief of Ppary suppression by loss of Erk1
activity, which allows the differentiation of preadipocytes into mature adipocytes107. Intracellular
Rhamm acts as an adaptor molecule linking signalling complexes to the cytoskeleton and
complexes with Erk1,2 to direct its subcellular targeting101,108. Cell surface Rhamm associated with
CD44, controls cellular lamella, focal adhesion turnover, and cellular motility through Erk1,2
activity100,108. Rhamm expression is regulated by Tgfb1 and is a downstream effector of this
cytokine in its induction of fibroblast motility and maintenance of myofibroblast
differentiation101,109. Tgfb1 also promotes production of LMW-HA, which further contributes to myofibroblast differentiation110,111.
Thus, depending on its molecular weight, HA can function either as a homeostatic balance or as
the first distress signal that initiates inflammation. HA molds the cellular microenvironment by
preferentially sequestering signalling molecules while blocking others. When fragmented, its
signalling through Rhamm promotes the pro-fibrotic (Tgfb1) and anti-adipogenic (Erk1/2)
environment seen in many pathological fibrotic diseases.
1.4 Developing Targeted Therapies
With no approved disease modifying treatments, the mainstay of systemic and DsSSc management
is oral immunosuppressant agents and symptomatic management of cutaneous fibrosis. Many
treatments have been tried for cutaneous fibrosis, including topical immunosuppressants,
vasodilator drugs, phototherapy, and physiotherapy which have limited benefit and efficacy2,3.
The development of effective targeted therapeutic interventions remains a challenge. Tgfb1, one
of the main drivers and regulators of fibrosis, is an obvious target; however, it has pleiotropic and
often opposing effects on inflammation, which have lead to adverse effects. While Tgfb1
their substantial side effects, including weight gain, peripheral edema and cardiac complications,
preclude their use as a sustainable treatment option114,115.
Rhamm is an attractive therapeutic target for its specific expression within injured and fibrotic
tissues, which also uniquely accumulate LMW-HA. The hyaluronan binding region of Rhamm is
different from other HA receptors in that it demonstrates preferential binding to smaller
inflammatory HA fragments116,117 and has nM rather than µM affinity for these fragments.Since
LMW-HA fragments represent a small percentage of HA even in injured tissues, these two HA
binding properties of Rhamm provide an opportunity to efficiently and selectively sequester
LMW-HA as a method for preventing pro-inflammatory and pro-fibrotic signaling. In addition,
the restricted expression of Rhamm and LMW-HA predict limited off-target side effects and a
good safety profile.
1.4.1 Function-blocking RHAMM peptides
Rhamm function-blocking peptides have recently been developed based on the HA:Rhamm
binding sequence. These peptides function through two mechanisms: 1) binding to and
sequestering HA fragments away from interacting with downstream receptors 2) binding directly
to Rhamm and sterically preventing its association with HA fragments.
The HA receptors CD44, Lyve1 and Hare bind to the link-protein on HA through a conserved 100
amino acid region that forms a long shallow shelf which larger HA polymers fit into118. In contrast, HA:Rhamm binding sequences forms two helices connected by a linker sequence that wrap around
short HA polymers. HA:CD44/Lyve1/Stab-2/Hare interactions thus require conformational fit
while HA:Rhamm interactions rely upon ionic bridges and specific basic amino acids interactions.
The HA:Rhamm binding domains contain the BX7B motif where B is any basic amino acid and X
represents any non-acidic residues119,120. The first rationally designed HA-binding peptide, NPI-106, was based on this Rhamm motif. NPI-106 has the amino acid sequence RGGGRGRRR (R,
arginine; G, glycine residues) and other than a BX7B motif, has no other sequence homology to
Rhamm117. The basic residues spaced 7 amino acids apart allow for ionic interactions between
fragment away from activating its receptors. In a mouse model of bleomycin-induced lung fibrosis,
NPI-106 strongly reduces macrophage chemotaxis, Col1a1 mRNA expression, and
hydroxyproline content in the lung97,121.
Rhamm sequence-mimetic peptides have also been identified that bind to Rhamm via a
homo-dimerization sequence in the linker region between the two HA binding helices and disrupt
interaction with HA. The peptide NPI-102 (644KLKDENSQLKSEVSK) sterically blocks a leucine
zipper necessary for Rhamm signalling107,117. NPI-110 is based on the same peptide sequence as NPI-102 but contains acetylated ends which renders it insensitive to cleavage by proteases and
increases its serum half-life to over 24 hours. NPI-110 was identified by screening for peptides
that promoted the survival and adipogenic differentiation of bone marrow mesenchymal stem cells
and the differentiation of human and mouse pre-adipocytes into mature adipocytes107. Injections of NPI-110 promotes subcutaneous adipogenesis in the dorsal skin and mammary fat pads of rats
and increases the expression of both Ppary and adiponectin. In a model of radiation-induced
mammary fat pad fibrosis, NPI-110 attenuates radiation-induced fibrosis and increases the
expression of adiponectin122. Collectively, this supports the hypothesis that blocking Rhamm signaling, and thus Erk1 activity, will relieve the inhibitory effects of this MAP kinase upon Ppary,
allowing terminal differentiation of adipocytes.
1.5 Animal Models
A well-established mouse model of SSc is daily subcutaneously injections of bleomycin (BLM)123, an anti-tumour antibiotic isolated from Streptomyces verticillus. BLM treatment has identified side
effects of skin edema, hyperpigmentation, and fibrosis124,125. Treatment with 1-100μg BLM either daily or on alternate days induces localized inflammation, dermal fibrosis, and loss of dermal
adipose tissue, which lasts 6 weeks after injections123,126. In this model, dermal fibroblasts become activated, upregulate their expression of collagen, and increase ECM deposition at the site of
injection127. Lung fibrosis is also evident at 3 weeks, even prior to cutaneous fibrosis, confirming the systemic induction of fibrosis126. BLM treatment also recapitulates other aspects of SSc including autoantibody formation and upregulation of inflammatory cytokines. Interestingly, skin
model, however, is the obliterative microangiopathy and perivascular inflammation that is also a
defining feature of SSc128.
Modifications of Yamamoto’s original protocol123 demonstrated no difference between daily or
alternate day BLM treatments on dermal thickness; however, mice in the alternate day treatment
regimen had increased collagen accumulation and number of myofibroblasts129. Comparison of
BLM treatment in different mouse strains show C57BL/6 mice more sensitive to BLM compared
to DBA/2129. There are also gender-dependent differences with male mice of all strains demonstrating more severe phenotypes129. This parallels SSc where there is a predilection for women but more severe disease phenotype and association with systemic involvement in
men130,131.
Other mouse models of SSc include the tight skin-1 mouse, which contains a mutation of the
fibrillin-1 gene132, and tight skin-2 mouse, which is induced by the mutagenic agent ethylnitrosourea133. Both models, however, show thickening of the hypodermis instead of the dermis and do not accurately represent the histological skin changes in human SSc. The chronic
graft-versus-host disease mouse model involves transplantation of immune competent cells from
bone marrow and spleen cells into γ-irradiated mice to incite an alloreactive immune response134. While these mice exhibit many features of SSc including dermal fibrosis, dermal adipose loss, and
pulmonary fibrosis, this model is technically difficult and requires specialized animal care for
immunocompromised mice.
The present study utilizes the BLM-induced murine model for systemic sclerosis based on the ease
of induction of disease phenotype and well-representation within the existing literature allowing
1.6 Identifying the Problem
The cutaneous manifestations of systemic sclerosis result from the aberrant deposition of
extra-cellular matrix components within the dermis and loss of the dermal adipose tissue. The
progressive thickening and tightening of the skin lead to significant patient morbidity, with
limitations in hand function, mouth opening, and facial expression. Rhamm, a receptor for HA, is
transiently expressed in injured tissue and is hypothesized to generate the pro-fibrotic and
anti-adipogenic microenvironment in SSc. Novel Rhamm function-blocking peptides have been
developed that attenuate fibrosis and promote adipogenesis in experimental models, opening a
promising new avenue of exploration in the development of targeted treatments for systemic
2
Thesis Objectives and Aims
The effects of the Rhamm function-blocking peptides, NPI-110 and NPI-106, were investigated in
a bleomycin-induced mouse model of systemic sclerosis. Peptide treatment is hypothesized to
attenuate dermal thickening and restore loss of dermal adipose tissue by redirecting the cellular
microenvironment away from fibrogenesis and towards adipogenesis. Analysis of the peptide
treatment effects and investigation of the regulatory pathways involved was performed through
the three objectives outlined below.
Objective 1: Determine the effect of peptides NPI-110 and NPI-106 on fibrosis in a
bleomycin-induced murine model of systemic sclerosis
BLM-treatment produces dermal thickening and increases collagen deposition. The anti-fibrotic
effects of the peptides were examined through measurements of body weight changes, dermal
thickness, and collagen density, bundling, and mRNA expression.
Aim 1: Determine effect of NPI-110 and NPI-106 treatment on body weight
Aim 2: Quantify the effect of NPI-110 and NPI-106 on dermal thickness using Masson’s
trichrome stained paraffin-processed skin samples
Aim 3: Assess the effect of NPI-110 and NPI-106 on collagen density, bundling, and gene
expression using polarized microscopy of Picrosirius Red birefringence and RT-PCR
Objective 2: Determine the effect of peptides NPI-110 and NPI-106 on adipogenesis in a
bleomycin-induced murine model of systemic sclerosis
BLM-treatment causes loss of dermal adipose tissue. The adipogenic effects of the peptides were
examined through measurements of dermal adipose thickness and analysis of adiponectin protein
and perilipin mRNA expression.
Aim 1: Quantify the effect of NPI-110 and NPI-106 on dermal adipose thickness using
Masson’s trichrome stained paraffin-processed skin samples
Aim 2: Determine the effect NPI-110 and NPI-106 on adiponectin protein expression using
immunohistochemistry of paraffin-processed skin samples
Aim 3: Determine the effect of NPI-110 and NPI-106 on adipogenesis through RT-PCR
analysis of the adipogenic marker, perilipin.
Objective 3: Elucidate the mechanism by which NPI-110 and NPI-106 affect fibrosis and
adipogenesis in a bleomycin-induced murine model of systemic sclerosis
Transcriptional profile analysis of peptide treatment compared to BLM-treatment was performed
to identify potential interacting pathways. Genes of interest, including c-Myc, Tgfb1, and Rhamm
were confirmed with RT-PCR.
Aim 1: Profile 84 fibrosis-pathway specific and 84 adipogenesis-pathway specific genes
and use bioinformatic analysis to identify genes of interest
Aim 2: Confirm the identified genes of interest (Tgfb1, c-Myc) with RT-PCR analysis and
immunohistochemistry of paraffin-processed skin samples
Aim 3: Determine the effect of NPI-110 and NPI-106 treatment on Rhamm mRNA levels
with RT-PCR analysis
3
Methods
3.1 Injectable peptide NPI-110 and NPI-106 Formulations
The HA-binding peptide NPI-106 (peptide sequence RGGRGRRR) and the RHAMM-binding
peptide NPI-110 (peptide sequence 644KLKDENSQLKSEVSK) were synthesized and purified to >95% purity (gift from Dr. L. Luyt, Western University, London, Canada and Eravon
Pharmaceuticals Inc). Peptides were dissolved in PBS and then filter sterilized through a 0.22μm
filter.
3.2 Animal Studies
Animal studies were conducted by Stelic MC, Inc. (Tokyo, Japan) under the direction of Dr.
Yuichiro Shibazaki. All experiments were approved and compliant with the Act of Welfare and
Management of Animals, Standards Relating to the Care and Management of Animals and Relief
of Pain (Ministry of the Environment, Act No. 105 and No. 88), and the Guidelines for Proper
Conduct of Animal Experiments (Science Council of Japan).
3.2.1 Animal Care
Forty-eight six-week-old female C57BL/6J mice (Japan SLC, Japan) were used for the study. Mice
were housed in TPX cages (CLEA Japan) with 6 mice per cage within a temperature-controlled
room with a standard 12-hour light and dark cycle. Sterilized Paper-Clean bedding was provided
and changed weekly. Each mouse was identified with a unique study number engraved on earrings.
Sterilized normal mouse diet was provided ad libitum in a metal lid on top of the cage and on the
floor. Distilled water was provided ad libitum from a water bottle with sipper tube that was
replaced weekly. Mice were weighed daily and monitored for viability and any clinical signs of
3.2.2 Mouse Treatment Groups
Forty-eight mice were randomized into four treatment groups as outlined below in Table 1. A
murine model of bleomycin-induced scleroderma was established based on a modified version of
the Yamamoto protocol123. The dorsal backs of all mice where shaved using a razor prior to
injections. Twelve mice were administered 1μg/μL bleomycin (Lot #15180, Nippon Kayaku,
Japan) in 0.9% saline subcutaneously to the dorsal back at a dose of 50μg per mouse on alternate
days, starting on day 0. In the control group, twelve mice were subcutaneously administered an
equal volume of 50μL 0.9% saline to the dorsal back on alternate days, starting on day 0.
Two peptides (NPI-110 and NPI-106) were tested. Twelve mice were administered subcutaneous
bleomycin injections on alternate days as above and then administered 3mg/kg of Peptide
NPI-110 by subcutaneous injection every fourth day starting on day 0 (day 0, 4, 8, 12, 16, 20, 24).
Twelve mice were administered bleomycin on alternate days as above and then administered
Treatment Group
Number of
Mice Treatment
Bleomycin 12
50uL (1μg/μL) of BLM administered subcutaneously on alternate days
(Day 0, 2, 4, 6, 8, 10, 12, 14, 16, 18, 20, 22, 24, 26)
Control 12
50μL of 0.9% saline administered subcutaneously on alternate days
(Day 0, 2, 4, 6, 8, 10, 12, 14, 16, 18, 20, 22, 24, 26)
Peptide NPI-110 12
50uL (1μg/μL) of BLM administered subcutaneously on alternate days
(Day 0, 2, 4, 6, 8, 10, 12, 14, 16, 18, 20, 22, 24, 26)
3mg/kg of Peptide NPI-110 administered every fourth day after BLM injections (Days 0, 4, 8, 12, 16, 20, 24)
Peptide NPI-106 12
50uL (1μg/μL) of BLM administered subcutaneously on alternate days
(Day 0, 2, 4, 6, 8, 10, 12, 14, 16, 18, 20, 22, 24, 26)
3mg/kg of Peptide NPI-106 administered every fourth day after BLM injections (Days 0, 4, 8, 12, 16, 20, 24)
3.2.3 Tissue Collection
All mice were euthanized on day 28 under pentobarbital sodium anesthesia by exsanguination
through the abdominal aorta. Full thickness skin biopsies of the dorsal back within the area of
injections were collected from each mouse. A portion of skin tissue was fixed in 10% neutral
buffered formalin prior to embedding in paraffin wax for preparation of histologic sections. The
remaining portion was placed into microcentrifuge tubes, snap frozen, and stored at -80oC.
3.3 Effect of Peptide NPI-110 and NPI-106 on Fibrosis
3.3.1 Effect of peptides on body weight
Mice from each group were weighed daily starting on Day 0 and their weight was recorded at
each time point as a percent of their starting Day 0 weight.
3.3.2 Effect of peptides on dermal thickness
3.3.2.1 Masson’s Trichrome Staining
4μm paraffin-processed histology slides were prepared from mouse skin samples from each of the
four treatment groups using a Microm HM 200 Ergostar Microtome (GMI; Ramsey, Minnesota).
Paraffin-processed sections were stained with hematoxylin and eosin and Masson’s Trichrome
according to manufacturer’s instructions (Sigma-Aldrich, St.Louis, Missouri) by Stelic MC, Inc.
3.3.2.2 Quantification of dermal thickness
Masson’s Trichrome stained slides of mouse skin sections were digitized using the Aperio
Scanscope (Leica Biosystems, Wetzlar, Germany) and viewed using the Aperio ImageScope
Viewer (Aperio ePathology Solutions; http://www.aperio.com) at 10X magnification. Dermal
thickness was measured from the epidermal-dermal junction to the dermal-adipose junction. Three
representative sections from twelve mice per treatment group were used for analysis. Three
3.3.3. Effect of peptides on collagen density, bundling, and gene expression
3.3.3.1 Picrosirius Red staining
Paraffin-embedded mouse skin sections were stained for Picrosirius Red according to
manufacturer’s instructions (Polysciences, Warrington, PA) with the help of Robarts Research
Institute. Representative sections from seven mice from each of the four treatment groups were
stained and used for analysis.
3.3.3.2 Quantification of area fraction of collagen
Picrosirius Red stained sections were viewed using a polarized microscope equipped with a
circular polarizer and interference filters (Olympus BX51, Cambridge Research &
Instrumentation, Woburn, MA, USA) and images were acquired using Abrio LC-PolScope
processing software (Woburn, MA, USA) at 10X magnification. Three images were taken per slide
by an independent blinded observer. Images were exported as .TIFF files in RGB format and then
imported into ImageJ 1.47 (NIH; https://imagej.nih.gov/ij/). Collagen fibrils appear white under
polarized microscopy, and the collagen density was calculated as the number of collagen fibril
pixels within a defined area of dermis. The dermis was outlined using freehand selection and this
area was calculated in square pixels. The thresholding function was executed with a lower limit of
45 and upper limit of 255. This threshold was first defined using several test slides to determine
the optimal setting for accurate isolation of the collagen fibrils. Once this was defined, the same
threshold was used for analysis of all subsequent slides. The collagen density was calculated as
below.
Area fraction of collagen =
3.3.3.3 Quantification of collagen bundling
Picrosirius Red stained slides were also viewed using polarized microscopy with pseudo-colour
channels applied to assess the density of collagen bundling. With this method, red indicates area
range for live image capture at 99.6 nm. Images were exported as .TIFF files in RGB format and
then imported into Photoshop CC (Adobe, Mountain View, California). Overall collagen bundling
was assessed by analyzing the red to blue color ratio within a defined dermal area. The dermis was
outlined using freehand selection and this area was calculated in square pixels. Red and blue
colored pixels within this area were isolated according to RGB channels and the mean intensity
(out of 255) was calculated for each colour. The total number of red pixels and blue pixels were
counted within the outlined dermal area and then multiplied by the mean intensity of that color to
obtain absolute measurements as below.
Red/blue expression =
3.3.3.4 RT-PCR analysis of Col1a1 and Col3a1 mRNA expression
The mRNA expression of Col1a1 and Col3a1 of five mice from each of the four treatment groups
was assayed by RT-PCR using the primers for Col1a1 and Col3a1 listed in Table 2. Skin biopsy
samples were homogenized on ice in 600 μL of Trizol (Thermo-Fisher, Waltham, MA) in a
microcentrifuge tube using the Ika T8 Ultra Turrax Homogenizer (Ika Works Inc, Wilmington,
NC). Once tissues were adequately homogenized, an additional 400 μL of Trizol was added. RNA
was extracted using the Trizol-chloroform liquid-liquid method136. 200 μL of chloroform was
added to the sample and then vortexed for 10 seconds prior to centrifuging at 4oC for 15 minutes at 12 000 rpm (Sorvall Legend Micro 21R, Thermo Fisher Scientific, Waltham, MA). The top
aqueous layer was then transferred into a new microcentrifuge tube without touching the liquid
interface and the bottom layer was discarded. RNA was precipitated with the addition of 0.5 mL
of pure isopropanol to each sample and then kept on ice for 10 minutes prior to centrifugation at
4oC for 15 minutes at 12 000 rpm. The supernatant was removed and the RNA pellet washed with 1mL of cold 70% ethanol three times with centrifugation at 4oC for 15 minutes at 7500 rpm in between each wash. The 70% ethanol was removed and pellet left to dry in a fume hood for 30
minutes. The RNA pellet was resuspended in 20 μL of UltraPure RNAse-free distilled water
Reverse transcription was performed using the SuperScript VILO cDNA Mastermix
(Thermo-Fischer, Waltham, MA) according to manufacturer’s instructions. Complementary cDNA was
generated from 1 μg RNA per sample. In addition to this amount of RNA, each reaction mixture
contained 4 μL 5x VILO Reaction Mix, 2 μL of 10x Superscript Enzyme Mix, and enough
Ultrapure RNA-ase free distilled water to make a total reaction volume of 20 μL. The reaction
mixture was incubated at room temperature for 10 minutes and then in a 42oC water bath for 60
minutes. The reaction was stopped at 85oC in a heat block for 5 minutes. cDNA was then diluted 1:10 in 180 μL of Ultrapure distilled water and stored at -20oC until further use.
RT-PCR was performed using SsoAdvanced Universal SYBR Green Supermix (Bio-rad,
Hercules, CA). Each reaction consisted of 8 μL of cDNA, 10 μL of SYBR Green Mastermix, and
1 μL each of forward and reverse primer (Table 2) to make a total reaction volume of 20 μL.
Reactions were prepared in a 96-well plate. RT-PCR experiments were performed using the
Stratagene Mx3000P system (Agilent Technologies, Santa Clara, CA) with amplication profile of
10 minutes 95oC, 40 cycles of 30 seconds at 95oC, 1 minute at 60oC, and 1 minute at 72oC. Analysis was performed using 5 mice from each of the four treatment groups and five technical
replicates. Data was analyzed with a non-adaptive baseline starting from cycle two to two cycles
before the earliest amplification observed. Threshold values were defined manually in log view
and placed above the background signal but within the lower third of the linear phase of
amplification plot. The same threshold value was used for each set of experiments. CT values were
exported as a text file into Excel and analyzed using 2-ΔΔCt method 137 with standard propagation
of errors. Data was normalized to Gapdh and compared to control normal saline treated mouse and
expressed as fold change in Col1a1 and Col3a1 expression. The Col1a1:Col3a1 ratio was
calculated as below with standard propagation of errors.
Col1a1:Col3a1 ratio = Avg 2-ΔΔCt Col1a1 / Avg 2-ΔΔCt Col3a1
Table 2. RT-PCR Primers
Gene Forward Primer Reverse Primer
Gapdh AAGGTCATCCCAGAGCTGAA CTGCTTCACCACCTTCTTGA
Col1a1 TGACTGGAAGAGCGGAGAGT ATCCATCGGTCATGCTCTCT
Col3a1 CTGTAACATGGAAACTGGGGAAA CCATAGCTGAACTGAAAACCACC
Tgfb1 CTCCCGTGGCTTCTAGTGC GCCTTAGTTTGGACAGGATCTG
Rhamm CCTTGCTTGCTTCGGCTAAAA AGCAAAGCTCAATGCAGCAG
c-Myc CTGTACCTCGTCCGATTCCAC TTCTTGCTCTTCTTCAGAGTCG
3.4 Effect of Peptide NPI-110 and NPI-106 on Adipogenesis
3.4.1 Effect of peptides on dermal adipose thickness
Masson’s Trichrome stained slides of mouse skin biopsies were viewed using the Aperio
ImageScope Viewer at 10X magnification. Dermal adipose tissue thickness was measured from
the dermal-adipose tissue junction to the adipose-panniculus carnosus junction or the farthest
extent of the adipose tissue when muscle not identifiable. Three representative skin sections from
twelve mice per treatment group were used for analysis. Three random measurements were taken
per section by an independent blinded observer.
3.4.2 Effect of peptides on adiponectin protein expression
4 μm sections from paraffin-embedded mouse skin samples were prepared onto glass slides with
two skin sections per slide. Sections were then deparaffinized with two 15-minute xylene washes
and then rehydrated with a descending alcohol series of 100%, 95%, 70% ethanol, followed by
distilled water and PBS, pH 7.4, washes. Antigen retrieval was performed in 10 mM sodium citrate,
pH 6.4, with an inverter microwave (Panasonic, Kadoma, Osaka) for 3 minutes at maximum
power, 5 minutes at medium power, and 8 minutes at low power. Extra 10 mM sodium citrate
solution was added with ongoing evaporation to ensure tissues were covered at all times.
Endogenous peroxidase activity was then blocked with 3.0% H2O2 diluted in PBS for 10 minutes,
rinses with PBS, and then 3.0% BSA diluted in PBS for 2 hours. A pen with hydrophobic ink was
then used to trace around the two skin sections. Slides were incubated with rabbit polyclonal
anti-adiponectin antibody (ab216502, Abcam) at 1:600 diluted in 1% BSA overnight at 4oC. Each slide contained a negative control of isotype matched non-immune rabbit IgG (DAKO Agilent, Santa
Clara, CA). The following day, slides were washed in PBS prior to incubation with
biotin-conjugated goat anti-rabbit secondary IgG (Vector Labs, Burlington, ON) at 1:500 dilution in PBS
for 2 hours at room temperature. Streptavidin-horseradish peroxidase (ab7403, Abcam) diluted
1:2000 in PBS was then applied to each section and incubated for 30 minutes at room temperature.
Diaminobenzidine (DAKO Liquid DAB Substrate+ Chromogen system, Agilent, Santa Clara, CA)
was applied for 5 minutes to visualize staining and then washed in PBS. Sections were
ethanol), and then cleared with xylene. Slides were mounted with Cytoseal-60 (Thermo Fisher,
Waltham, MA) and a glass slide and left overnight to dry with protection against ambient light.
Immunohistochemical analysis of adiponectin was performed by digitizing the slides using the
Scanscope at 10X magnification and importing .TIFF file images into ImageJ 1.47. Representative
sections from three mice per treatment group were used for analysis, with three high powered field
sections per slide and three separate slides per mouse. In the ImageJ software, free-hand selections
were used to remove the epidermis and hair follicles, which uniformly stained positive for
adiponectin in all treatment groups. The area of the remaining region was calculated. The image
was then deconvoluted with the ‘H-DAB’ setting with conservative thresholds for brown pixels at
165 units and blue pixels at 240 units. The number of positively stained brown pixels per mm2 was then recorded for each section.
3.4.3 Effect of peptides on perilipin mRNA expression
Perilipin mRNA expression in mouse skin biopsy tissues was assayed by RT-PCR as previously
described in section 3.3.3.4 using primers listed in Table 2. Analysis was performed using three
mice from each treatment group and five technical replicates. Data was exported to Excel and
analyzed using 2-ΔΔCt method normalized to Gapdh and compared to control normal saline treated mouse. Data expressed as fold change in Plin mRNA expression.
3.5 Elucidating the Mechanism of NPI-110 and NPI-106 Function
3.5.1 Bioinformatic analysis of expression of 84 fibrosis and 84 adipogenesis-pathway specific
genes
3.5.1.1 RT2 Profiler PCR Mouse Fibrosis Array
The expression of 84 fibrosis pathway-focused genes (Figure 2) was profiled using the 96-well
RT2 Profiler PCR Plate Array (Qiagen, Hilden, Germany). RNA was isolated from mouse skin biopsy tissues as outlined in 3.3.3.4 using the Trizol-chloroform liquid-liquid extraction method.
As a screening array, experiments were performed with one technical replicate from one mouse
RT2 First Strand Kit (Qiagen, Hilden, Germany) according to manufacturer’s instructions. A
mastermix of 1350 μL of RT2 SYBR Green Mastermix, 102 μL of the cDNA synthesis reaction,
and 1248 μL of Ultrapure distilled water was first prepared. 25 μL of this mastermix was added to
each well of RT2 Profiler PCR Mouse Fibrosis Array (PAMM-120Z, Qiagen, Hilden, Germany)
and sealed with optical thin-wall 8-cap strips. PCR was run using the Stratagene Mx3000P system
(Agilent Technologies, Santa Clara, CA). Data was exported to Excel after setting a non-adaptive
baseline and manual thresholding. Data was then analyzed using the SABiosciences PCR array
data analysis software (Qiagen, www.SABiosciences.com/pcrarraydataanalysis.php) using the 2
-ΔΔCt method normalized to Gapdh and compared to the BLM-treated mouse.
3.5.1.2 RT2 Profiler PCR Mouse Adipogenesis Array
To elucidate the mechanism by which NPI-110 and NPI-106 affect adipogenesis, expression of 84
adipogenesis pathway-focused genes (Figure 3) were profiled using the 96-well RT2 Profiler PCR Mouse Adipogenesis Array (PAMM-049A, Qiagen, Hilden, Germany). Experiments were
3.5.1.3 Bioinformatic Analysis
Ingenuity Pathway Analysis Software (Qiagen Bioinformatics, Hilden, Germany) was used to
compare the transcriptional profiles of NPI-110 and NPI-106 treatment with that of
BLM-treatment alone. The core analysis was performed using fold-expression values of each assayed
gene from the RT2 Profiler Fibrosis and Adipogenesis arrays with strict criteria for a fold change > 1.5 for upregulated and down-regulated genes. Causal pathway analysis was performed for
canonical pathways and upstream regulators.
3.5.1.4 Confirmation of Tgfb1 mRNA expression with RT-PCR
IPA upstream regulator analysis indicated Tgfb1 as the top most predicted regulator and these
results were confirmed with RT-PCR analysis using primers for Tgfb1 as listed in Table 2.
Analysis was performed as in 3.3.3.1 using three mice from each treatment group and five technical
replicates. Data was exported to Excel and analyzed using 2-ΔΔCt method normalized to Gapdh and
compared to control normal saline treated mouse. Data expressed as fold change in Tgfb1
expression.
3.5.1.5 TGFβ1 Immunohistochemistry
4 μm sections from paraffin-embedded skin samples were used for immunohistochemistry staining
for total Tgfb1 with antigen retrieval and blocking performed in the same manner as in 3.4.2. Slides
were then incubated with anti-Tgfb1 antibody (ab92486, Abcam) at 1:600 dilution in 1% BSA
overnight, washed in PBS, and then incubated with biotin-conjugated goat anti-rabbit secondary
IgG (Vector Labs, Burlington, ON) 1:500 dilution for 2 hours. Each slide contained a negative
control of isotype matched non-immune rabbit IgG (DAKO Agilent, Santa Clara, CA).
Streptavidin-horseradish peroxidase diluted 1:2000 in PBS was applied to each section for 30
minutes at room temperature. Colorimetric detection was then performed with diaminobenzidine
(DAKO Liquid DAB Substrate+ Chromogen system, Agilent, Santa Clara, CA) applied for 5
minutes. Sections were counterstained with hematoxylin, taken through an ascending ethanol
and a glass slide. Sections were dried overnight with protection against ambient light prior to
analysis.
Analysis of total Tgfb1 staining was performed by digitizing the slides using the Scanscope at 10X
magnification and importing .TIFF file images into ImageJ 1.47. Representative sections from
three mice per treatment group were used for analysis, with three high powered field magnification
sections per slide and three separate slides per mouse. In ImageJ software, free-hand selections
were used to isolate the dermal layer and dermal adipose tissue layer for separate analysis. The
area of the selected area was recorded in mm2. Using the counting function, the number of positively stained cells within the selected area was counted manually and recorded to calculate
the number of positive cells/mm2. This was repeated for the dermal adipose tissue layer.
3.5.1.6 Confirmation of c-Myc mRNA expression with RT-PCR
Myc gene expression was found to be down-regulated with both NPI-110 and NPI-106 peptide
treatment in the fibrosis-specific gene panel. IPA canonical pathway analysis further identified
c-Myc as a potential regulator of NPI-110 and NPI-106 peptide function. This was further confirmed
with RT-PCR analysis using the primers for c-Myc listed in Table 2. Analysis was performed as
in 3.3.3.1 using three mice from each treatment group and five technical replicates. Data was
exported to Excel and analyzed using 2-ΔΔCt method normalized to Gapdh and compared to control normal saline treated mouse. Data expressed as fold change in c-Myc expression.
3.5.1.7 c-Myc Immunohistochemistry
4 μm sections from paraffin-embedded skin samples were used for immunohistochemistry staining
for c-Myc with antigen retrieval and blocking performed in the same manner as in 3.4.2. Slides
were then incubated with recombinant rabbit monoclonal anti-c-Myc antibody (ab32072, Abcam)
at 5 ug/mL dilution in 1% BSA overnight, washed in PBS, and then incubated with
biotin-conjugated goat anti-rabbit secondary IgG (Vector Labs, Burlington, ON) diluted 1:500 for 2
hours. Each slide contained a negative control of isotype matched non-immune rabbit IgG (DAKO
Agilent, Santa Clara, CA). Streptavidin-horseradish peroxidase diluted 1:2000 in PBS was applied
diaminobenzidine (DAKO Liquid DAB Substrate+ Chromogen system, Agilent, Santa Clara, CA)
applied for 5 minutes. Sections were counterstained with hematoxylin, taken through an ascending
ethanol series, cleared with xylene, and then mounted with Cytoseal-60 (Thermo Fisher, Waltham,
MA) and a glass slide. Sections were dried overnight with protection against ambient light prior
to analysis.
Immunohistochemical analysis of c-Myc was performed in the same manner as in 3.4.2 with
analysis of .TIFF file images using ImageJ 1.47 with representative sections from five mice per
treatment group and three high power field sections per slide. Free-hand selections were used to
remove the epidermis and hair follicles and image deconvolution with the ‘H-DAB’ setting was
used to record the number of positively stained brown pixels per mm2.
3.5.2 Effect of peptide on Rhamm mRNA expression
Rhamm mRNA expression was confirmed with RT-PCR analysis using primers for Rhamm as
listed in Table 2. Analysis was performed as in 3.3.3.1 using three mice from each treatment group
and five technical replicates. Data was exported to Excel and analyzed using 2-ΔΔCt method normalized to Gapdh and compared to control normal saline treated mouse. Data expressed as fold
change in Rhamm mRNA expression.
3.6 Statistical Analysis
Data recorded in Excel was imported into SPSS Statistics 25 (IBM, Armonk, NY) and tested for
normality using the Shapiro-Wilk test. Statistical analysis was performed for parametric data using
one-way ANOVA to compare means between all four treatment groups and post-hoc analysis with
Fisher’s least significant difference (LSD) test. Non-parametric data was analyzed using the
Kruskall-Wallis test with post-hoc Mann-Whitney U with Bonferroni correction for repeated
4
Results
The BLM-induced systemic sclerosis mouse model is well-established to recapitulate the early
inflammatory phase of scleroderma, which is associated with increased serum HA in SSc
patients92–94. The effects of the novel Rhamm-binding peptide (NPI-110) and the HA-binding peptide (NPI-106) were tested in a mouse model of BLM-induced systemic sclerosis. C57BL/6J
mice, injected subcutaneously with bleomycin on alternate days, were treated with either NPI-110
or NPI-106 to determine the ability of the peptides attenuate Rhamm-directed signalling of
fibrogenesis and to promote adipogenesis.
There were no differences in mortality between the four treatment groups, and all forty-eight mice
survived until day 28. Weights were recorded daily and BLM-treated mice did not gain weight at
the same rate as compared to control mice. This difference was significant by day 9 and persisted
until day 28. (p < 0.0001) (Figure 4). Neither peptide was able to restore normal weight gain at