Breast Tissue Characterisation
Using Low Angle X-ray Scattering
Ghirmay Kidane
UCL
University College London
Submitted for
The Degree of Doctor of Philosophy
University of London
ProQuest Number: 10014867
All rights reserved
INFORMATION TO ALL USERS
The quality of this reproduction is dependent upon the quality of the copy submitted.
In the unlikely event that the author did not send a complete manuscript and there are missing pages, these will be noted. Also, if material had to be removed,
a note will indicate the deletion.
uest.
ProQuest 10014867
Published by ProQuest LLC(2016). Copyright of the Dissertation is held by the Author.
All rights reserved.
This work is protected against unauthorized copying under Title 17, United States Code. Microform Edition © ProQuest LLC.
ProQuest LLC
789 East Eisenhower Parkway P.O. Box 1346
A BSTR A C T
X
T h is thesis presents the application o f a L o w -a n g le x-ray scattering system based on an en e rg y dispersive technique to the characterisation o f breast tissues. L o w angle scatter ofx -rays at diagnostic energies is p re d o m in a n tly coherent. T his c o h e re n c e gives rise to
interference effects resulting in x-ray diffraction patterns that are characteristic o f the
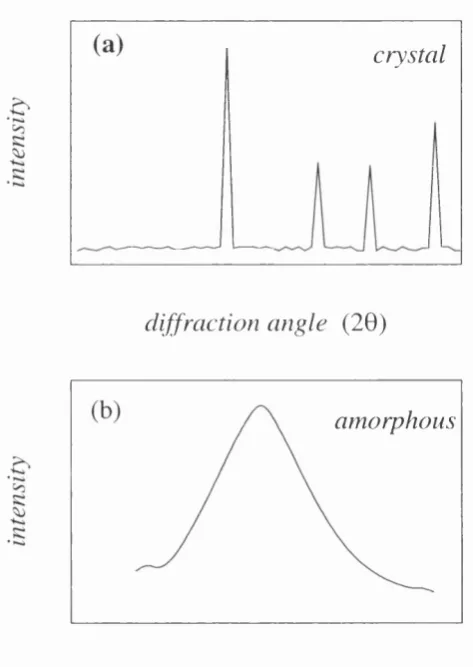
scattering m aterial. T h e shapes o f scattering distributions for low a tom ic n u m b e r m edia
such as breast tissues ex hibit one or m o re intense pea ks c lo se to the transm ission
direction. T h e position and the shapes o f the peaks d ep e n d up o n the interatom ic and
in te rm o le c u la r c o n figurations o f the soft tissues.
T h e m e a su re m e n ts o f the scattering properties o f breast tissues, so m e anim al tissues, and
tissue substitute m aterials have been ca rried out using an en e rg y dispersive x-ray
diffraction system o v er the m o m e n tu m tran sfer range o f 0.70 to 3.50 nm'V O ne hundred
an d tw enty one sam ples o f ex c ise d fem ale breast tissues, eight anim al tissues, and test
o bjects such as perspex, polyethylene and w a te r have been used. R esults from the
diffraction system have been c o m p a re d with those from histological analysis for all h u m a n tissues. It has been found that tissue types can be ch a ra c te rise d on the basis o f
sh ap e o f the scatter spectrum and on its relative intensity. T h e shape s are significantly different betw een tissue types in the range from 1.0 p er nm to 1.8 per nm*'. This
su g g ested that differences in the distribution o f coh e ren tly sca tte red ph o to n s in breast tissues w o u ld allow better d isc rim inating signals in breast im a g in g if particular values o f
m o m e n tu m transfer are m onitored.
A n ew tech n iq u e is desc rib ed which p ro d u c es im ages b ase d on selective m o m e n tu m
transfer region. T h e system uses a m a m m o g ra p h ie x-ray tube to ac q u ire diffraction data at
scatter angle o f ~9^. Im ages are re co n stru cted from the diffraction data, which represent
the co h e ren t-sc atter intensity in the m o m e n tu m transfer space a ro u n d 1.1 nm '. At this
m o m e n tu m transfer value the co h e ren t-sc atter intensity ratio o f d is e a s e d tissue to healthy
tissue w as m inim ised. T his system perm its the x-ray diffraction properties o f small
inclusions e m b e d d e d in large tissue sizes to be m e a su re d in -vitro . In this study im ages
o b tain ed by transm ission m eth o d s and by co herent scattering te c h n iq u e have been
re co rd e d for several inclusions in blocks of h u m a n breast tissues a n d anim al tissues. S m a lle r inclusions that are less distin g u ish ab le with tran sm issio n im ages have been
Contents
1. B
r e a s t
a n a t o m y
,
p a t h o l o g y
a n d
IMAGING TECHNIQUES... 15
1.0 INTRO D U CTIO N ... 15
1.1 THE B R E A ST ...16
1.1.1 Breasta n a t o m y...16
1.2 MOLECULAR COMPOSITION OF HUMAN CELLS...18
1.2.1 Distinctionbetweenhealthyand Cancerc e l l s...19
1.3 CLASSIFICATION OF BREAST TISSU E... 20
1.3.1 Connectivetissue... 20
1.3.1.1 Fibrous Tissue ... 21
1.3.1.2 Adipose T issu e ... 22
1.3.1.3 Blood ...22
1.4 CANCEROUS TISSUE... 23
1.4.1 Epidem iology...23
1.4.2 Pathologyof Cancerous Tissu e...23
1.4.2.1 In-situ carcinoma ... 24
1.4.2.2 Infiltrating carcinoma ... 25
1.4.3 Benignt issu e...26
1.5 TECHNIQUES OF BREAST IM A G IN G ...27
1.5.0 Introduction... 27
1.5.1 X-RAY MAMMOGRAPHY...28
1.5.2 X-RAY IMAGING SYSTEM CONSTRAINTS...31
1.5.3 Reductionofx-rayscatter...32
1.5.4 Imagereceptors... 33
1.5.4.1 Film-screen systems ...33
1.5.4.2 Digital radiography ...34
1.5.5 Radiation DOSE...35
1.6 OTHER TECHNIQUES OF BREAST IM A G IN G... 36
1.6.1 Ultra sonography... 37
1.6.1.1 B-mode scanning ... 37
1.6.1.2 Doppler sonography ...38
1.6.2 MR Breast Im a g in g... 38
1.6.3 Positron Emission Tomography (PET)... 39
1.6.4 Single Photon Im a g in g... 39
1.6.5 Co n c lu sio n s... 40
1.7 NECESSITY TO IMPROVE IMAGE C O N TR A ST... 40
1.8 X-RAY SCA TTER ...41
1.8.1 Coherentx-ray scatter... 42
2. LOW ANGLE X-RAY SCATTERING... 47
2.1 BASICS OF PHOTON-MATTER IN TERA CTIO N ...47
2.1.1 Attenuation...47
2.2.2 X-RAY SCATTERING... 49
2.2.2.1 Coherent scatter ...50
2.2.2.2 Bragg diffraction ...51
2.2.2.3 Atomic form factor ... 52
2.2.2.4 Condensed material ... 53
2.2.2.5 Incoherent scatter ...55
2.3 ENERGY DISPERSIVE X-RAY D IFFR A C TIO N ... 56
2.3.1 Rangeofscatterangles... 56
2.4 LOW ANGLE X-RAY SCATTERING SY S T E M ... 57
2.4.1 Descriptionofexperimentalset-u p... 57
2.4.2 Photoncollection...60
2.4.3 System Alignm ent... 61
2.4.3.1 Slit Response ... 62
2.4.3.2. Scatter angle selection ...64
2.4.3.3 Angular distribution of coherent scatter from soft tissue ...66
2.4.3.4 Consistency of the scatter angle ...67
2.5 GEOMETRICAL CONSIDERATION OF THE COLLIMATION SYSTEM ... 68
2.5.1 Optimumdimensionofcollimationa perture...68
2.5.2 Spreadoftheprimaryb e a m... 69
2.6 STABILITY OF X-RAY O U TPU T... 70
2.7 SCATTER MEASUREMENTS OF AMORPHOUS M ATERIALS...73
2.8 DETERMINATION OF THE MOLECULAR DIFFERENTIAL C RO SS-SEC TIO N ...75
2.8.1 Diffractometer CORRECTION PROCEDURE...76
2.8.1.1 The shape of the incident spectrum ... 76
2.8.1.2 Effect of Attenuation ... 80
2.8.1.3 Multiple scatter ... 82
2.8.1.4 Background subtraction ... 84
2.9 L in e a r DIFFERENTIAL SCATTERING COEFFICIENT {y[ster~^cnf^i)...85
2.10 QUANTITATIVE ANALYSIS OF AMORPHOUS M ATERIALS...88
2.10.1 Peakpositionsoftwocomponentsoftt issu e s...89
2.11 MOMENTUM RESO LU TIO N ...90
2.11.1 Angular Bl u r r in g...90
2.11.2 Energyresolution...91
2.12 SPECTRAL SELECTIVE MOMENTUM TRANSFER IM AGING... 92
c?
3. L
i n e a r
d i f f e r e n t i a l
s c a t t e r i n
<?
COEFFICIENTS OF BREAST TISSUE... 95
3.1 INTRODUCTION... 95
3.2 BREAST TISSUE SAM PLES... 96
3.2.1 TISSUE CLASSIFICATION...96
3.2.2 Ti s s u e s t o r a g e... 99
3 . 2 .3 Ti s s u e h a n d l i n g a n d p r o c e s s i n g... lO I 3.2.4 Ef f e c to f f r e e z i n g a n d s t o r a g e...102
3.2.5 Hi s t o l o g i c a la n a l y s i s p r o c e d u r e... 103
3.3 SCATTER SIGNATURE M EASUREM ENT... 104
3.3.1 Pr o c e d u r e...104
3.3.1.1 Systematic parameters... 104
3.3.1.2 Rotation of sample...106
3.4 TISSUE CHARACTERISATION...107
3 .4 .1 De t e r m i n a t i o n o f M M -f o r m f a c t o r s...1 0 7 3.4.2 Ca l c u l a t i o n o ft h e s c a l i n g f a c t o r... 108
3 . 4 .3 Co m p a r i s o n o f m o l e c u l a rl i n e a rd i f f e r e n t i a l s c a t t e r i n g COEFFICIENT ( / ) FOR VARIOUS BREAST TISSUE CLASSIHCATION... I l l 3.4.3.1 Adipose Tissue...114
3.4.3.2 Fibroglandular and average breast tissue ... 114
3.4.3.3Carcinoma ... 115
3.4.3.4 Fibroadenoma ...115
3.4.3.5 Benign tissue ...116
3.4.4 Mo l e c u l a r Fo r m Fa c t o r... IIS 3.4.5 Pe a k h e i g h t a n a l y s i s o fs c a t t e r s i g n a t u r e s...122
3.5 EFFECTS OF INCLUSIONS...126
3.6 TISSUE SIM ULATION...127
3.6.1 Re c o n s t r u c t i o n o f s i g n a t u r e sf o r m u l t i-c o m p o n e n t t i s s u e... 128
3.6.2 Di s t i n c t i o nb e t w e e n c a r c i n o m a a n d n o r m a l t i s s u e... 131
3.7 ASSESSMENT OF FAT CONTENT OF BREA ST...132
3.7.1 C a l i b r a t i o n CURVE... 133
3.7.1.1 Preparation of the sample for calibration curve... 134
4. A
p p l i c a t i o n
o f
c o h e r e n t
s c a t t e r
IN TISSUE IMAGING... 141
4.0 INTRODUCTION...141
4.1 THE DESIGN AND CONSTRUCTION OF A SPECTRAL SELECTIVE MOMENTUM TRANSFER IMAGING (SSMTl) SY S T E M ... 142
4.1.1 Selectionofmomentumtransferspace... 143
4.1.2 Matching Momentum Transferfeaturestothe MAMMOGRAPHIC X -R A Y SPECTRA...144
4.2 THE SSMTI IMAGING DEV ICE...147
4.2 1 SSMTl EXPERIMENTAL SET-UP... 147
4.2.2 System Alignm ent... 149
4.3 COMPONENTS OF THE SYSTEM ... 152
4.3.1 Detectors... 152
4.3.2 Collimators... 153
4.3.2.1 Scattering volume...155
4.3.3 Scanning...158
4.4 MOMENTUM RESOLUTION OF SSMTl SYSTEM ...158
4.4.1 Angular Blurring... 159
4.4.2 Energyresolution... 160
4.5. X-RAY OUT PUT FLUCTUATION... 161
4.6 DETECTOR INSTABILITY...162
4.7 BACKGROUND SUBTRACTION... 163
4.8 SIMULATION OF SCATTER SIGNATURES... 164
4.9 ENERGY-ANGLE DIAGRAM ...166
4.10 IN-VITRO IM AGING...168
4.10.1 Constructionofblocksoftissuesforim aging...168
4.11 DIFFRACTION AND TRANSMISSION IM A G ES...172
4.12 SIGNAL-TO-NOISE RA TIO ... 176
4.13 D O SE... 178
4.14 EFFECT OF ATTENUATION...179
4.15 SENSITIVITY OF SCATTERING VOLUM E... 181
5. C o n c l u s i o n a n d f u r t h e r w o r k ...i84
5.1 L A B O R A T O R Y B A S E D D IF F R A C T IO N M E A S U R E M E N T S ... 184
5. 1. 1 Sa m p l e p r e p a r a t i o n...184
5.1.2 Sc a t t e r m e a s u r e m e n t s... 184
5.1.3 P e a k HEIGHT...187
5.2 A P P L IC A T IO N O F L A B O R A T O R Y B A S E D D IF F R A C T IO N ... M E A S U R E M E N T S ...187
5 .2 .1 Sp e c t r a l Se l e c t iv e m o m e n t u m t r a n s e e r i m a g i n g... 187
5.3 C L IN IC A L A P P L IC A T IO N O F T H E S SM T I - F U T U R E W O R K ... 189
5.3.1 Re a s o n s fo rc o n s id e r in g S SM TI int h ec l in ic a lc o n t e x t... 189
5.3.1 FUTURE W O R K... 191
5 .3 .L I S o u rc e ... 191
5 .3 .1.2 C o llim atio n ...191
5.3.1.3 D e te cto rs... 192
5.3.2 Pr o p o s a l s f o r an e w SSM TI s y s t e m...193
A P P E N D I X ... ^ .. ? . . ' . .'.7%Zr... 19 4 ^ 1 Ti s s u e s a n d c e l l s ...19 4 E R R O R ! B O 0 K M A R K N O T D E F I N E D . 2. X-RAY SCATTERING AND BRAGG'S LA W... 197
3. Sc a t t e r in g v o l u m eo ft h eS S M T I ... 203
REFERENCE... 207
A
FIGURES
Figure 1.1
Diagram illustrating anatomy of breast17
Figure 1.2
Cut surface of a biopsy specimen containing an infiltratingcarcinoma 24
Figure 1.3
Cut surface of a biopsy specimen containing a typicalfibroadenoma 26
Figure 1.4
X-ray diffraction patterns from a crystalline and amorphousmaterial
43
Figure 2.1
The interaction cross section for water.48
Figure 2.2
The comparison of the independent free atom, free moleculeand the diffraction data of water 54
Figure 2.3
Experimental set-up of the energy dispersive difractometer,photographic image and schematic representation. 58
Figure 2.4
The collimation system, photographic image and schematicRepresentation
59
Figure 2.5
The focal spot images through the pinhole at two differentdistances to test system alignment
61
Figure 2.6
The schematic illustration of the collimation movement toalign the collimation system
62
Figure 2.7
The performance of the slit across the primary beam andangular position 63
Figure 2.8
The low angle x-ray scatter signatures of adipose tissue atdifferent scatter angle. 65
Figure 2.9
The angular distribution of the coherent scatter of adiposeand fibrous tissue
66
Figure 2.10
Comparison between the theoretical and the experimentaldiffraction curves of CaCOs
67
Figure 2.11
Schematic illustration of the spread of the primary beam69
Figure 2.12
The x-ray out put using ionisation chamber at differentFigure
2.13 Integrated peak counts of polyethylene diffraction curve atdifferent measurement time
72
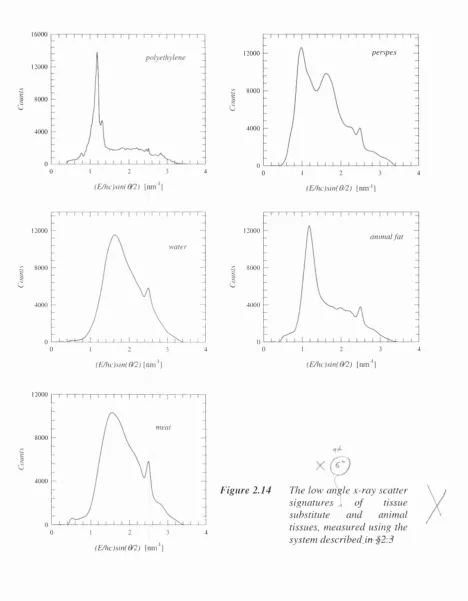
Figure 2.14
The low angle x-ray scatter signatures of tissue substituteand animal tissues measured using the diffractometer 74
Figure 2.15
The typical spectra of an incident photon and scattered signaturesof adipose and carcinoma tissues 77
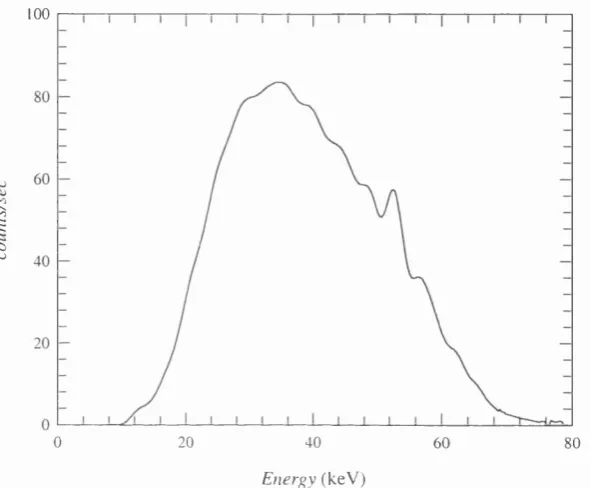
Figure 2.16
The schematic set up of the system used to obtain the incidentspectrum
78
Figure 2.17
The measured scattered spectra from the industrial x-ray tube79
Figure 2.18
The spectral correction factor for different energy values80
Figure 2.19
The relative scatter contribution to the scattering of photonsincident on water slab 83
Figure
2.20 The typical measured background from the EDXRD 85Figure
2.21 The measured and theoretical linear differential scattering coefficient of adipose tissue (a) after normalisation appliedand (b) compared with the results of others 87
Figure
2.22 Scatter signature of tissues in their pure form and in mixed form 89Figure
2.23 The schematic diagram of a slit height effect on theEDXRD technique 91
Figure 2.24
The momentum spread for(a) polyenergetic x-ray spectra and(b) different object detector distance
92
Figure 2.25
The typical scatter signatures of two different materials plottedon the same momentum transfer axis.
93
Figure 3.1
Distribution of the samples used in the investigation of breasttissue characterisation with the age of the patients.
97
Figure 3.2
Healthy and diseased breast divisions.98
Figure 3.3
Scatter signature of Infiltrating ductal carcinoma and ductalcarcinoma in situ 99
Figure 3.4
Scatter signature of a fresh and dry tissue samples storedat room temperature 100
Figure 3.5
Demonstration that the tissue storage process had no onFigure 3.6
The histological procedure of the technique used to analysethe tissues.
103
Figure 3.7
Normal breast and carcinoma seen under a low-powerscanning lens. 104
Figure 3.8
Typical scatter signatures taken for adipose tissue, fibroglandulartissue, carcinoma and benign tissue. 105
Figure 3.9
The signature of normal breast tissue produced when the samplewas irradiated at different positions.
106
Figure 3.10
Comparison of the linear differential scattering coefficientbetween the measured and calculated for breast tissue and
tissue substitute materials 110
Figure 3.11
Measured linear differential scattering coefficient of differenttypes of breast tissues
113
Figure 3.12
Molecular form factor measured for (a) Perspex and healthybreast tissues and (b) compared with Peplow and Verghese (1998)
121
Figure 3.13
The measured signature of filled, under filled breast tissue samples124
Figure 3.14
The correlation between the peak height and the histologicalestimation of the concentration for adipose tissue and
fibroglandular tissue
125
Figure 3.15.
Demonstration of the effect of the inclusion of anothertissue type within the scattering volume
127
Figure 3.16
Demonstration of the reconstructed and measured lineardifferential scattering coefficient of healthy breast tissue
130
Figure 3.17
Comparison of the scatter signatures for the calculated‘pure’ carcinoma sample with that of both normal
breast tissue and a fibroglandular tissue.
132
Figure 3.18
Diffraction signatures of fat lump lean meat and a samplemade from a mixture of 40% fat and 60% lamb lean meat 139
Figure
3.19 The fat tissue calibration curve 135Figure
3.20 Comparison between the EDXRD analysis and pathologicallyassessed contents of fat in the healthy breast samples
136
Figure 4.1
The peak position difference linear differential scatteringFigure 4.3
The experimental set-up of (a) schematic illustration and(b) photographic images of the “SSMTI” system
149
Figure 4.4
Geometry of the alignment for a standard mammography andthe SSMTI system
150
Figure 4.5
Images of the focal spot through circular aperture collimators151
Figure 4.6
Vertical and horizontal profile plots through the imageof figure 4.5.
152
Figure 4.7
The schematic representation of the collimation system154
Figure 4.8
The schematic representation of the scattering volume155
Figure 4.9
The coherent scatter signature of healthy breast tissue atthe scatter angle of -9.3^ and molybdenum spectrum
and different collimation dimension
157
Figure 4.10
Geometrical representation of angular blurring from finitedimensions of the annular collimation.
159
Figure 4.11
The x-ray output for several exposure times measured usingthe ion chamber
161
Figure 4.12
Demonstration of detector instability for repeatedmeasurements on a block of lard.
162
Figure 4.13
The typical measured background from the SSMTI system163
Figure 4.14
Scatter signatures of healthy and cancerous tissues measuredusing the tungsten target x-ray tube.
164
Figure 4.15
The computed and measured scatter signatures of healthy andDiseased breast tissues from Mo incident spectra at the scatter
angle of 9.3*^
165
Figure 4.16
A 2-D surface plot and 3-D curve of the contrast of the healthyand cancerous breast tissues at different scatter angle and energy
167
Figure 4.17
The profile through the Energy-Angle diagram of figure 4.13.168
Figure 4.18
Schematic representation and x-ray film images of meat forthe fat and mixed tissue matrices respectively
170
Figure 4.19
The diagram of the cancerous tissue inclusions in healthybreast tissue.
171
Figure 4.20
The scatter and transmission images of meat inclusions inanimal fat matrix.
172
Figure 4.22
The scatter and transmission images of the lamb lean meatinclusions in the mixed tissue matrix
173
Figure 4.23
The profile through the scatter and transmission images offigure 4.23.
174
Figure 4.24
Scatter and transmission images of the cancerous tissueinclusions in breast tissue.
175
Figure 4.25
Profiles through the images of figure 4.25176
Figure 4.26
The total linear attenuation coefficient of different breast tissues179
Figure 4.27
SNR of an image of a lamb lean meat inclusion in lard whenthe primary beam is attenuated by different thickness of
tissue substitute material.
180
Figure 4.28
Schematic representation and a 2D scatter images of themeat inclusion (wedge shaped) in the fat matrix
181
Figure 4.29
The profile through the image of figure 4.28182
Figure 5.1
The concentration of fat level in breast tissue.189
Figure 5.2
Schematic representation of the system that could be used todetected the relatively low intense scatter photons
192
Figure 5.3
Schematic illustration of SSMTI for clinical application193
Figure A l.l
M olecular arrangements of proteins195
Figure A2.1
Diagrammatic illustration of the coherent scattering ofx-rays by a single electron 199
Figure
A2.2 Diffraction of x-rays by a crystal. AA and BB wave fronts 201Figure
A3.1 The schematic illustration of the scattering volume 203Figure
A3.2 (a) the scattering volume and (b) an extrapolated representationTABLES
Table 1.1
The relative amount molecular composition in cells18
Table 1.2
Breast tissue components and their function21
Table 1.3
The classification of healthy and diseased breast tissues27
Table 1.4
The characteristics of different breast imaging techniques28
Table 1.5
The quality criteria for x-ray mammography30
Table 1.6
System dose of different image receptors34
Table 2.1
The range of scatter angles for n-fatty acids and water57
Table 3.1
Chemical and physical properties of the scattering samples109
Table 3.2
M olecular linear differential scattering coefficient fordifferent breast tissues
117
Table 3.3
The average relative error in the absolute molecularlinear differential scattering coefficients
118
Table 3.4
M olecular form factors of breast tissue. Averagebreast tissue represents 50% fat and 50% fibroglandular
119
Table 3.5
The average relative error in the calculated molecularform factors of the breast tissues 122
Table
3.6 List of 121 breast tissue samples classified histologicallyand related to the measured peak positions and peak heights
123
Table 3.7
The scatter and attenuation relationship between lamb leanmeat and fibrous tissue and breast fat and animal fat
134
Table 4.1
The contrast between the linear differential scattering coefficientof healthy tissues and cancerous tissue at
x
values of1.1
nm'^ and1.6 nm'^
147
Table 4.2
The calculated scattering volumes for different primaryand scattering beam apertures
156
Table 4.3
The angular uncertainty for a range of collimation lengths160
Table 4.4
The measured contrast and SNR for different size inclusionAcknowledgement
I would like to thank my supervisor Professors R D Speller and Dr. G J Royle for their
support and invaluable guidance throughout the project.
My big thanks go to Dr. Dmitra Daramabara for her helpful advice and support. I am also
grateful to Professor A. Hanby for his help in providing me with breast tissue samples and
for his guidance in the pathological analysis of the tissues and to Dr Angelo Taibi for his
useful discussion. Many thanks to Giulia Scannavini, Antonio Soares and all other
colleagues in the radiation physics group.
I am extremely grateful to thank my cousin Mr. Tekeste Sebhatu for his support
throughout this PhD work. Special thanks must also be given to Hadas Andemeskel for
her constant encouragement. I must also acknowledge my gratitude to my cousin
Yohannes Tseggay.
-
1
-Breast anatomy, pathology and
imaging techniques
1.0 Introduction
Breast cancer is a m ajor problem for women in the western world. It also occurs in
men, but the incidence is about one hundredth that of women. Incidence rates have
been increasing in many countries and it was anticipated that nearly one million cases
might be diagnosed in the world in the year 2000 (Day and Miller, 1988). Amongst the
women the risk of breast cancer rises rapidly from about the age of 30 to the age of 50,
thereafter, in low-incidence countries (e.g. Japan) there is no increasing risk with
increasing age. However in high incidence countries (e.g. USA and Western Europe)
there is moderate rise in incidence with increasing age for the rest of the life span.
Efforts to improve the current diagnostic techniques are underway. The most common
diagnostic technique, after clinical examination, is x-ray mammography. Within the
screening techniques, mammography is neither 100% sensitive nor 100% specific for
the early detection of malignant tumours; some false negative and false positive
diagnosis occurs leading to missed cancers and inappropriate biopsies. Thus, a new
method for increasing the diagnostic information content of mammographie images is
sought. One method would be to use the scattering properties of the different types of
breast tissue to enhance the visibility of the disease. X-rays are always scattered during
mammographie examinations. These scattered x-rays degrade the image quality of
transmission images, and thus, several efforts have been made to remove scattered
photons from reaching the detector (e.g. introduction of grids or slits between the
patient and the image receptor). This thesis considers the use of scattered photon
information to improve sensitivity and specificity of mammography.
This chapter describes the general overview of the thesis including the survey of
literature in the field of low angle x-ray scattering. Classification of healthy and non-
healthy breast tissues, anatomy of the breast and the current techniques of breast
imaging have been reviewed. Advantages, disadvantages and problems associated with
x-ray mammography are treated in more detail. The use of coherently scattered photons
to characterise breast tissue has also been included.
1.1 The breast
1.1.1 Breast anatomy
The fully developed female breast is a well-differentiated apocrine sweat gland that
originates in the ectoderm and secrejf milk during lactation. Each breast of a female
extends from the sternum to the mid-axillary line, and lies anterior to the pectorial
muscles. A thin outer dermal layer covers a subdermal layer of adipose tissue that
varies in thickness from several mm to one cm. Cooper’s ligaments are scalloped
interlobular and intralobular strings of fibrous connective tissue extending from the
pectorial fascia to the skin to support the glandular tissue. Cooper’s ligaments also
support the ducts, blood vessels, lymph channels, and varying quantities of adipose
Lactiferoiis diict
AmpiiUa
Areob
Adipose tissue
Pectoralis major
? ^ Glandular tissue
^ ITormective tissue, stram a
Nipple v/ith opening o f lactiferous duct
Figure 1.1 Diagram illustrating anatomy o f breast
Each breast is c o m p o s e d o f 15 to 20 lobes o f g la n d u la r tissue. T h e lobes are p a d d e d and
sepa rated from each oth er by fibrous c o n n e c tiv e tissue and fat. T h e in terlobular co n n e ctiv e tissue fo rm s su sp en so ry ligam ents, w h ic h attach the breast to the und erly in g
m uscle fascia an d to the overly in g deiTnis. As s u g g e ste d by their nam e, the su sp en so ry
ligam ents pro v id e natural support for the breasts, like a built-in brassiere. W ith in the
lobes there are sm a lle r units called lobules. T h e d ucts from the various lobules unite,
fo rm in g a single lactiferous (m ilk ca rrying) d uct for each lobe, in o ther w ords, the
secretory cells are a ira n g e d in little grape like clusters called g lan d u lar alveoli. T h e
main ducts c o n v e rg e to w ard s the nipple, like the sp o k e s o f a wheel. T h u s, there are 15
to 20 tiny o p e n in g s on the surface o f ea ch nipple. T h e lobules, to g e th e r with its
term inal duct are called the term inal duct lo b u lar unit (T D L U ).
T h e a m o u n t o f adip o se tissue around the lobes o f the glan d u lar tissue d eterm in e s the size o f the breasts an d accounts for th eir soft c onsistency. T h e nipple consists o f
certain other stimuli. In the pinkish areola surrounding the nipple, several rudimentary
milk glands (the areolar glands) may be found. By the time a woman has completed
puberty, her glandular tissue usually has developed to its maximum size. Hormonal
variations related to menstrual cycles, pregnancy, and lactation cause the size of her
glandular tissue to wax and wane. The gradual recession of glandular tissue after
menopause usually makes the breast become moderately flattened, pendulous and less
firm. Although hormonal factors make a w om an’s glandular tissue denser, her genetic
predisposition and the proportion of the total adipose tissue to her total body weight
also influence the ratio of glandular tissue to adipose tissue in her breast. For this
reason it is still normal for some young w om an’s breast to consist primarily of adipose
tissue and some elderly wom an’s breast to consist of exceedingly dense tissue. A
woman’s fibrous tissue extends throughout the entire breast; only a thin layer of
retromamary adipose tissue separates it from the pectorial muscle.
1.2 Molecular composition of human cells
Cells are composed of water, inorganic ions, and organic molecules. W ater is the
dominant mass of the cell, accounting for 70% or more of total cell mass. In most cells,
over 90% of the total mass (excluding water) is represented by very large molecules
called macromolecules. Four major classes o f macromolecules may be identified; such
as: proteins, polysaccharides, lipids and nucleic acids. Of all the macromolecules found
in cells, the proteins are the most chemically and physically diverse. The summary of
these components of cells is given in Appendix I. Table 1.1 shows the relative amount
of cellular composition.
Substance
Percentage of total cell weight (%)
Water 6 5 - 8 5
Protein 1 0 - 2 5
Polysaccharide 1 - 5
Lipid 2 - 1 0
Nucleic acid 0 . 5 - 5
\ 1.2.1 Distinction between healthy and Cancer cells
C an ce r cells ty pically d isplay abn o rm a lities in the m e c h a n ism that re gulate n o rm a l cell
proliferation, differentiation and survival.
A p rim a ry d istinc tion b etw e en c a n c e r cells an d no rm al cells in culture is that norm al
cells d isp lay d e n sity -d e p e n d e n t inhibition o f cell proliferation. N o rm a l cells proliferate
until they reach a finite cell density, w h ich is d e te rm in e d in part by the av a ilability o f
grow th fa cto r a d d e d to the culture m ed iu m . T h e y then cease p roliferating a n d b e c o m e
quiescent. T h e proliferation o f m ost c a n c e r cells how ever, is n ot sensitive to density-
d e p e n d e n t inhibition. M a n y ca n cer cells have re d u c e d re q u irem en ts for ex tra cellu lar
grow th fa cto r b ec a u se o f the lack o f p o ly p e p tid e (w hich controls cell proliferation).
C a n c e r cells are also m ore stringently re g u la ted than norm al cells by cell-cell a n d cell-
matrix interaction. C a n c e r cells are less adh e siv e than norm al cells b e c a u se o f the
reduced ex p re ssio n s o f cell surface ad h e sio n m olecules. C o n seq u en tly , c a n c e r cells are c o m p a ra tiv e ly un re strain ed by interactions with oth er cells and tissue c o m p o n e n ts ,
contrib u tin g to the ability o f m alignant cells to invade and m etastasise. T h e re d u c e d
adhe sive ness o f c a n c e r cells also results in m orp h o lo g ical and c ytoskele ta l alterations.
M any tu m o u r cells are ro u n d e r than norm al with large r nuclei, in part b e c a u se they are
less firm ly attac h ed to e ither the e x tra cellular m atrix o r neig h b o u rin g cells (B o y n to n et al 1982).
M a lignant c e l^ g e n e r a l ly s e c r e ^ p r o te a s e that digests extracellular m atrix c o m p o n e n t,
allow ing c a n c e r cells to invade adjacent n o rm al tissue. E.g. the secretion o f co lla g e n a se
appears to be an im p o rtan t d eterm in a n t o f the ability o f ca rc in o m a s to d igest and
1.3 Classification of breast tissue
The elemental and the molecular compositions of breast tissue are the most important
entities in this research project to study the low angle x-ray scattering properties of the
soft tissues. Therefore, for simplicity in this thesis, female breast is classified into two
broad divisions according to their function and composition. They are the mammary
gland and the connective tissues. The mammary epithelium forms only a minor
component of the total breast tissue mass, but it is the site for most cancerous cells.
Mammary gland and its function has been described in §1.1. The connective tissue and
its components are listed and explained in the next sections.
1.3.1 Connective tissue
Connective tissue is one of the most widespread tissues in the breast, found in or
around the mammary gland of the breast. It exists in different forms e.g. as delicate
tissue-paper webs, tough resilient cords, rigid bones, or fluid. The connective tissues
connect, support, transport, defend and form the supporting framework for the whole
breast and for the mammary gland components (e.g. blood).
The breast connective tissue is composed of three components namely, (a) ground
substance, (b) fibres and (c) cells. The ground substance and fibres make up the extra
cellular matrix of the connective tissue. The properties of the cells and the composition
and arrangement of the extra-cellular matrix elements vary tremendously, giving rise to
an amazing diversity of connective tissue, each uniquely adopted to perform its specific
function in the breast. For example the matrix can be delicate and fragile to form a soft
'packing' around the mammary gland, or it can form 'ropes' (tendons and ligaments) of
incredible strength.
Ground substance is an amorphous material (living fabric) that fills the space between
the cells and contains the fibres. It is composed of:-(a) Interstitial fluid; (b) Cell
adhesion proteins (serves as glue that allows connective tissue cells to attach
fluid and functions as a molecular ’sieve’ or medium, through which nutrients and other
dissolved substances can diffuse between the blood capillaries and the cells.
The fibres of connective tissue provide support. Three types of fibres are found in
connective tissue matrix such as collagen which provide strength to the matrix, elastic
which allows the tissue to stretch and recoil like a rubber band, and reticular fibres
which form a delicate network that surround small blood vessels and support the soft
tissue of organs.
Major breast component
Tissue type
Location Function
1. Epithelial tissue Glandular Gland Secretion 2. Connective tissue
Fibrous 1. L oose Betw een glands (lobule), superficial fascia 2. D ense Ligaments, Dermis
B lood B lood vessels Transportation, protection A dipose Under skin, padding at Insulation, support and
various points o f breast reserve food
M uscle Smooth N ipple Erection o f nipples
Table 1.2 Breast tissue components and their function
The connective tissues in the breast can be divided into different categories or types
according to the structural characteristics of the intercellular material. The classification
scheme is listed in table 1.2. Fibrous tissues (areolar, adipose, reticular, and dense)
have extra-cellular fibres as their predominant feature. The cells of the various
connective tissues are specialised to produce the extracellular matrix. The cell names
end with suffixes according to the cell function such as blasts (e.g. fibroblast) o i ^ y ^
(e.g. adipocytes).
1.3.1.1 Fibrous Tissue
The fibrous connective tissue of the breast can be broken down into components such
as loose and dense (see table 1.2) according to their function and composition.
Loose connective tissue:- It is loose, common and ordinary. It is loose because it is
tissues in the breast. The matrix of loose (also called areolar) tissue is a soft, viscous
gel mainly because it contains a semifluid or gelatinous ground substance formed
primarily of hyaluronic acid in which all three fibre types are loosely dispersed. The
loose nature of the tissue provides a reservoir of water and salts for surrounding body
tissue.
Dense regular connective tissue:- They have fibres as their predominant element. For
this reason the dense connective tissue is often referred to as dense fibrous connective
tissue. W ith its enormous tensile strength, dense regular connective tissue forms the
ligaments that bind. Some of the connective tissue is irregular. These bundles of
collagen fibres are much thicker and they are interwoven and arranged irregularly,
forming sheets in body areas, where tension is exerted from many different directions.
It is found in the breast skin as the dermis.
1.3.1.2 Adipose Tissue
Adipose tissue is basically a connective tissue, but it differs from other connective
tissues because it contains predominantly fat cells and many fewer fibroblasts,
macrophages, and mast cells. Compared to other connective tissue types, adipose tissue
is very cellular. The adipose cells, which account for about 90% of the tissue mass, are
packed closely together. They form supporting, protective pads around the gland. The
relative amount of fat in the breast increases with age. The molecular structure of fatty
acids are given in Appendix I.
1.3.1.3 Blood
Blood is unique among breast connective tissue because the matrix between the blood
cells is fluid and it is characterised by the lack of fibres in its matrix. This fluid matrix
of blood is called plasma. The red blood cells are unique in their mature form because
they do not contain nuclei. It appear as biconcave discs that have a diameter of 7-8p,m.
Each red blood cell contains about 280 million hemoglobin. The less numerous white
blood cells, active in defence system, are amorphous cells and are capable of oozing
1.4 Cancerous tissue
Epidemiology
t cancer is the most frequent cancer in women in the western world. The
mce rates are continuously increasing in many parts of the world, and in the
trial world the rate is close to about one in 12 women. It is a major cause of death
ddle-aged women of 33 - 55 years (Parkin et al 1988), where there has been an
ase in the mortality rate in the last two decades. Rates of incidence and mortality
breast cancer are about five times higher in North America and northern Europe
in Africa, Asia, and Japan. In Japanese immigrants to the USA the risk of
oping breast cancer is doubled (Stanley et al 1988), suggesting environmental as
as genetic factors in the aetiology of breast cancer. The fat content of the diet may
\ important factor (Armstrong and Doll 1975). Genetic factors are implicated in
t 5% of cases of breast cancer. The risk is increased three-fold if the mother or
■ developed breast cancer before the age of 50 (Bain et al 1980). The risk is
ased further if a relative had bilateral disease or if more than one first degree
ve was affected at an early age (Bain et al 1980). The risk factor of early age at
rche and delayed age of menopause indicates that oestrogen activity is involved in
athogenesis. This is supported by the reduction in incidence of breast cancer at an
age (under 35 years). Nulliparous women and those delaying their first full term
lancy until after the age of thirty also have an increased risk.
I
Pathology of Cancerous Tissue: of the pathologic lesions arise in TDLU. In these sites malignant transformation is
ated microscopically by the presence of morphological changes within the
idual cells by the way in which these cells are arranged in relationship to each
*. As long as the proliferating malignant cell is present within the confinement of
basement membrane surrounding the ducts, acini, or the covering surface
basement membrane is breached and the malignant cells are seen infiltrating the breast
stroma and tissue spaces, the tumour becomes an invasive carcinoma. The tumour cells
in both the situ and invasive carcinoma may be arranged in a variety o f ways or exhibit
specific features, and these are used in providing the basis for the histological
classification o f breast carcinoma. Malignant epithelial tumours are by far the most
prevalent o f the malignant breast tumours. Figure 1.2 illustrates a biopsy specimen
containing a typical infiltrating carcinoma.
10 mm
I __________ 1
Figure 1.2 Cut surface o f a biopsy specimen containing a typical infiltrating carcinoma. The tumour has an irregular outline and contracts from the surrounding tissue, producing a slightly concave cut surface.
1.4.2.1 In-situ carcinoma
In situ carcinoma is more commonly seen in association with invasive carcinoma. The
in situ carcinoma is divided in to two major components such as ductal and lobular
carcinoma in situ. There are other less common in situ carcinomas such as Paget’s
diseases o f the nipple and \|n tr a c t^ carcinoma. Mixed ductal and lobular carcinoma in
Ductal carcinoma in situ (DCIS):- The gross appearance of the breast tissue involved
varies according to the extent of the disease and its histological type. The tissue may
appear normal, nodular and the ducts involved may be dilated, indurated and contain a
dark grey thick secretion that can easily be expressed out of the ducts. Any part of the
ductal system, from the subareolar lactiferous sinuses down to the terminal duct, deep
within the breast tissue, may be involved, and it is not uncommon for this type of
carcinoma to affect more than one ductal system at the same time.
Lobular carcinoma in situ:- This is another common histological variety of in situ
carcinoma of the breast. The disease usually affects all acini in a lobule or several
lobules. The normal acinous structure is replaced by a solid mass of large
monomorphic cells with faintly stained cytoplasm and rounded nuclei. The affected
acini are enlarged and may be slightly distorted, but they retain their well-defined
contour surrounded by basement membrane. The lobule as a whole becomes markedly
enlarged and may be distorted, but its component acini retain their normal
topographical relationship with a minimal amount of loose fibrous tissue between them.
Pure lobular carcinoma in situ does not produce a palpable mass by itself, but is usually
discovered incidentally amidst or adjacent to a clinically diagnosed benign lesion or as
a result of a mammographie abnormality. M ost patients are premenopausal and in their
fifth decade.
1.4.2.2 Infiltrating carcinoma
This is the most common histological variety of breast carcinoma. The malignant cell
of the invasive carcinoma is arranged in groups of variable sizes and shapes which may
include glandular structures, separated by a variable amount of fibrous tissue. The
invading aggregates of cells usually have jagged, irregular borders rather than the
smooth, rounded contours of DCIS.
Infiltrating labular carcinoma (ILC):- It is the most common histological type of
mammary carcinoma. It was recognised as a distinctive variant of invasive breast
cancer shortly after LCIS was defined as an entity. Unlike its in situ counterpart, ILC
and distant sites. Grossly, ILC may be indistinguishable from its infiltrating ductal
counterpart. Marked stromal fibrosis may be present, causing a discrete mass.
Conversely, ILC may be present with very little stromal response and may be both
grossly and mammographically undetectable.
Infiltrating ductal carcinoma:- Infiltrating ductal carcinoma is characterised by the
absence o f features seen in the more specialised forms o f breast carcinoma. The
principal characteristic o f this tumour is the infiltration of the stroma by malignant
epithelial cells that are usually arranged in cords that are two or more cell diameters
wide. The infiltrating cells often form lumina that are reminiscent o f the ductal acinar
pattern o f normal breast tissue.
1.4.3 Benign tissue
The mammary gland is susceptible to physiological changes. These changes may
produce clinical abnormalities. The term benign breast disease encompasses a wide
range o f lesions.
v ' - . '
1 0 m m
t, - ...— , I
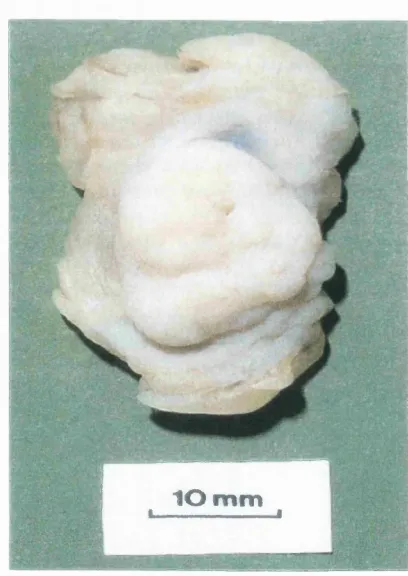
Figure 1.3 Cut surface o f a biopsy specimen containing a typical
fibroadenoma. The lesion has a
smooth, rounded outline, a
f Some well-defined entities but others proved to show a mixture of changes affecting
> the TDLU. The changes may be indicative to the risk of subsequent carcinoma. The
benign breast diseases are described by different terms according to the disease type.
The most commonly used terms are Adenosis, Epithelial hyperplasia, Epithelial
metaplasia, cysts and papilloma (Mills et al 1999). Figure 1.3 shows a biopsy specimen
containing a typical fibroadenoma. Fibroadenoma is being the most common benign
mammary tumour of the breast.
In this project, the breast tissues are divided in two major groups such as healthy breast
tissues for those whose cells are growing in a controlled manner and diseased tissues
for those whose cells are grown in an uncontrolled manner. Table 1.3 shows the
classification of these tissue types.
Healthy Breast tissue Diseased Breast tissue
Fibrous tissue Carcinoma Glandular tissue Benign
A dipose tissue Fibrocystic change Fibroadenoma
Table 1.3 The classification of
healthy and diseased breast
tissues
1.5 Techniques of breast imaging
1.5.0 Introduction
The main strategies considered for control of breast cancer are primary prevention,
secondary prevention or screening and improvement in treatment. The female breast is
prone to benign disease, and it is very important to discriminate between benign and
malignant lesions.
Breast imaging plays an increasing role within screening and the diagnosis of
symptomatic women. Imaging methods should have high specificity and sensitivity in
order to identify and control the cancerous area of the breast (Jones 1982). Therefore
detection of a tumour in its early stage is important. Mammography is currently the best
numerous advances in mammography have greatly improved image quality, the
technique does however have shortcomings that limit its sensitivity and specificity.
Multiple areas of improvement have therefore been required not only to film/screen
mammography, but also to search for entirely new techniques in the study of breast
cancers. Table 1.4 shows the summary of the main techniques of breast imaging.
Imaging
technique Resolution Sensitivity Specificity Advantage Disadvantage Mammography Microcalcification
200p.m
Carcinoma > 1cm
90% 50% Screening
N o differentiation between benign & malignant. Difficult to differentiate the presence of malignancy in dense breast
Ultrason graphy Solid mass > 1cm Cyst -2m m (B-mode)
92% Differentiation between solid mass & cyst
N o differentiation between benign & malignant. Unable to detect preinvasive carcinoma MR imaging > 1 cm 90% 30%-90% In conjunction with
conventional mammography imaging to improve specificity
Unable to differentiate between benign and malignant
PET Reliably detected > 1cm -100% 87% Differentiation between malignant & benign
High cost o f PET scanners
Table 1.4 The characteristics o f different breast imaging techniques.
Sensitivity (or true positive fraction) describes the number of correct positive
assessments per number of truly positive cases and specificity (or true negative
fraction) describes the number of correct negative assessments per number of truly
negative cases. They are both inversely related. Higher sensitivity means that fewer
cancers are missed. Higher specificity means that fewer false-positive diagnoses are
made.
1.5.1 X-ray mammography
X-ray mammography is still the most reliable method of detecting breast lesions. It has
proved to be effective in reducing breast cancer mortality in a number of screening
technique. The mammographie criteria for detecting breast disease are essentially of
three kinds such as:
(/) Calcifications, particularly finer particles (microcalcifications)
(ii) Dense tissue nodules and
(Hi) Spécules of fibrous tissue
These structures must be imaged sharply with high contrast and with a low level of
image noise.
There are a number of requirements for good radiographic techniques. Some of the
basic requirements are given below
(1) X-ray mammography is generally performed with a molybdenum target and
molybdenum filter x-ray spectra, with typical filtration thickness of 30p.m (Jones,
1982). The combination of these two gives rise to a spectrum dominated by Mo
characteristic photons (17.4keV and 19.6keV), but Bremsstrahlung photons with
energy higher than the molybdenum k-edge are also contained in the spectrum. The
result of these Bremsstrahlung photons is to produce an intense diffused
background due to Compton interactions with the soft tissue.
(2) One of the objectives of mammography is to achieve the detection of small
microcalcifications. Microcalcifications can be the sole sign of precancerous or of
already infiltrating mammary carcinoma (Paterok et al 1993). Currently
microcalcifications with diameters up to 0.2 mm as the lower limiting size can be
detected (Karila 1987). The imaging of the tissue nodules and fibrous tissue are
also important requirements of mammography but much less is known about
limiting values. Carcinoma up to 1 cm in diameter must be detected.
(3) Breast tissue is very sensitive to the induction of breast cancer by ionising radiation
(4) The exposure should be less than 2 seconds. This requirement is desirable in order
( ? ) to minimise patient pain due to the applicators applied to compress the breast.
Despite all the advantages of x-ray breast imaging, it has failed to detect the difference
between normal and cancerous tissue because of the low differences in absorption
coefficients at the characteristic x-ray energies. Consequently, it is difficult to obtain
radiographs with high contrast. The problem is more pronounced when imaging the
dense breast. Approximately 25% of women have dense breasts (Tabar and Dean
1982). It has shortcomings in terms of sensitivity and specificity. On the one hand 5-
15% of breast cancers are not visualised mammographically (Weinreb and Newstead
1994); on the other hand the overall yield of breast cancers per number of breast
biopsies recommended on the basis of screening mammograms ranges between roughly
10-50% (Weinreb and Newstead 1994, Paterok et al 1993). This demonstrates that the
current x-ray mammography has failed to differentiate between benign and cancerous
lesions.
As it has been mentioned above one of the risks of mammography is the carcinogenic
potential of the ionising radiation. Therefore, each radiological procedure should be
justified and optimised. For radiology the principle of optimisation means that the
radiation dose should be kept as low as compatible with the image quality that is
necessary for diagnosis. Table 1.5 shows the diagnostic requirement for good breast
imaging performance.
Radiographic device Specially dedicated equipment. Anode material: M o Focal spot size < 0.6 mm
Total filtration 0.03 mm M o or 0.5 mm A1 equivalent
Anti-scatter grid Specially designed m oving grid may be necessary Film -screen combination Dedicated high-resolution film -screen combination Focus-film distance > 60 cm
Radiographic voltage 23-35 kV
Automatic exposure control Chamber selected-specially positioned Exposure time < 2 seconds
Breast com pression Should be applied to a level which the patient can tolerate (not exceeding 200N )
The most important characteristics of the radiographic procedure which affect the
resulting image quality are: (1) the focal spot size used together with contact and
magnification technique and, (2) the reduction of scattered radiation and the imaging
geometry of the whole system itself. Image quality is used to indicate the accuracy with
which details can be perceived in a mammogram. Usually image quality is described by
the interaction of contrast, sharpness and noise.
A number of publications, since the introduction of the molybdenum anode and
molybdenum filter, have shown that radiation quality and dose must be matched to the
thickness (under compression) and tissue composition of the breast (Dance and Day
1981, Jennings et al 1993). The conventional anode-filter system adaptations of
radiation quality to object thickness are very limited. The relative energy distribution of
the x-ray spectrum changes only insignificantly with an increase in tube voltage from
25 kV to 30 kV. Therefore the advantage of using a molybdenum anode starts to be lost
for breast thickness above 3 cm because higher kVp has to be used to achieve sufficient
penetration. It is clearly shown in the signal to noise relationship with breast thickness
and energy (Dance and Day, 1981) that Mo imaging is inappropriate for very large
breasts, where it would be preferable to use a slightly higher energy spectrum.
However, with a tungsten anode in combination with molybdenum and rhodium filters,
the energy distribution of the spectrum at higher kV is clearly shifted towards higher
energies in comparison with the spectrum at lower kV and has proved to be better for
the imaging of thicker breasts (Sabel et al 1986).
X
^ 1.5.2(^ray imaging system constraints
The finite size of the focal spot of an x-ray tube leads to geometric unsharpness. Muntz
et al (1985) used multiparameter techniques for the optimisation of the geometrical
configuration. The optimisation is subject to constraints imposed by technology, such
as power limits for the tube focal spot. The size of the focal spot affects the image
sharpness of a structure because it is located at a distance from the film. Therefore, the
focal spot size should be as small as possible for better image sharpness. However, the
avoid exposure times of several seconds, there must be a compromise. Typical values
of the focal spot width and length are in the range of 0.4 - 0.6 mm and 0.6 - 0.85 mm
respectively. The use of a magnification technique along with the standard grid
technique is restricted to the clarification of suspected microcalcifications and the finest
tissue structures (Kratzat 1988). Microcalcifications with diameters in the order of 200
pm are successfully displayed, which appears to be necessary from a clinical point of
view.
1.5.3 Reduction of x-ray scatter
X-ray scatter is one of the main problems of conventional x-ray mammography. Grids
or air gaps are introduced in order to reduce or, if possible, to remove the amounts of
scatter reaching the detector. The techniques used commonly for reducing the scatter
contribution and improving image quality are discussed in the following sections.
Scattered radiation grids.- Image contrast is degraded by scattered radiation arriving at
the image receptor. The contrast reduction varies with breast size and tissue
composition (Dance and Day 1984, Dance et al 1992), and is relatively insensitive to
radiation quality. The employment of anti scatter grids to reduce the amount of scatter
is well established and usually the grid moves during the exposure, but occasionally a
stationary grid arranged either inside or outside the cassette may be found.
A ir gap and slit technique:- Other methods of reducing scatter are air gap and scanning
slit techniques. The air gap technique is applied together with the magnification
technique. Muntz et al (1976) assumed an effective scatter point source to describe the
behaviour of the scatter/primary ratio as a function o f the air gap. In mammography the
same source-image distance is used for both the grid and magnification techniques. The
better solution would be to move the image receptor away from the patient, but this is
hard to achieve because of the limited loading capacity o f the small focal spot (Barnes
For the slit technique the beam is collimated close to the tube and the image receptor to
form a fan beam, which is guided over the breast. By pivoting the x-ray tube, the angle
between the anode disc and the imaging receptor is constant during the scanning
motion, thereby avoiding variations in x-ray fluence due to the heel effect (the pivot
point is the focal spot). Barnes et al (1993) found when quantifying the performance of
scanning slit mammography that a 25 - 45% improvement in contrast over that possible
with conventional grids for 5 to 8 cm thick breasts can be achieved. Decisive for the
efficacy of the slit system is the slit width. On the other hand the tube load increases as
the slit width decreases. A slit width of 7.5 mm close to the film -screen system results
in an image quality comparable with that of conventional grid mammograms at half the
patient exposure. To reduce the tube load Barnes et al (1993) proposed a multiple-slit
assembly. Such a system, they claim, can virtually eliminate scatter in mammography
with little or no loss of the primary x-rays emerging from the breast.
1.5.4 Image receptors
Image receptors form an image by the absorption of energy from the x-ray beam but a
variety of techniques are used to convert the resulting energy distribution into
something that can be visualised by eye. Image receptors in clinical mammography
include film-screen systems and digital sensors.
1.5.4.1 Film-screen systems
In routine mammography film-screen combinations are used almost exclusively as
image receptors. The application of industrial type (non-screen) x-ray film is either no
longer recommended or explicitly forbidden in different countries because of the high
radiation exposure. Often the sensitivity of the image receptor is characterised by the
so-called ‘system dose’ which is usually defined as the air kerma at the location of the
image receptor needed to obtain the receptor-specific exposure. In some countries, for
film-screen combinations there was a wide spread of system doses during the eighties
The typical system dose of a modem film screen system is about 1 - 3% of that of the
non-screen film. Average glandular dose is directly proportional to the system dose.
The reciprocal value of the system dose in turn is proportional to the speed of the image
receptor. Speed and system doses depend considerably upon the film processing, which
also influences contrast, resolution and noise (Haus 1992). Typical values for the
system dose of different image receptors are given in table 1.6.
Image receptor
System dose
For In /X jy
Industrial x-ray film Optical density (including base and fog) o f 2.0
3000
X erox 125 Optimum edge enhancement 1500-3000 Film screen system
During eighties
Optical density (including base and fog) o f 1.5
40-900
Film screen system Since 1990
Optical density (including base and fog) o f 1.5
4 0 -100
Table 1.6 Typical values fo r the system dose o f différent image
receptors. (Taken fro m Sabel et al 1989)
1.5.4.2 D igital radiography
Film screen is still the gold standard for the detection and diagnosis of breast cancer,
but it has certain limitations, which could possibly be overcome if mammograms were
recorded in a digital form. The most important limitation is the narrow dynamic range
(1:25), which must be balanced against the need of wide latitude (1:100) (Yaffe 1992).
The slope of the characteristic curve of the radiographic film determines the contrast
properties and the attenuation difference between a lesion and the surrounding tissue,
which can be seen in the image. Masses and microcalcifications in very dense breasts,
which are important indicators of cancer, are, therefore, hardly visualised by film-
screen combinations. On the contrary, in digital mammography with the help of
windowing the detectability of subtle details is limited only by noise. Digital
mammography, thus, has the potential for improving the display of poorly contrasting
details. Yaffe (1992) discussed various concepts for a digital mammography system: