Diagrammatic Reasoning
and Propositional Logic
A Philosophical Study of
Peirce’s Alpha Existential Graphs
A J . Norman
ProQuest Number: 10016191
All rights reserved
INFORMATION TO ALL USERS
The quality of this reproduction is dependent upon the quality of the copy submitted.
In the unlikely event that the author did not send a complete manuscript and there are missing pages, these will be noted. Also, if material had to be removed,
a note will indicate the deletion.
uest.
ProQuest 10016191
Published by ProQuest LLC(2016). Copyright of the Dissertation is held by the Author.
All rights reserved.
This work is protected against unauthorized copying under Title 17, United States Code. Microform Edition © ProQuest LLC.
ProQuest LLC
789 East Eisenhower Parkway P.O. Box 1346
Abstract
It has been the standard view o f philosophers in this centur>' that the use o f diagrams is
incompatible with rigour in logic; and that diagrams are dispensable from logical proof, in the
sense that there is no proof o f which a diagram is an essential part. This view has come under
recent attack by logicians who have proved certain diagrammatic logics - for example, Venn
diagrams and Peirce's Existential Graphs - to be sound and complete.
This thesis builds on these results, by arguing positively that a diagrammatic logic can have
informational resources in virtue of its representational form which are not available to a
logically equivalent sentential counterpart; that these resources can facilitate the process o f
logical inference; and that this implies a view o f deductive inference generally which is not
straightforwardly “deductivist", but incorporates observational and experimental processes.
The strategy followed is to examine the representational features o f a particular diagrammatic
logic - the alpha Existential Graphs, or EG - and to compare them to those o f certain varieties
o f sentential logic (flve-functor, two-functor and Polish notation SL), to which EG is
extensionalK equivalent. In the first half o f the thesis, I introduce and situate the standard
view; explore the distinctive features o f diagrams, and diagrammatic representation: analyse
the ke\ idea o f perspicuousness; and review current theories o f information to determine a
compatible background account. In the second half, I introduce EG, and show that it is more
perspicuous in the required sense than SL; rebut a well-known claim that EG relies on some
special notion o f “Peirce provabilit} ", and describe how EG can motivate a non-deductivist
account o f deductive reasoning. Finally, I criticise the standard view o f diagrams, and locate
EG within Peirce's general theor>' o f signs, underlining the strong motivations for Peirce's
late move into diagrammatic logic.
A Note on Terminology
I use the phrase “sentential logic" hereafter simply to refer to logics with the representational
form o f sentences. The phrase is not intended to mark any distinction, or take any view as
such, as to the content or subject matter o f logic. In this usage, then, it is possible to say that a
sentence o f sentential logic A and a diagram o f diagrammatic logic B are different
representations o f the same logical content. Among those who take the subject matter o f logic
to be (or to be like) propositions, A and B can then both be described as different forms o f
propositional logic, and representations o f A and B can be described generally as propositional
Contents
1
Logical Reasoning and Diagrams
4
2
Diagrams, Depictions and Descriptions
12
3
Diagrams and Information
28
4
The Alpha Existential Graphs
43
5
EG and Diagrammatic Information
52
6
Diagrams and Proof
67
7
Conclusions
84
Endnotes
87
1: Logical Reasoning and Diagrams
].] Context: The Dethronement of Diagrams
What is the logical status o f diagrams? And what is the relation, if any, bet\\ een diagrams
and logical reasoning? Until recently the answers to both these questions have seemed self-
evident to logicians. The standard view was given a well-known formulation by Tennant
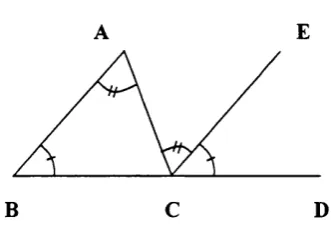
1986 in connection with geometiy :
It is now commonplace to observe that the diagram [sc. triangle ABC] ... is only an heuristic to prompt certain trains o f inference; that it is dispensable as a proof- theoretic dev ice; indeed, that it has no proper place in the proof as such. For the proof is a syntactic object consisting only o f sentences arranged in a finite and inspectable array. One is cautioned, and corrected, about ... the mistake o f assuming as given information that is true only o f the triangle that one has happened to draw, but which could well be false of other triangles that one might equally well have drawn in its stead.'
That is. diagrams have no logical status as such, indeed they are out o f place in proof
generally. Proofs are composed o f sentences o f logic; and a diagram is not a sentence, nor a
sentence a diagram. Since proofs are composed o f sentences, there can be no proof o f which
a diagram is an essential part. If a diagram has any role to play in proof, it is not syntactic but
heuristic; to make the reasoner's cognitive processes faster or easier, perhaps. Where a
diagram has played this role, however, the ultimate justification for the conclusion must come
through a (sentential) proof. Especially so since diagrams may be misleading; the information
derived from a piece o f reasoning from diagrams may not, for example, count in the general
case.
Similar expressions o f this general view could be multiplied without difficult).^ Its origins
appear to lie in mathematical and logical developments o f the 19"’ century. Historically, the
status o f diagrams in mathematics had been all but unquestioned, secured by their role in
Euclidean geometiy . In E uclid's demonstrations, the diagrams are generally indispensable; if
they are omitted, then what remains is no longer a demonstration o f the theorem in question.
Although Euclidean geometry was regarded for centuries as the paradigm o f the axiomatic
from its axioms; rather, they are generated from the axioms by a concomitant process o f
construction, using ruler and compass according to the first three postulates (drawing a line
segment, extending a line segment by another line segment, and drawing a circle about a
given point with a certain line segment as radius). It is this process which, in the absence of
an explicit theory’ o f order, gives the requisite intuitive sense o f continuity and (because it can
be iterated) inflnit>’ o f points in the line.^ In Euclidean proofs, certain assertions are
warranted only by the text o f the proof (such as equalit>' o f lines or magnitudes), while other
assertions (such as those relating to topological information about regions and intersections)
are warranted solely by the diagrams themselves.'* Diagrams not properly constructed cannot
be utilised; the use o f an improperly constructed diagram in Euclid is equivalent to the covert
introduction o f new axioms, an act which, in view o f the cumulative p ro o f structure o f the
Elemenis, w ould ser\'e to undermine the rigour and results of the whole project.^ Within
Euclidean geometry', thus, the constructed diagrams are indispensable both to the formal
theory o f proof in the s> stem, and to the process o f geometrical reasoning.
Historicall), much o f the influence o f Euclidean geometry' appears to have derived from the
central role played in it by diagrams. In Euclid's system it seemed possible to intuit the
process and results o f geometrical reasoning, w ith a clarit) and self-evidence not given in
algebra. The diagrams themselves could be manipulated through the process o f construction
so as to yield new information and new results. And the use o f diagrams seems to have
pla\ ed an important role in giving to Euclidean geometry an accessible, public and apparently
indisputable character which for a long period ensured its paradigmatic status among the
exact sciences. An aw areness o f this status is, as many have noted, a constant background
theme in 17th and 18th century philosophy, and culminates in the project Kant sets him self in
the first Critique: “This attempt to alter the procedure which has hitherto prevailed in
metaphysics, by completely revolutionising it in accordance with the example set by the
geometers and physicists, forms indeed the main purpose o f this critique” (Kant 1781/7 Bxxii;
italics added).
But it is well-known that this picture was superseded in several respects during the last
century. In the first place, it was discovered that some proofs in Euclid were invalid or
incomplete because o f an over-reliance on features o f the diagrams involved, a finding w hich
may have reinforced a more general view that diagrams were often misleading. Secondly,
geometry w as given an axiomatisation by Hilbert which included the required theory o f order,
in which the specifically Euclidean act o f construction therefore played no role, and which
required no reference to diagrams.^ New and more rigorous accounts were given o f such key
non-Euclidean geometries by Gauss, Riemann, Lobachevski and others undercut the apparently
“given’* nature o f Euclidean geometr>'; and did so in terms which, far from requiring the use
o f diagrams, often appeared non-visualisable and only able to be formulated at all in
equations. And these developments in geometry were to some extent paralleled by the
discover) o f counterintuitive results in analysis (such as continuous but nowhere-
differentiable curves), which likewise fuelled a general scepticism about what could be
considered intuitive, and indeed about the meaning o f what it was to be intuitive at all.^ It is
this scepticism which motivates Frege's attempt to demonstrate the “autonomy” o f arithmetic
from intuition.
The case o f Euclid illustrates both the changing status o f diagrams and more general claims
made against them: that diagrams are generally not compatible with rigour in mathematical
proofs; that, as physical representations, they are insufficient to the generalised case; and that,
because they can sometimes be visually misleading, they are not to be relied upon in
warranting inferences or discover) , whatever their other merits may be.
Among logicians, the status o f diagrammatic logics seems to have been undermined by their
novelt) . by real weaknesses in the principal systems employed, and by the comparative
success o f sentential logics. The notation o f the Begriffsschrift, often considered
diagrammatic, was widel) criticised on and after publication as being cumbrous and
unwield) , and resistance to it may have contributed to the slow reception o f Frege’s ideas.^
By contrast, the diagrammatic logics o f Euler and Venn, though generally considered quite
intuitive, were long known to have serious formal limitations. In Euler’s original system it is
difficult to represent contradictory information, for example, while Venn him self
acknowledged that his diagrams could not generally represent hypothetical or disjunctive
information.^ Neither system can express multiple general it)'; until recently, neither system
had been given a formalised syntax and semantics. Clearly, such basic weaknesses would, if
unaddressed, gravely limit the expressiveness o f these logics. The contrast with the
achievements o f sentential logic (truth-functional and predicate), though it would not have
been so marked at the end o f the 19th centur)', is quite evident today.
1.2 Diagrams Re-evaluated
Both within mathematics and logic, then, the standard view has been that diagrams have no
place in rigorous logical reasoning; they are merely heuristic. It is interesting to compare this
retain a central place in both teaching and discovery. Three examples illustrate this point, and
the tendency o f practitioners to prefer diagrams to symbolic formulations in certain contexts
o f reasoning:
• Alfred Marshall, in his seminal Principles o f Econoniics: “The use o f [diagrams] requires
no special knowledge, and they often express the conditions o f economic life more
accurately, as well as more easily, than do mathematical symbols ... [E]xperience seems
to show that they give a firmer grasp o f many important principles than can be got
without their aid; and that there are many problems o f pure theory, which no-one who has
once learned to use diagrams will willingly handle in any other way.” ’°
• Einstein, writing to Jacques Hadamard: “The words or the language, as they are written
or spoken, do not seem to play any role in my mechanism o f thought. The psychical
entities which seem to ser\ e as elements in thought are certain signs and more or less
clear images, which can be voluntariK reproduced and combined ... The above
mentioned elements are, in my case, o f visual and some o f a muscular t>pe. Conventional
words or other signs h a \e to be sought for laboriously only in a secondaiy stage...
• Feynman diagrams. Schweber describes the emergence o f two parallel but apparently
different theories o f quantum electrodynamics in the late 1940s: the first -
mathematically veiy demanding - approach was developed by Schwinger and Tomonaga;
the second, a diagrammatic approach which greatly facilitated the process o f calculation,
was developed by Feynman. Feynman diagrams were regarded as a useful curiosit)' until
Freeman D) son proved the two theories to give equivalent results in 1948/9, after which
the) were rapidly adopted by the majorit) of physicists working in the area.'"
These examples underline the heuristic value o f diagrams, which has already been noted: the
extent to which they can help the reasoner to grasp concepts, illustrate ideas, avoid mistakes,
formulate conjectures or develop proofs. To explain this phenomenon, philosophers have
increasingly examined precisely what role diagrams can play in the processes o f reasoning
and discover), both in the empirical sciences and in a priori disciplines such as mathematics
and logic. Thus in mathematics, for example, it has been suggested that diagrams, or rather
visual thinking, may generally be a means o f discovery o f theorems in geometiy' and
arithmetic, but only in a very restricted range o f cases in elementary' a n a l y s i s . T h i s is a
stronger sense o f “heuristic value" than the purely psychological; as well as any role they may
knowledge-yielding. By this means the heuristic status o f diagrams has been analysed, and to
some extent found to be justified, by philosophical inquiry.
What is it to be merely heuristic, however? As I have noted, on what has been called the
standard view, proofs are syntactic objects composed o f sentences, and diagrams are seen as
merely supplements or addenda to proofs, and therefore eliminable from them. This very
strong claim has the consequence that there cannot be a diagrammatic logic. It must,
however, now be revised in t\\o respects.
• As regards the claim that diagrammatic logics cannot be rigorously formalised, it has
recently been demonstrated that Venn diagrams can be given their own syntax and
semantics, with rules o f transformation which make the system demonstrably sound
and complete. The problem o f representing disjunctive information can be overcome.
Moreover, a modest extension o f the system suffices to make it logically equivalent to
a first-order monadic language.’'^
• As regards the claim that diagrammatic logics lack expressive power, it has been
demonstrated that a less well-known but more sophisticated system, the existential
graphs o f C.S. Peirce, is logically equivalent to propositional logic in its Alpha
version, and to first order predicate logic with identit)' in its more developed Beta
version.'^ In its Gamma version, it can generate systems provably equivalent to the
principal systems o f modal logic.
From a formal perspective, therefore, certain diagram systems can be considered logics in a
full sense, and at least one diagrammatic logic is extensionally equivalent to the symbolic
system most in current use. This suggests a response to the standard view: that one way in
which diagrams go beyond the merely heuristic is in diagrammatic logics, for diagrams are
not eliminable from diagrammatic proofs.
A holder o f the standard view might respond to this claim in a number o f different ways,
which I will explore in Chapter 7. At this stage, the point is simply to notice the apparent
possibilité' that a diagrammatic logic could combine the exactness and precision o f syntax o f a
sentential logic, with the heuristic value o f diagrams in general. Such a logic would be both
secure and, in some sense still to be refined, intuitive. And, in particular, it would not be
misleading, since the syntax o f the system would define exactly what it was to be a well-
Various claims in this area have been made on behalf o f diagrams, both within diagrammatic
logics, and within diagrammatic presentations o f non-diagrammatic logical systems. These
contrast diagrams favourably with classical sentential logics. Such claims include: that
diagrams prompt patterns o f reasoning which are o f a different character from those of
classical logic, and which enable users to solve more complex problems; and that they are
easier to learn, more intuitive in some sense, and more informative than their sentential
counterparts.
Thus Roberts says o f Peirce’s existential graphs that “if a facile and perspicuous notation is
one that can be quickly learned and easily manipulated, then years o f experience with
university students have convinced me that [Peirce’s notation] is the most perspicuous, and
Principia notation the least.”’’ Brauner et al. say o f the existential graphs: “our personal
experiences in logic teaching within the humanities also suggest that one may benefit a lot
from the use o f graphs in the teaching o f such logic courses” .’* And Banv'ise and
Etchemendy claim that a diagrammatic presentation of Turing machines {Turing’s World)
allow s students to solve significantly more complex computabilit)' problems than does its
sentential equivalent, a 4-tuple notation; the\ note a discrepancy between what they consider
traditional logical reasoning and the wider forms o f valid reasoning actually engendered by
diagrams, calling for a richer theoiy able to accommodate these cases too; and they describe
how in the H yperproof system diagrams prompt analytical approaches (e.g. proof by cases) in
logic more intuitively than do sentences. The greater relative informativeness o f the diagrams
is ascribed to the ways in which they capture and differentiate between possibilities.’^
1.3 Diagrammatic logic and information
Some o f the issues raised above can best be addressed by cognitive psychology. But such
claims for diagrammatic logics also raise a range o f philosophical questions: How is the
distinction between diagrams and sentences to be understood? How can diagrams in general
be more informative or perspicuous than sentential representations? If diagrammatic logics
are in some ways more informative or perspicuous than equivalent sentential logics, are they
so in virtue o f certain intrinsic features o f all diagrams, or for some other reason (perhaps due
to the specific rules o f inference o f the systems in question)? What are the advantages and
disadvantages o f a sentential logic as compared to its diagrammatic equivalent? (Even to
pose the latter question may strike some as odd, given the overwhelming predominance o f
Perhaps the most fundamental question is this: what does it mean to say a diagram is more
perspicuous than a sentence? In the case o f extensionally equivalent l o g i c s a n d 5 , what
notion o f information is able both to capture the fact o f logical equivalence, and
simultaneously to explain howy^ can be more informative than B1 There would seem to be an
air o f paradox - if not o f contradiction - about this claim, at three levels. First, some
philosophers have questioned whether it makes sense to talk o f logic as conveying
information at all. Secondly, if logics A and B convey the same information, then it is not
clear how one can also be more informative than the other. And finally, if two equivalent
logics can be differently informative, it is not clear whether this distinction can be made in
terms o f a concept of information which is philosophically interesting and not purely
psychological; that is, not simply reflective o f human habits o f thought.
These are deep issues, and I will not attempt to provide a general answer to them here.
Rather, my strategy is a more limited one: to approach these questions by examining the
representational features o f a particular t> pe o f diagrammatic logic as against those o f an
expressively equivalent sentential counterpart. The logics to be used are Peirce's alpha
existential graphs (hereafter EG) and various notâtional forms o f sentential (truth-functional)
logic (SL). This strategy has a number o f advantages over a more general study o f
diagrammatic representation. First, since it is known in advance that these logics are both
sound, complete and expressively equivalent, it will be possible to focus on their
representational features without the concern that one may be more informative than the other
simply for reasons o f logical power. Second, the fact that the syntax and semantics can be
precisely specified for both sy stems allows us to sidestep a number o f problems which arise in
more informal contexts from lack o f clarity regarding the general or specific constraints on
diagrammatic representation. These include problems o f generality o f content, o f
misrepresentation and of improper inference. In the cases to be discussed here, it will be clear
what the content o f a propositional representation is, whether such a representation is well-
formed, and whether a given rule o f inference is applicable.
Accordingly, this thesis falls naturally into two halves. In the first, I examine descriptions,
diagrams and depictions as representational types, in order to isolate certain general features
o f diagrams in virtue o f which they can convey information perspicuously (Chapter 2); and
review current theories o f information in order to determine a compatible background account
o f information (Chapter 3). This allows a more rigorous restatement to be given o f the key
idea o f perspicuousness. In the second half, I introduce EG formally (Chapter 4); compare it
to various types o f SL (Chapter 5); rebut a recent claim about provability in EG which would
perspicuousness motivates a “non-deductivist” view o f deductive reasoning, and indeed a
specific distinction betv^ een tw o t) pes o f such reasoning (Chapter 6). The last chapter returns
to some o f the more general questions about diagrams raised above.
In adopting this approach I hope, not merely to provide limited answers to the questions
posed above, but to shed light on three issues o f broader interest. The first relates to the
question whether, and in what sense, there may be a role for intuition in logic. For reasons
already noted, the claim that geometiy - let alone arithmetic - involves some act o f intuition
came to be questioned in the second half o f the 19*^ century. In the case o f logic, however, a
plausible account o f visual information and visual inference in a diagrammatic logic provides
reason for thinking that some specific notion o f intuition, close to the core sense o f the word,
is in play here.
The second question relates to the nature of deductive reasoning and proof. I have already
mentioned claims that in some contexts the t}'pes o f reasoning used in diagrams differ from
those to be found in classical logic. While this may be true in other contexts, I want to
suggest something different: that in this rather basic case, an analysis o f EG motivates and
supports the claim that deductive reasoning generally involves elements o f observation and
experimentation; and that this is also true o f deductive reasoning about sentences, though its
motivation is less evident here owing to their less perspicuous representational form. Such an
account, unsurprisingly perhaps, has the potential to return us to a view o f deduction more
akin to that to be found in Euclid, in contrast to those who think o f deduction as
homogeneous.
The final question is not a philosophical question at all, but an historical one. Peirce invented
the existential graphs in the early 1890s, and he gave up sentential logic as a result and never
returned to it. This was not a trivial step, since Peirce had made very significant contributions
to sentential logic during the previous decade: among his achievements were the invention o f
quantifiers around 1883, independently o f Frege and in substantially the representational form
which they take today; his demonstration that propositional logic can be developed using one
operator c. 1880, a generation before the Sheffer stroke was invented; one o f the earliest uses
o f the truth table method as a general test for validity; and the first use o f what since become
known as prenex normal form.^° The question therefore arises as to why Peirce should have
turned his back so completely on the new field, having made such fundamental discoveries
and at precisely the time when it was undergoing so revolutionary a period o f development.
To the extent that the alpha graphs warrant, I hope to shed light during this discussion on the
philosophical case for such a step.
2: Diagrams, Depictions and Descriptions
2.1 Introduction
Consider the following situation. Bill and Jane want to give their friends directions to their
house. That is, they want to present their friends with some relevant information in a way
which will (a) if followed correctly, guide them to their house, and (b) in case o f error, will
allow them to find their way back to the correct route. There is no obvious limit to the
amount o f collateral information required to meet goal (b). But some selection must clearly
be made, both because their friends' ability' to absorb information is finite, and because there
is some information which would be actively misleading or distracting if included. And the
choice o f how the information is represented is important for similar reasons: what is needed
is a method o f representation which, as far as possible, compactly and explicitly represents the
intended information, but which does not also convey irrelevant information.
There would seem to be three general methods to represent this information: via a description
(say, a set o f instructions), via a depiction (say, a photograph) and via a diagram (say, a sketch
map).^' And there will also be hybrid solutions from among the three.
What I want to do in this chapter is to compare these three representational types, in order to
bring out some o f the characteristic features o f each; and to understand the idea o f
perspicuousness better. I will not attempt to give a general account o f diagrammatic
representation, though I will consider various conditions on a representation relation, and try
to situate these comments within this wider debate. Two caveats are in order. First, I shall
deal rather briefly, perhaps too briefly in places, with the substantial philosophical and
psychological literature which has built up on the representational character o f descriptions
and depictions (less so, on diagrams), and the differences between them. Secondly, however,
the discussion will unavoidably involve appeals to intuition as to what constitute tokens o f
each representational type. This is complicated by the very wide range o f representations
which can, with more or less justification, be classified as depictions or diagrams; intuitions
here (especially about hard cases) can often diverge. Rather than try to offer any general
-a common core o f intuitions -as to wh-at constitutes -a token o f e-ach represent-ation-al t>'pe. Th-at
such t>'pes do have characteristic features - indeed, to what extent it is appropriate to
differentiate three such t>'pes at all - should become clear from the discussion.
2.2 Descriptions. Depictions and Diagrams
The focus o f this chapter is, then, mainly on the representational differences between
descriptions, depictions and diagrams. There are also non-representational differences
betv^ een these t>pes (differences o f use or function, for example; such as communication,
problem-solving, conveying aesthetic or linguistic meaning, etc.) and some o f these will
assume importance later in the discussion. And within each type, for reasons I shall examine,
sometimes non-representational characteristics (for example, the content o f a description) can
affect the perspicuousness o f a given token.
Numerous attempts have been made to characterise and explain the representational
differences between the three types. Representations have been classified as, to take a few
examples, '"graphical/linguistic", “analogical/Fregean", '‘analog/propositional”,
“graphical/sentential”, “diagrammatic/linguistic” ." Commentators have sought, not to give
necessaiy and sufficient conditions on a representation's being o f one t>pe or another, but to
identify a single property’ alleged to be characteristic o f a given t>pe. Such alleged properties
include, for a given representation: the sequentialit) or linearity o f its sub-elements; its
degree o f compactness; whether or not its colour is relevant; whether or not it represents from
a certain point o f view; w hether or not its target or range can be seen; its relative scope to
misrepresent; its scope for labelling or annotation; whether it is “analogue” or “digital”; its
degree o f semantic and syntactic “density”, and “relative repletion”; whether or not it includes
certain characteristic ty pes o f shape or figure; whether it is or requires to be one-, two- or
three-dimensional; whether or not it resembles, or is homomorphic or isomorphic to, its range
or target; and whether or not it has certain properties (permitting free rides, restricted by over
specificity) imposed by the structural constraints on the relation between representations and
their targets.^^
There is little if any unanimity, at any level o f detail, amid this plethora o f claims, which
reflect differing goals, methods, background disciplines and governing assumptions. As a
basis for this discussion, then - and at the risk o f travestying a much debated topic - 1 will
simply set out a general characterisation o f descriptions, depictions and diagrams which I
believe captures some common intuitions and many o f the insights above. I shall assume.
here and later, that all such representations are well-formed, appropriately sized and visually
salient. Such a general characterisation might go as follows:
• Descriptions are normally composed o f sentences o f natural language. Such
sentences are linear sequences o f words, which are symbols whose meaning is (very broadly) implicitly or explicitly established by convention among their users. When these words are scanned in a certain order by a suitably informed viewer, they can convey information. Such information may be general or particular.
• Depictions, however, are not generally linear but two- (sometimes three-)
dimensional; they are composed o f elements which do not require to be scanned in any order by the viewer to convey information. These elements are not, at least in the first place, symbolic (though they can often be given symbolic interpretation). Let us say for purposes o f discussion that depictions generally convey information by having a visual similarity o f appearance to their objects.^'* However, depictions can also convey information through the relations o f their elements to each other, where these represent relations between their objects. Such relations are what allow depictions to represent scenes. Such scenes are intrinsically particular, though it may be possible to give them a general interpretation: a depiction o f an old man may convey some general attitude to or belief about the effects o f old age, but in the first place it is a picture o f a particular old man, actual or imagined. The resemblance generally characteristic o f depiction thus places a constraint on interpretation.
• Diagrams are, in effect, an intermediate case. Like depictions, typically they are not linear but two- (sometimes three-) dimensional. Like sentences, they are often compositionally very flexible. Well-drawn diagrams are generally schematic; that is, they do not contain irrelevant detail. They can convey particular or general
information, both through the conventionally established meaning o f their symbol- elements, and through the relations o f their elements to each other. The elements o f a diagram need not be defined by convention, nor by any visual similarity to their objects. What constitute the visually relevant features o f a diagram may vary with interpretation.
This comparison is o f course, far from exhaustive; however, it captures two important
intuitions: first, that in a spectrum o f representations whose opposite poles are descriptions
and depictions, diagrams in some sense occupy a middle place, closer to the latter than the
former; second, that while all three types use symbols as marks (which must in some sense be
interpreted to have meaning), they can all also employ symbolism at a higher level. Let me
explain this last point with an example.^^ Take the case o f a picture which represents the
Holy Spirit as a dove. The picture bears a series o f marks which we can recognise as a dove;
but it also represents the Holy Spirit. It does not, one wants to say, depict the Holy Spirit; the
fact that the Holy Spirit is connoted by the dove is a further piece o f symbolic content, which
is supplied by the observer’s background information. This content is secondary; if the dove
were not represented the Holy Spirit would not be. One wants to say, following Hopkins
1998, that there are two levels o f representation here. The picture uses “bare” symbols; these
are enough, when organised in a certain way, for it to convey information as a depiction. It
depiction, for a description o f the same scene could represent the dove in a similar manner
(the symbolic or allegorical content could be assigned to the word “dove”).
I think this distinction, between what will later be called iconic and symbolic representation,
is fundamental to understanding how descriptions, depictions and diagrams represent; and I
will discuss it further below. For now, however, let us return to the broad characterisation o f
differences above. Clearly, this is far too abstract and vague as it stands. Part o f the problem
lies, as has been mentioned, with the sheer diversity o f what can, without straining, be
considered diagrams: many types o f map, product instructions, Venn diagrams, Cartesian
(X-Y) graphs, blueprints, Feynman diagrams, chemical valency diagrams, wiring diagrams
and the wide variety o f diagrams used in business (flowcharts, pie charts, scatter plots, gant
charts, bar charts, organisational hierarchies etc.).^^ W hat do these have in common? And
how can diagrams as a whole be more precisely differentiated from descriptions and
depictions?
Before responding, let us first notice one background point. It seems generally to be a
condition on r ’s being a representation o f X that it be subject to some underlying cause or
intention. Thus, we consider a blueprint to represent a building in part because someone has
caused or intended it to do so; we consider an ECG reading to represent heart activity because
the machine has been (intentionally) set up to make it do so, and there is a causal relation
between the heart’s electrical outputs as measured and the shape o f the line on screen. It is
not enough that there be some purely accidental relation between the two; we do not consider
that an ECG reading represents a graph o f UK GNP even if the two are in fact identical.
(Note that this underlying intention does not mean that a representation must convey the
information it is intended to convey; it may in fact fail to do so, or the intender may not know
in advance precisely what information he or she intends to convey. N or does it mean that,
even where it succeeds in conveying its intended information, it must convey only that
information; there are cases in which the reasoner or creator o f the representation has no such
specific intention, indeed many diagrams are valuable because they give free rides to
unintended or unexpected information.) Finally, there will clearly be information which is
intended to be part o f a representation, is relevant to the representation’s conveying the
intended information, but is not part o f the intended information itself. Thus, in creating the
representation that “there is a ball on a box”, I intend that it contain seven words, it is relevant
to its representing what it does that it contain seven words, but it is not part o f the intended
information that it do so.^’
We can now say that one important property o f descriptions is this: they need only express
their intended information; they can leave unsaid and indeterminate some aspect o f what is
described; they need not convey more than is required. They are, one might say, discreet. A
description o f a ball on a box may be enormously detailed, or it may simply be the sentence:
“there is a ball on a box” . Depictions, by contrast, generally represent more information than
is needed, in three ways. First, it may be in the nature o f the specific type o f depiction to
display more information than is needed; thus, a photograph o f a box will almost invariably
contain additional information as to background, while a drawing could leave this information
indeterminate while still remaining depictive. Second, though, there are some types o f
information which depictions must generally represent in order to depict other information.
Thus, it is difficult simply to depict information about shape without also depicting
information about size and orientation; and similarly, to depict information about texture,
colour or intensity without (perhaps only vaguely) depicting information about shape.
Thirdly, while the background may be indeterminate, it is difficult for a depiction to leave its
intended information indeterminate, while remaining genuinely depictive: any depiction o f a
ball on a box is likely to show the ball in some particular l o c a t i o n D e p i c t i o n is, to this
extent, intrinsically indiscreet.
The idea o f discretion can be expressed as follows. For representation r and intended
information P:
P
Discretion = ---total information which r must convey to convey the information that P
That is, a representation is discreet to the extent that, in conveying information that P, it need
only convey the information that P. (O f course, much will depend here on how “ information”
is defined, and on the role played by context and the observer’s background knowledge; I
discuss these issues in detail in Chapter 3.) The distinction between description and depiction
can then be expressed thus: given a certain context, a well-formed description will tend to
have discretion o f close to 1. A well-formed depiction will typically never have discretion
close to 1.
An important general property o f depictions, by contrast, seems to be this: that the
information they represent is typically easy for the observer to process or assimilate. In many
cases, obtaining information from a depiction does not require a conscious process o f
inference; it is just seen, at a glance, in a way which is phenomenologically similar to how
one sees the colour o f one’s shoes, for example. The content o f a depiction can, moreover, be
different cultural backgrounds. Obtaining information thus does not seem, at this level at
least, to be heavily dependent on background knowledge; or specifically, on knowledge o f
language. Descriptions, by contrast, are in natural language; for them to convey information
requires an act o f linguistic interpretation. Descriptions cannot simply be viewed, one might
say; they must be read. The point here does not concern the degree o f effort expended by the
reasoner as such - one may obtain information from reading a description at a glance, without
conscious inference - though it will, I think, in general be true that a (well-formed) depiction
o f (positive, non-disjunctive) given information will require less effort to process than a
comparable description. Nor do I mean to suggest that one cannot also derive information
from depictions more slowly, or through an explicit process o f inference. Rather, the point
concerns the cognitive resources which are brought into play in considering the
representation. Descriptions seem to require symbolic interpretation, in the second “endowed
symbol” sense described above; their content cannot be grasped at all except in terms o f the
(endowed) values assigned to their constituent symbols, and this seems to require the exercise
o f higher level resources o f understanding. By contrast, depictions seem to be able to
represent at a cognitively lower level, in terms o f what I called “bare symbols” above; and
this seems principally to require the exercise o f perceptual resources. But o f course there may
also be a further level o f representation in a depiction, in which symbolical or allegorical
content is brought into play, and this will require a higher-level grasp o f endowed symbols in
the sense already mentioned.
Space does not permit a fuller justification o f this claim about cognitive resources. A more
fully-fledged account would discuss the psychological literature on levels o f visual
processing;^^ and, in epistemological terms, it would also explore the idea that the observer o f
a depiction has a general but defeasible entitlement (in the sense described by Burge 1993:
that is, an epistemic warrant which may not be understood by, or indeed even accessible to,
the observer) to derive certain information from it, and that this information is triggered by
perception, at the “bare symbols” level, o f resemblance relations between it and the depicted
object. M uch more needs to be said; but the effect o f this move would be to connect the
epistemology o f depiction more closely to current work on a priori knowledge, and on
testimony.^”
Our goal here, however, is not to give a general constitutive account o f diagrammatic
representation as such, but to differentiate the three representational types more clearly. We
can now be more precise about the status o f diagrams. Diagrams score highly on the scale o f
discretion, it seems, though not in general as highly as sentences. A well-drawn diagram need
not convey much if any extraneous information in order to convey the intended information
that P. In this regard the great variety and multiplicity o f types o f diagram may come to the
user’s aid, allowing him or her to select a different type rather than allow indiscretion to
occur; and the recognition that it is possible by such choices to avoid conveying extraneous
information itself suggests that users generally expect diagrams as a type to be discreet. On
the other hand, however, diagrams also score highly on the scale o f ease o f processing or
assimilability. A diagram may serve as well as a picture, indeed in some contexts perhaps
even better than a picture, at representing to an observer that there is a ball on the box.
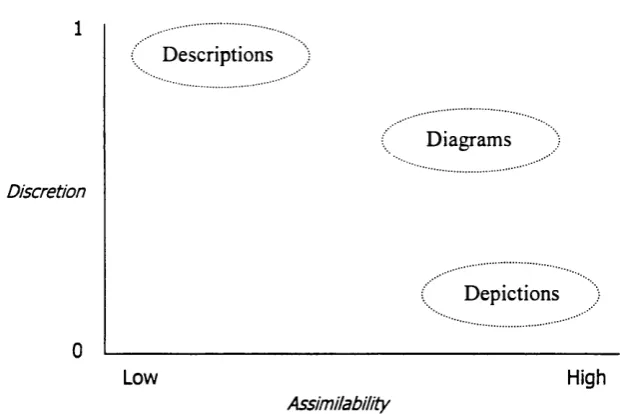
This gives a fairly clear sense in which diagrams are indeed an intermediary form, between
descriptions and depictions. Perhaps appropriately, this set o f relationships can be viewed
diagrammatically, as in fig. 2.2.1. (The circles are intended to indicate roughly where the
central cases o f each type fall; there will clearly be overlaps and borderline cases.)
Fig. 2.2.1
Discretion
Descriptions
Diagrams
Depictions
Low High
Assimilability
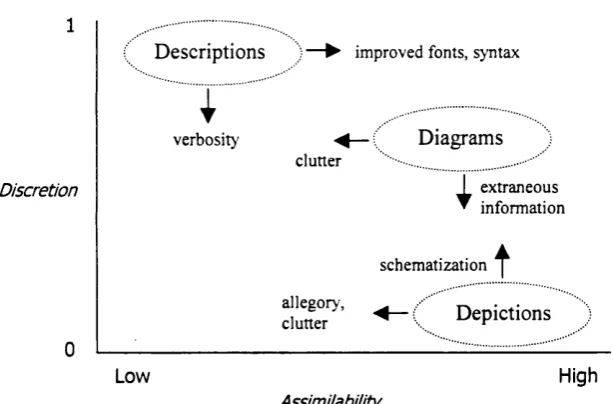
It is now possible to ask what the dynamic factors are which could affect the location o f a
particular type o f representation along the two axes.
• Descriptions would lose discretion by conveying unnecessaiy collateral information;
that is, through verbosity or periphrasis. They could increase their assimilability in
two ways: at the level o f form, perhaps through a change in font type, or through
replicating the shape o f their object, in a few rare cases;^’ at the level o f content,
perhaps through improved syntax, provided this did not affect the information
conveyed.
discussed, or by being cluttered (where “clutter” is defined as uninformative detail).
Decoration could in principle either increase or decrease assimilability.^^ Depictions
would gain discretion by becoming more schematic; that is, by omitting irrelevantly
informative detail.
• Diagrams would lose assimilability by being cluttered; and would lose discretion by
conveying irrelevant information.
These dynamic factors can also be represented, as follows:
Fig. 2.2.2
Discretion
Descriptions improved fonts, syntax
I
verbosity
clutter
extraneous information
allegory, clutter
Diagrams
r
schem atization ^< — ( Depictions
Low High
Assimilability
I want to suggest that this account can be used to analyse the concept o f perspicuousness.
What is generally meant by perspicuousness, or perspicuity? Something is perspicuous if it is
“easily understood” or “clearly expressed”, according to the OED. There is a visual metaphor
in the Latin root o f the word; that o f “ looking through” something to see something else, o f
easily discerning the information in a given representation. These senses are captured by the
analysis above: perspicuousness can be understood in terms o f the combination o f discretion
and assimilability. Both properties are needed: a representation that P which is discreet but
hard to assimilate by the observer will not be a perspicuous representation at all; a
representation which is assimilable but contains much irrelevant information will not be a
perspicuous representation that P.
W hat is considered perspicuous will o f course vary with context and between specific
individuals. In general, this analysis suggests that a perspicuous representation - whether it is
a description, a depiction or a diagram - does not convey more information than it requires to
make its point, so to speak, and it does so in the way most assimilable by the observer.
Conversely, a representation will be perspicuous if it avoids clutter, irrelevant information,
verbosity, or unnecessary symbolic or allegorical content. Thus it is possible to compare two
descriptions or two depictions on these criteria, and say o f one token o f a type that it is more
perspicuous than the other. But it is also possible to compare tokens o f different types, and to
say that token a o f type A is superior to token b o f type .6 as a perspicuous representation o f
information that P. In both cases, some general trade-off will be required between the two
criteria in order to make such judgements; but it does not seem problematic that people can
and do make such trade-offs in precisely these terms (o f clutter, irrelevance, verbosity etc.).
Thus, this analysis seems to correspond both to our normal intuitions and to our normal
linguistic practices.
2.3 Diagrams and Homomorphism
It would follow from this account that diagrams are, in general, a more perspicuous
representational type than descriptions or depictions. It also, however, highlights the relative
strengths o f the other two types. A good diagram is, in a sense, constrained by its
perspicuousness, which will be diminished by clutter or irrelevant information. On the other
hand, descriptions are often not expected to be easy to process; so they can be made as lush,
metaphorical, arcane or elliptical as the author wishes. Equally, depictions are not expected
to be discreet; so their creator can add extraneous elements or detail. Where the goal is not
the conveying o f information as such, but the conveying o f artistic or literary meaning, this
flexibility may be very valuable. And o f course the compositional nature o f linguistic
symbols gives descriptions unique scope to represent different types o f information.
Diagrams often have difficulty representing certain types o f information, as I have mentioned;
their flexibility comes in the scope they give the user to innovate and experiment, and to
choose new formats to represent intended information without destroying the broader context
in which information is to be conveyed.
The general value o f diagrams lies, as we have noted, in how they assist the process o f
reasoning. But it will not do merely to say they do so in virtue o f being perspicuous;
something also needs to be said about the general relation between the diagram and its range
or target (I use the latter words interchangeably henceforth), in virtue o f which the reasoner is
warranted in obtaining the intended information. I want to suggest here that differences in the
representation relations involved seem to be what underlie the differing claims on our
Consider again the position o f Bill and Jane, who have now decided to use a sketch-map o f
the local area to guide their friends. What is it about the sketch-map which entitles Bill and
Jane to feel sure that it reliably conveys the requisite information? A first response might
simply be: there is a resemblance between the diagram and the area. But the problem here is
this: what are we to understand by resemblance? If resemblance is taken to mean “similarity
o f appearance”, then this claim is false. There is little or no actual similarity o f appearance
between a sketch-map and the area which it represents (there is no danger, for example, o f
illusion; o f mistaking one for the other). In the case o f Feynman diagrams, which represent
interactions between subatomic particles, we may not be able to see how the target “appears” .
In the case o f a flow diagram showing phases o f work, the target may have no visual
appearance as such at all. If resemblance is not understood as similarity o f appearance,
however, it is hard to see what it could amount to, or what role it could play in a general
account o f diagrams. Many objects resemble each other in some respect, without conveying
information about them. A resemblance account may be possible for depictions, despite such
phenomena as caricatures, abstract pictures etc.; but it faces severe additional obstacles for
diagrams.
A better account, which preserves the core intuition that there is something in common
between the diagram and its range, would invoke the idea o f similarity or identity o f structure.
On this view, elements o f the diagram correspond (in some way to be specified) to elements
o f its range, and structural relations between the former correspond to structural relations
between the latter. In the case o f Bill and Jane’s map, the symbol o f the cross may
correspond to (and so be used to identify, by visual metonymy) the church, and the beer glass
the pub; and the distance between and orientation o f the two symbols may correspond to the
actual distance between and orientation o f the two buildings on the ground. It would then be
a mistake to locate the cross-symbol in a location on the map which does not correspond in
the requisite way to the actual location o f the church. Thus the structure o f the diagram is, in
this case, constrained by the structure o f its range.^^ To the extent that the diagram possesses
the requisite structural similarity or identity with its range, it can be used to convey
information about it. Note that this structural correspondence need not - and often will not -
extend to all the elements o f the range; the diagram may simply represent the relevant
elements. Thus a sketch map can be a diagram.
Can this overall account be extended to other type o f diagram? It would seem that it can. O f
course the conventions o f the diagram in question will also play a role, as they do in the case
o f sketch-maps; a background grasp o f these will be necessary for the viewer to derive the
correct information. Thus, if George knows the relevant conventions for pie charts and is
given a pie chart o f car production by the major auto manufacturers in 1997, provided the
requisite structural relationship exists between the range (the facts about car production) and
the relevant markings on the diagram, he will be able to derive the information that, say. Ford
sold more cars than Honda. Given certain background conventions, a Feynman diagram o f
two particles colliding will carry information that P provided the requisite structural relation
exists between the marks in the diagram and the range o f particles and their charges,
interactions etc. And so on.
This structural correspondence account can be more precisely formulated mathematically, in
terms o f a homomorphic or isomorphic relation between diagram and range. A
homomorphism is an order-preserving and injective (one-one) function or mapping between
two structured sets o f elements (in this case, the elements o f the diagram and the relevant
elements o f the range); whereas an isomorphism is order-preserving but bijective (in a one-
one correspondence). Within these constraints, there is clearly some latitude as to what are
defined as elements o f the diagram and o f the range, and as to what properties or relations
within or between the two are deemed to be preserved by the function. In the case o f
diagrams, adapting a definition advanced by Barwise and Hammer,^"* a homomorphic relation
can be defined as follows:
1. Elements o f a diagram A represent elements in a range D, with different types o f range-
element represented by different types o f diagram-element.
2. n is a function between A and D such that:
a) if R is a relevant relation between elements o f A, then there is a relevant relation S
between the elements o f D to which they are assigned by IT; and the converse is true;
b) if a relevant relation between elements o f A has some structural property (transitivity,
reflexivity, symmetry etc.), then the same property holds between elements o f D; and
the converse is true;
c) if an element d o f A o f some type T has a relevant property P, then TI(d) is an object
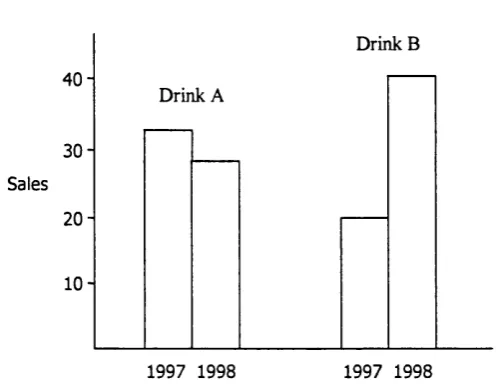
o f some type TI(T) with relevant property FI(P) on D; and the converse is true.
showing the sales o f two brands o f soft drink over two years.
Fig. 2.3.1
Sales 4 0
-30
2 0
-1 0
-Drink B
Drink A
1997 1998 1997 1998
What is the range here? It can be thought o f as comprising three types o f element - the drink,
the year, and the sales amount - in four ordered triples, o f the form <D,Y,S>. In effect, these
triples constitute four pieces o f information to be conveyed; how much each o f two products
sold in each o f two years. According to the definition above, then, for there to be the requisite
structural correspondence between diagram and range requires (condition 1) that elements of
the range be represented by elements o f the graph, and that different elements o f the range be
represented by different elements o f the graph. This condition is clearly satisfied: marks on
the X-axis represent years, marks on the Y-axis represent sales, and the labelled bars represent
the amount sold o f each drink in each year.
It should be fairly clear that conditions 2(a) and (b) are also satisfied. For example, in the
diagram the 1998 bar for drink A is lower than the 1997 bar; corresponding to this “lower
than” relation in the graph is a “lower than” relation between the relevant numbers in the
range. In the diagram, the relation between bar heights is asymmetric - if bar X is higher than
bar Y, then bar Y is not higher than bar X - and so is the relation between the relevant
numbers in the range.
Finally, imagine that the bar representing sales o f drink B in 1998 has the following property:
it is 20% above a line representing budgeted sales in the same year. Then, in virtue o f the
homomorphic relation the corresponding number in the range will ipso fa cto have the same
property with respect to another number (the budgeted number) in the range. That is,
condition 2(c) will be satisfied. And as the “relevance” restriction in the definition suggests.
it may be the case that not all the visual properties o f the diagram will be mapped by the
relation to the range; some properties (e.g. the colour o f the ink in the diagram) may be
irrelevant.
As this last point suggests, it may be that for some representations not all the above conditions
are in fact satisfied. Where they are not - as with distance relations in, say, the London
Underground map - the reasoner may go astray. To the extent they are, however, such
representations will be homomorphic or isomorphic in some relevant respect to their ranges,
and this structural similarity or identity can still make them valuable in reasoning. But this
fact does mean that some diagrams can be more homomorphic - more structure-preserving -
than others. Notice, moreover, that the range need not, often will not be, observable: in the
case o f a sketch map the homomorphism will include a correspondence between diagram
elements and observable, concrete objects; with Feynman diagrams it will include one
between diagram elements and partially or indirectly observable concrete particles; with Venn
diagrams it will include one between diagram elements and abstract objects (sets).
It is generally true o f diagrams that they are homomorphic or isomorphic to their ranges. This
is not a distinguishing feature as such, however, for it is generally true o f (figurative)
depictions that they are isomorphic to their ranges. Indeed, in rare cases descriptions can
have homomorphic properties; the temporal ordering o f sentences may correspond to the
succession o f events described, as Barwise and Hammer point out.^^ Descriptions, however,
are not generally homomorphic, whether the relevant elements be taken as either words or
sentences.
Homomorphism gives to diagrams and depictions some features which are valuable for
reasoning. One is this: it is possible to do part-whole reasoning quite easily using them, once
the representation relation is understood. Imagine a (normal sized, well-drawn) diagram or
depiction o f a family tree, compared to a (concise, well-worded) description o f the relation
between the family-members. Viewing the diagram or depiction allows the reasoner first to
identify a given relation - perhaps that o f second cousin - and then see o f any two members,
wherever they are located, whether they satisfy the relation. This information is likely to be
almost impossible for the reader o f the description to obtain at all, unless it is used to
compose a diagram, picture or mental image; or, unless a further set o f rules is specified to
capture the relation in question. Related to this is another feature: diagrams or depictions are
useful for solving problems with limited information. In general, a portion o f a diagram or
depiction is a representation o f a portion o f its object or range. If the reasoner can construct a
description, by contrast, may simply be a collection o f apparently unrelated words or
sentences.
2.4 Diagrams and Iconicitv
In terms o f being homo- or isomorphic, then, there is little to differentiate diagrams and
depictions. Both have this feature in common; that knowing that there is a structural relation
the reasoner can, simply by attending to the representation in hand, come to know information
about a range, including information that was not originally part o f the information needed to
construct the representation. That is, the reasoner may notice some new visual feature o f the
diagram or depiction, and know - in virtue o f the structural identity or similarity between the
two - that this represents some further fact about or property o f the range. Once the necessary
relationship has been established between representation and range, the range becomes, in a
sense, irrelevant to the process o f reasoning (though not, o f course, to its wider purpose).
Since in many cases the range is too large (as often with maps), or too small (as with
Feynman diagrams) to be observed, or is not observable as such at all (as with workflow
diagrams), this makes reasoning from the diagram or depiction very advantageous. And it is
notable that language often recognises this substitution o f representation for range, as with
arguments that begin “but the map says to go this way” etc.
This property is close to one which Peirce called iconicity, in the process o f reasoning
described above the representation acts as an icon o f the relevant features o f the range. The
idea o f iconicity is a complex one in Peirce’s thought, with deep roots in his general theory o f
signs, and lies outside this discussion. Peirce often describes it in terms o f a resemblance or
similarity o f character between a sign and its object. For reasons described above, the idea o f
resemblance is too vague to be o f service; but the analysis given above can be extended to
give a definition o f iconicity which is broadly compatible with Peirce’s view. Recall that by
the definition 2 given above FI is a homo- or isomorphic relation between A and D such that
for any relevant relation R between elements d], d] o f A there is a relevant relation S between
the elements S], S] o f D to which they are assigned by II; and the converse relation is also true.
That is,
1. d i R d ] S]Ss2.
If this is the case, and also:
2. it is possible to tell whether diRd] just by observing A;
then A is an icon o f D.
A representation will, then, be an icon o f its range if and only if the reasoner can tell just by
looking whether some relation or property holds o f its elements; and the corresponding
relation or property holds between elements o f the range. Note that some representations can
be more iconic than others; in some cases it will be easier to tell whether diRd] ju st by
looking. Thus, diagrams and depictions are almost always more iconic than descriptions;
where there is resemblance (similarity o f appearance) between representation and range a
diagram may be more iconic than a depiction, or vice versa; where there is no resemblance,
only diagrams will generally be able to serve as icons o f the range for purposes o f reasoning.
In using the phrases “just by observing” or “just by looking”, here and in later chapters, I
mean that the observer can grasp (or: is entitled to grasp) the information presented by the
representation without a conscious process o f inference. Often, this may simply require what
I have termed relatively low-level cognitive resources. O f course, higher-level resources may
also be involved; there may be, and often will be, endowed symbolism in an iconic
representation. But this endowed symbolism involves, I would argue, a fundamentally
different representation relation, one in which it is arbitrary - not given by any constraints of
structural similarity or resemblance - as to what content is attributed to what symbol. This
arbitrariness draws heavily on the observer’s background knowledge, but it is what gives
descriptions their scope and flexibility. By contrast, the flexibility o f diagrams is not an
intrinsic feature o f any particular diagrammatic system, for these will always be structurally
constrained (albeit in different ways); rather it comes in the scope to deploy different systems,
with different advantages and disadvantages, with the relative assurance that because the
representation relation preserves structure and draws less heavily on background knowledge,
the observer will derive the intended information.
It is now possible to give a fuller explanation o f why Bill and Jane should prefer the sketch
map in the example above. In the first place, it is discreet; unlike the depiction, it does not
contain irrelevant information. Secondly, however, it is iconic. The guest knows the relation
which the map bears to the range; and can then tell ju st by observing that diRd], and therefore