Article
1
MatchMR: Exploring the effects of scale and color
2
differences on users
’
perception in mixed reality
3
devices
4
Kwang-seong Shin1, Howon Kim2 and Dongsik Jo1,*
5
1 Department of Digital Contents Engineering, Wonkwang University; [email protected];
6
7
2 Creative Content Research Division, Electronics and Telecommunications Research Institute (ETRI);
8
9
* Correspondence: [email protected]; Tel.: +82-63-850-7271
10
11
Abstract: With continued technological innovation in the fields of mixed reality (MR),
12
wearable-type MR devices, such as helmets, have been released and are frequently used in various
13
fields, such as entertainment, training, and education. However, because each product has different
14
parts and specifications in terms of the design and manufacturing process, users feel that the
15
virtual objects overlaying real environments in MR are visualized differently depending on the
16
scale and color used by the MR device. In this paper, we compare the effect of scale and color
17
parameters on users’ perception in using different types of MR devices to improve MR experience.
18
We conducted two experiments (scale and color), and our experimental study showed that the
19
subjects who participated in the scale perception experiment clearly tended to underestimate
20
virtual objects, compared with real objects, and overestimate color in MR environments.
21
Keywords: Mixed-reality; perception; Scale; Color; HMD
22
23
1. Introduction
24
Recently, mixed reality (MR) has received significant attention as a key technology for
25
entertainment, training, and education, because it has the potential to make real spaces smarter and
26
more interactive [1, 2]. MR helps people to use augmented virtual objects by spatially registering
27
useful information, and it offers various situations in which users can visualize and interact to
28
improve their performance in completing actual tasks [3]. Additionally, MR devices (e.g., a
29
helmet-type head-mounted display) for visualization are a major class of new instruments in
30
scientific research and engineering applications. Nonetheless, MR devices are heavy, and their
31
viewing angle is relatively narrow, compared with the human viewing angle [4]. Moreover, because
32
each MR device has a different design configuration and specification in terms of its parts, people
33
often differently perceive the same virtual object, depending on the MR device used [5].
34
Therefore, it is necessary to resolve visual differences between different MR devices to obtain a
35
mixing consistency, i.e., a perceived coherence between virtual and real objects. For example,
36
imagine a situation where a user is wearing a helmet-type MR device, when the user sees a
37
computer-generated virtual cube that looks like a real cube, he/she recognizes the scale and color of
38
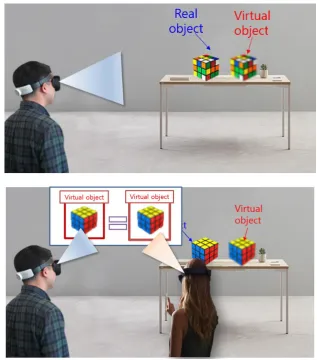
that cube differently, depending on the MR device used (See Fig. 1). Thus, consistency between
39
different MR devices in the perceived scale and color of virtual objects will need to be established.
40
41
42
43
44
45
46
Figure 1. A user’s perception in an MR environment. When comparing a virtual object with a real
47
object in an MR environment, the user must be able to perceive the scale and color using different
48
MR devices (top). Additionally, the user should be able to recognize the same size and color,
49
irrespective of the MR device worn (bottom). In our case, we assumed that people wearing different
50
MR devices had different perceptions.
51
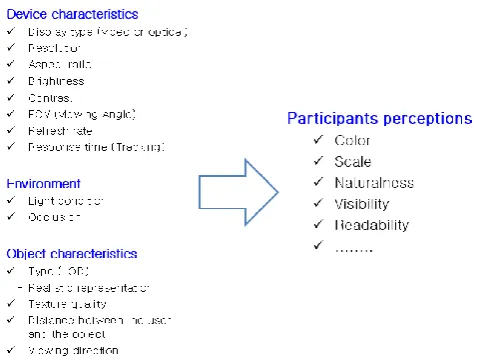
Fig 2. shows the parameters that affect users’ perception in a typical MR environment. To begin
52
with, it should be noted that we referred to related research works to define which factors would
53
affect users’ perception [6–8]. In our paper, we divided the parameters that affect users’ perception,
54
such as color, scale, naturalness, visibility, and readability, in an MR environment into three groups:
55
device characteristics, the environment, and object characteristics. Firstly, the device characteristics
56
were related to issues concerning different specifications (e.g., the field of view and brightness).
57
Secondly, the environment parameters, such as the light condition, refers to elements affecting the
58
MR environment in real spaces. Lastly, the object characteristics, shown in Fig.2, were related to how
59
a computer-generated virtual object is represented, such as its texture quality and viewing setting,
60
which is presented to the user looking at the virtual object.
61
Using these parameters, our paper focuses on the device characteristics in terms of the display
62
type (e.g., video or optical see-through head-mounted display) to measure users’ perception (e.g.,
63
scale and color), and the remaining parameters were used as control variables in our evaluation. It
64
should be noted that the video see-through head-mounted display (HMD) is based on stereoscopic
65
visualization, which allows a dual-webcam module to be attached to an immersive HMD display
66
and have two image sources, i.e., the real world and the computer-generated world. On the other
67
hand, the optical see-through HMD is a device that has the capability of mixing virtual objects and
68
allowing the user to see through them, and it has only one image source, i.e., the
69
71
72
73
Figure 2. Parameters affecting users’ perception: Input elements that affect users’ perception (left);
74
examples of users’ perception of MR environments (right).
75
Thus, this paper proposes a novel method for evaluating users’ perception of virtual objects in
76
using heterogeneous MR devices to improve MR experience. Specifically, we explore the correlation
77
in visual perception between real and virtual objects in using mixed reality devices. To find the
78
relationship between two different objects in users’ perception, we ran comparative experiments to
79
assess users’ perception in terms of, for example, the effects of the scale and color differences in
80
using various MR devices. This study resulted in the creation of what is called the MatchMR, which
81
allows different MR devices to induce the same user experience (in terms of, e.g., scale and color).
82
The remainder of our paper is organized as follows: Section 2 discusses works related to our
83
paper. Section 3 provides details of the proposed experiment, involving scale perception and
84
different MR devices, and discusses the results. Section 4 provides an experimental evaluation of
85
color perception and the main findings. Finally, in Section 5, we summarize our results and
86
contributions and conclude with directions for future research.
87
88
2. Related Works
89
We outline three areas of research that are directly related to the main theme of this work (i.e.,
90
MR devices, users’ perception in VR/AR/MR environments, and MR consistency).
91
MR devices. A mixed reality (MR) device is a visualization platform that merges real and virtual
92
worlds. Virtual objects overlay a real environment in MR and thus give users additional information
93
[10]. Most previous works have mainly used smart phones to provide images that synthesize real
94
and virtual environments, but they did not consider the presentation of synthesized images directly
95
to the human eye. More recently, MR devices with a helmet-type HMD that synthesizes spatially
96
registered virtual objects overlaying a user’s view have been introduced. As already mentioned, MR
97
devices are mainly divided into optical and video see-through HMDs, depending on whether actual
98
images are viewed directly by the user or via a video input. We are interested in how the scale and
99
color of different types of HMDs affect users’ perception. No comprehensive work has been done in
100
this connection.
101
102
Users’ perception in VR/AR/MR environments. Given the availability of immersive environments
103
they were real [11]. Therefore, many researchers have considered users’ perception in using these
105
technologies in order to evaluate the sense of presence and emotional response that they experience
106
when interacting with virtual objects in VR/AR/MR environments [12]. There have been a few
107
attempts to evaluate users’ perception, which were conducted using questionnaires and by
108
monitoring physiological signals, such as the heart rate and skin conductance [13, 14]. As a result of
109
a representative research, Diaz et al. proposed depth perception in augmented reality as a function
110
of the virtual object design. In their studies, they found that participants underestimated the depth
111
and rendering of virtual objects, which influenced their perception of the objects’ spatial position
112
[15]. Additionally, Baumeister et al. investigated and showed results concerning the cognitive load
113
imposed on users by MR devices, comparing different types of augmented reality displays (e.g., a
114
projection-based spatial augmented reality, optical see-through HMD, and video see-through HMD).
115
The results showed that spatial augmented reality helped to reduce cognitive load [16]. Our work
116
was designed to further the research of two pioneering works by proposing an object-level
117
comparison in terms of scale and color differences, comparing actual and virtual objects in relation
118
to two forms of HMD.
119
120
MR consistency. Another related trend is the use of illumination and rendering techniques to make
121
the appearance of virtual objects consistent and thus achieve a coherent AR [17]. Rohmer et al.
122
proposed a photorealistic and high-quality AR framework, with compensated differential rendering
123
and shadows, to illuminate virtual objects and make them consistent with real objects [18].
124
Additionally, Rhee et al. presented a novel immersive system that provided composite optimized 3D
125
virtual objects with a lighting source, which allowed them to create a live 360-video and thus
126
illuminate the virtual objects [19]. For our research, some of these concepts were borrowed, but they
127
were modified for the purposes of our research on how to compensate for users’ perception.
128
3. Experiment 1: Scale Perception
129
So far, we have described our motivation for investigating the effects of scale and color conflicts
130
on users’ perception in using heterogeneous MR devices and related works on MR devices, as well
131
as users’ perception in VR/AR/MR environments, in terms of MR consistency. In this section, we
132
present our experiments and the results concerning the differences in users’ perception in using
133
different MR devices that are caused by the degree of scale (e.g., optical see-through HMD vs. video
134
see-through HMD) in the defined experiment below.
135
3.1. Overview of Experimental Design
136
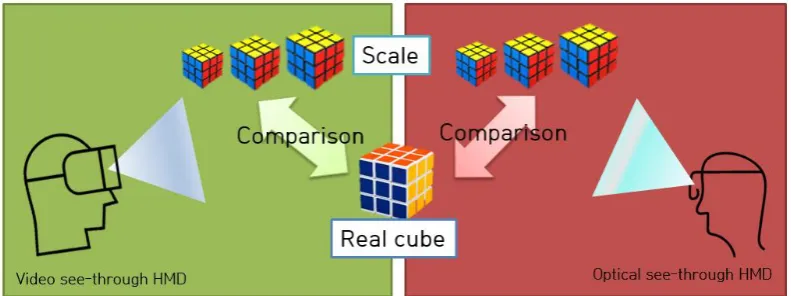
In the experiment, we compared a video see-through HMD and an optical see-through HMD,
137
as MR devices, in terms of users’ perception (e.g., their sense of scale in relation to virtual objects)
138
(See Fig.3). In the experiment, to assess users’ scale perception, participants were permitted to adjust
139
the size of a virtual cubic puzzle and select the same size as the actual puzzle. Then, we compared
140
different types of HMD in relation to users’ scale perception. It should be noted that we assumed
141
that users have different senses of scale, depending on the HMD used. Fig.4 shows the actual cubic
142
puzzle used in the scale comparison experiment. It is 5.5 cm in size and has different colors on each
143
side, with 6 colors in total.
144
146
Figure 3. Scale perception in comparing a real cubic puzzle with a virtual one using a video
147
see-through HMD and an optical see-through HMD. In the experiment, two cubes (each with a real
148
and a virtual cube) appeared at the same time for comparison.
149
150
151
Figure 4. Real cubic puzzle provided as a basis for the scale comparison. It is 5.5 cm in size and has
152
different colors on each side.
153
154
Figure 5. Experimental design. A participant compared the size of the virtual cube with the actual
155
cube in the experiment.
156
Fig. 5 shows our system configuration for the experiment. A participant in our experiment was
157
seated in a chair in front of a desk, then the subject wore a MR head-mounted display (HMD) to
158
The main factor was the scale value of the virtual cube, and two test conditions (video vs.
160
optical) were employed. We also included the variable of the distance between the participant and
161
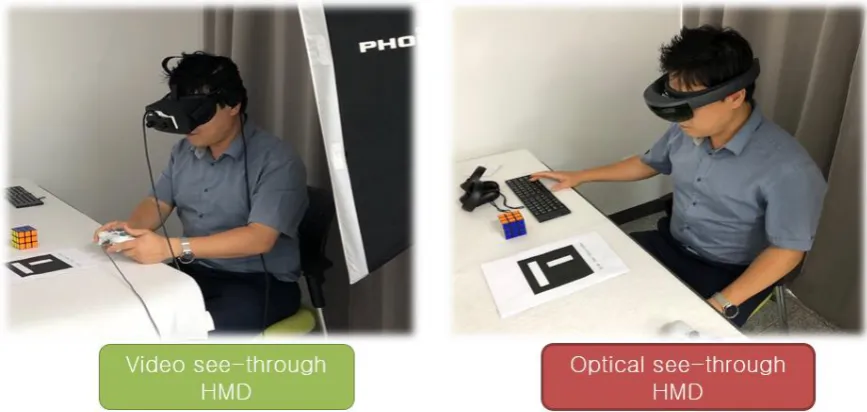
the cube. Fig. 6 shows the two test conditions, including the video and optical see-through HMD. As
162
already mentioned, the video see-through HMD has a dual-webcam module attached, which allows
163
the user to visualize the virtual cube, and the optical see-through HMD, which allowed the user to
164
integrate the virtual cube into reality, since the device is semi-transparent. In our experiment, we
165
used a Microsoft HoloLens, for the optical see-through HMD, and an Oculus Rift and OVRVision
166
stereo camera set for the video see-through HMD (See Fig.6).
167
168
169
Figure 6. Video see-through HMD, with a dual-webcam module attached, which allows the user to
170
visualize the virtual cube (left), and the optical see-through HMD, which allows the user to integrate
171
the virtual cube into reality, since the device is semi-transparent in our experiment (right).
172
Participants could see the virtual cubes placed on the fiducial MR marker.
173
3.2. Experimental setup for scale perception
174
As mentioned earlier in the overview of the experimental design, in order to evaluate users’
175
scale perception in using heterogeneous MR devices, we compared the scale difference between two
176
HMDs (video vs. optical see-through HMDs). To set up this experiment, after geometrically
177
calibrating the FOV (Field of view) and distortion of the HMD, we installed an experimental
178
environment that consisted of the HMD, a real object (e.g., an actual cube), and a fiducial MR marker
179
for the registration of the virtual cube. As for the test conditions, a 3D virtual cube, with the same
180
shape as the real cube, was constructed using Unity3D and appeared at the same time in a given MR
181
183
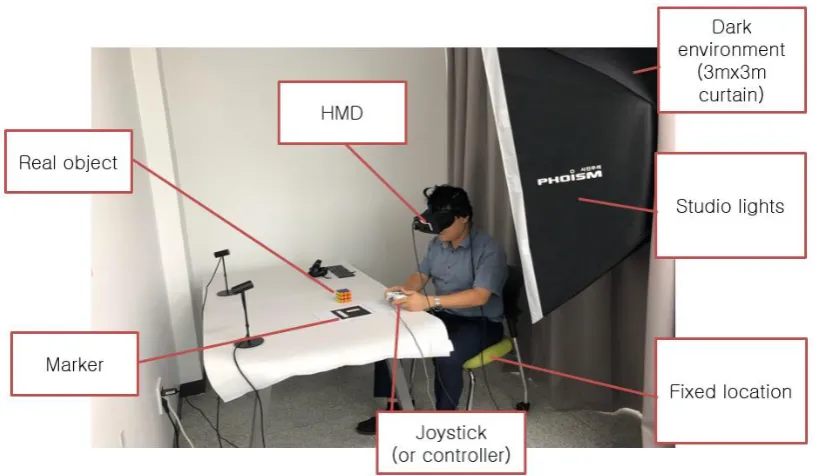
Figure 7. System setup in our experiment. The participant wearing the HMD sits in a chair and
184
compares the size of the actual cube with that of the virtual one, and the participant can adjust the
185
size of the virtual cube using a joystick (or controller).
186
187
Figure 8. Experimental task of adjusting the scale parameter of the virtual cube in comparing it with
188
the actual cube. In the experiment, the subject was asked to match the size of the actual cube. In the
189
first frame, the virtual cube was presented as large (left). Participants were able to adjust the size
190
with a joystick.
191
3.3. Experimental Task and Procedure
192
The experiment was carried out with 60 paid subjects, who were divided into two groups.
193
Thirty subjects participated in the experiment under each of the two conditions, with a
194
between-subject measurement. To assess the sense of scale, as an indicator of users’ perception, the
195
experiment was designed with two factors (i.e., the heterogeneous MR devices and distance between
196
the object and the participant). We measured how participants perceived the scale of the virtual cube
197
compared with that of the actual cube in the MR environment. Thus, during the experiment, the
198
subject was asked to control and adjust the size of the virtual cube and try to match the size of the
199
actual cube using a joystick (or controller) (See Fig.8).
200
After the experiment, the subjects were asked to submit their answers to a list of questions
201
The question categories are as follows: “What were your criteria regarding size? (The total size of the
203
real cube, the partial size of the real cube or the size of the fiducial marker)”.
204
205
3.4. Results and Discussions
206
Before the experiment, we hypothesized that both the video and optical see-through HMD were
207
assumed to have different scales, depending on their distance from polynomial regression forms.
208
One-way ANOVA analysis was conducted for the three experimental test conditions, and the use of
209
the video-based MR device (video see-through HMD, p-value = 0.1265, p > 0.05) and the
210
optical-based MR device (optical see-through HMD, p-value = 0.3195, p > 0.05) was not affected by
211
the distance factor (i.e., 10 cm, 40 cm, and 70 cm) between the participant and the virtual object.
212
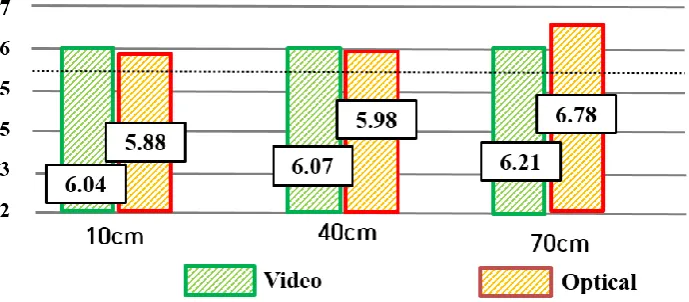
However, in both HMD situations, we confirmed the result that virtual objects are
213
underestimated, compared with actual objects. For example, people thought 6.04 cm was equal to
214
the real cube, which was 5.5 cm (see the result of 10 cm, when wearing the video see-through HMD,
215
in Fig. 9). Thus, as shown in previous studies, we found that people tend to perceive the virtual
216
object as small. In previous research works, people tended to underestimate the virtual space [15].
217
218
219
Figure 9. Results regarding scale perception. The subjects underestimated the virtual cube, compared
220
to the real cube (5.5 cm), in using two MR devices (video and optical). Statistically significant
221
differences between all distance conditions were not found (p > 0.05).
222
223
4. Experiment 2: Color Perception
224
In the second experiment, we investigated users’ color perception in using different MR devices.
225
Thus, we present the experiment and the result regarding users’ perception of the degree of color in
226
the defined experiment, shown below.
227
228
4.1. Overview of the Experimental Design
229
The experiment regarding color perception was similar to the scale evaluation. We compared
230
the video see-through HMD and the optical see-through HMD in relation to users’ perception in
231
using different types of HMDs (e.g., their sense of color in relation to virtual objects) (See Fig.10). In
232
the experiment, participants were asked to select the color that appeared to be most similar to that of
233
the actual cube among a number of virtual cubes with different colors. We decided to carry out the
234
experiment using the method of allowing users to choose similar colors, because adjusting for
235
matching, as in the scale experiment, was too time-consuming. The real cube with different colors on
236
the 6 sides, as shown in Fig. 4, was used in the experiment.
237
The factor was the color value of the virtual cube under two test conditions (video vs. optical),
238
240
241
Figure 10. We investigated users’ color perception in comparing a real cubic puzzle and a virtual one
242
using the video see-through and the optical see-through HMD.
243
244
Figure 11. Experimental task of selecting a color parameter for the virtual cube, compared to the
245
actual cube. In the experiment, the subject was asked to match the color of the actual cube.
246
4.2. Experimental setup for color perception
247
Unlike in the scale experiment, in the color experiment, we installed a curtain and two studio
248
lights to ensure that the real and virtual environments had the same light conditions (See Fig.7). It
249
should be noted that it is important that, when calculating the colors of the virtual object, ambient
250
lighting is considered. Thus, we applied the same shadow to our virtual object as the real-life
251
shadow using the same light conditions. For example, the shadow on the virtual cube was rendered
252
the same as the shadow on the actual cube. Fig. 12 shows the light condition and the simulated
253
shadow in the virtual environment. The shadow matched the actual shadow, which was the
254
control variable. To measure the lighting condition of the real environment, we used a color meter
255
and a light sensor module.
256
258
Figure 12. Light condition and the shadow in the virtual environment. The intensity of the virtual
259
environment was set to be equal to the real space. The left figure shows a situation in which one of
260
the studio lights is turned on, and the right figure shows a situation in which two lights are turned
261
on.
262
Fig.13 shows the color values for the candidates in the experiment. Because the participants
263
using the optical see-through and the video see-through HMD experienced different intensity values,
264
we used the HSL (Hue, Saturation, Lightness) color model to set candidates (See Fig.13). Then, we
265
selected 7 candidates in the color vector at a given intensity, depending on the HMD used (See
266
Fig.13). Table 1 shows 7 color candidates, selected for each RGB (with a total of 21 colors), in the
267
color experiment.
268
269
270
271
Figure 13. Experimental setup for selecting color values. In the experiment, we used the HSL color
272
Table 1. Candidates for color perception. Participants were asked to select a color for the virtual cube
274
that appeared to be the most similar color to the actual cube among color candidates.
275
Red Green Blue
Level R G B R G B R G B
1 162 43 51 27 100 78 38 50 121
2 171 45 53 28 105 82 40 52 128
3 180 47 55 29 110 86 42 54 135
4 189 49 57 30 115 90 44 56 142
5 198 51 59 31 120 94 146 58 149
6 207 53 61 32 125 98 48 60 156
7 216 55 63 33 130 102 50 62 163
276
4.3. Experimental Task and Procedure
277
To assess users’ perception in terms of color difference in using heterogeneous MR devices, we
278
adapt the method used in the scale perception experiment. In the case of our scale perception, we
279
measured how the participants perceived the scale of the virtual cube, compared with the actual
280
cube, in the MR environment. The task in color perception was similar. Additionally, the experiment
281
was conducted with 60 paid subjects, divided into two groups, with a between-subject measurement,
282
as in the scale experiment.
283
During the experiment, participants tried to match the virtual cube and the actual cube in terms
284
of color. The rest was performed in the same manner as the scale experiment.
285
286
4.4. Results and Discussions
287
Before the experiment, as in the scale perception, we hypothesized that both the video and
288
optical see-through HMDs induce different color perceptions. The results showed that the
289
experimental test conditions for the video-based MR device and the optical based MR device did not
290
have a major effect on users’ color perception of the virtual object. However, we confirmed the result
291
that virtual objects are overestimated, compared with actual objects. For example, people thought
292
red 211 of the virtual cube was equal to red 189 of the real cube (see the result of red, when wearing
293
the video see-through HMD, in Fig. 14).
294
295
296
Figure 14. Results regarding color perception. The subjects overestimated color in using two MR
297
devices (video and optical).
298
5. Conclusions and Future Works
300
In this paper, we presented the effects of scale and color perception in using heterogamous MR
301
devices (optical vs. video see-through HMD) to improve MR experience and the design of future MR
302
systems. We conducted two experiments (scale and color). The main result of our experiments was
303
that participants tend to underestimate virtual objects in terms of scale, whereas our study found
304
that subjects overestimated virtual objects in the MR environment in terms of color. From these
305
findings, we found that if we adjust the size and color of a virtual object according to the
306
characteristics of the HMD, people will be able to recognize the same virtual object, irrespective of
307
the MR HMD used.
308
For future research, there are still many aspects of MatchMR that need improvement in terms of
309
its practical applicability and perceptual factors. Specifically, it is necessary to study the chromatic
310
characterization of the mixed reality system, which determines the color transformation between the
311
device-dependent color space, such as RGB, and the device-independent color space, such as
312
CIEXYZ or CIE Lab, and the differences in color gamut and dynamic range between different
313
devices. Additionally, we will continue to explore various MR devices, including smartphones, in
314
order to make them usable in the real world. We also plan to further extend our experiments using
315
various parameters that affect users’ perception, as shown in Fig. 2.
316
Author Contributions: Kwang-seong Shin performed the prototype implementation and usability experiments.
317
Howon Kim designed the study in terms of conceptualizing and performed the analysis of the results, and
318
Dongsik Jo analyzed the data and contributed to the writing of the paper.
319
Funding: This research is supported by the Ministry of Culture, Sports, and Tourism (MCST) and Korea
320
Content Agency (KOCCA) in the Culture Technology (CT) Research & Development Program 2018.
321
Acknowledgments: We express sincere gratitude to the users who participated in the experiments. We
322
especially thank JuHwan Kim, Donggeun Lee, Soobin Oh, and HyunSoo Kim for their efforts in managing the
323
experimental assessment of the participants’ perception. We also thank the reviewers for their valuable
324
contributions.
325
Conflicts of Interest: The authors declare no conflicts of interest.
326
References
327
1. Jo, D.; Kim, K.-H.; Kim, G. J. Spacetime: adaptive control of the teleported avatar for improved AR
328
tele-conference experience, Computer Animation and Virtual Worlds, 26(3-4), 259-269, 2015.
329
2. Xue, H.; Sharma, P.; Wild, F. User satisfaction in augmented reality-based training using Microsoft
330
Hololens, MDPI Computers, 8(9), 2019.
331
3. Muller, L.; Aslan, I.; Kruben, L. GuideMe: a mobile augmented reality system to display user manuals for
332
home appliances, In Proc. Advances in Computer Entertainment, 152-162, 2013.
333
4. Maimone, A.; Yang, X.; Dierk, N.; State, A.; Dou, M.; Fuchs H. General-purpose telepresence with
334
head-worn optical see-through displays and projector-based lighting, In Proc. IEEE Virtual Reality, 23-26,
335
2013.
336
5. Wilson, A.; Hua, H. Design and prototype of an augmented reality display with per-pixel mutual
337
occlusion capability, Optics Express, 25(24), 30539-30549, 2017.
338
6. Albarelli, A.; Colentano, A.; Cosmo, L.; Marchi, R. On the inter-play between data overlay and real-world
339
context using see-through displays, In Proc. Of the 11th Biannual Conference on Italian SIGCHI Chapter, 58-65,
340
2015.
341
7. Debernardis, S.; Fiorention, M.; Gattullo, M.; Monno, G.; Uva, A. E. Text readability in head-worn displays:
342
color and style optimization in video versus optical see-through devices, IEEE Transactions on Visualization
343
and Computer Graphics, 20(1), 125-139, 2014.
344
8. Draelos, M.; Keller, B.; Viehland, C.; C.-Zevallos, O. M.; Kuo, A.; Izatt, J. Real-time visualization and
345
interaction with static and live optical coherence tomography volumes in immersive virtual reality,
346
Biomedical Optics Express, 9(6), 2825-2843, 2018.
347
9. Rolland, J. P.; Fuchs, H. Optical versus video see-through head-mounted displays in medical visualization,
348
10. Jang, C.; Lee S.; Lee, B. Mixed reality near-eye display with focus cue, In Imaging and Applied Optics, OSA
350
Technical Digest, 2018.
351
11. Wang, Y.; Cheng, D.; Xu, C. Freeform optics for virtual and augmented reality, In Optical Design and
352
Fabrication 2017 (Freeform, IODC, OFT), OSA Technical Digest (online).
353
12. Kim, K.; Schubert, R.; Welch, G. Exploring the impact of environmental effects on social presence with a
354
virtual human, In Intelligent Virtual Agents (IVA), 470–474, 2016.
355
13. Balenson, J.-N.; Blascovich, J.; Beall, A.-C.; Loomis, J. M. Interpersonal distance in immersive virtual
356
environments, Personality and Social Psychology Bulletin, 29(7), 819-833, 2003.
357
14. Volante, M.; Babu, S.-V.; Chaturvedi, H.; Newsome, N.; Ebrahimi, E.; Roy, T.; Daily, S.-B.; Fasolino,T.
358
Effects of virtual human appearance fidelity on emotion contagion in affective inter-personal simulations,
359
IEEE Transactions on Visualization and Computer Graphics (TVCG), 22(4), 1326-1335, 2016.
360
15. Diaz, C.; Walker, M.; Szafir, D. A.; Szafir, D. Designing for depth perceptions in augmented reality, In Proc.
361
of IEEE International Symposium on Mixed and Augmented Reality (ISMAR), 111-122, 2017.
362
16. Baumeister, J.; Ssin, S. Y.; Elsayed, N. A. E.; Dorrian, J.; Webb, D. P.; Walsh, J. P.; Simon, T. M.; Irlitti, A.;
363
Smith, R. T.; Kohler, M.; Thomas, B. H. Cognitive cost of using augmented reality displays, IEEE
364
Transactions on Visualization and Computer Graphics (TVCG), 23(11), 2378-2388, 2017.
365
17. Juan, M.-C.; Garcia, Inmaculada; Molla, R.; Lopez, R. Users’ perceptions using low-end and high-end
366
mobile-rendered HMDs: A comparative study, MDPI Computers, 7(15), 2018.
367
18. Rohmer, K.; Jendersie, J.; Grosch, T. Natural environment illumination: coherent interactive augmented
368
reality for mobile and non-mobile devices, IEEE Transactions on Visualization and Computer Graphics (TVCG)
369
23(11), 2474-2484, 2017.
370
19. Rhee, T.; Petikam, L.; Allen, B.; Chalmers, A. MR360: Mixed reality rendering for 360o panoramic videos,