University of South Carolina
Scholar Commons
Theses and Dissertations
2017
Analysis of Food Exposures in Foodborne Disease
Outbreaks
Alecia T. Alianell University of South Carolina
Follow this and additional works at:https://scholarcommons.sc.edu/etd
Part of theEpidemiology Commons
This Open Access Dissertation is brought to you by Scholar Commons. It has been accepted for inclusion in Theses and Dissertations by an authorized administrator of Scholar Commons. For more information, please [email protected].
Recommended Citation
Alianell, A. T.(2017).Analysis of Food Exposures in Foodborne Disease Outbreaks.(Doctoral dissertation). Retrieved from
Analysis of Food Exposures in Foodborne Disease Outbreaks
by
Alecia T. Alianell
Bachelor of Science
University of Southern California, 2006
Master of Public Health Brown University, 2008
Submitted in Partial Fulfillment of the Requirements
For the Degree of Doctor of Philosophy in
Epidemiology
The Norman J. Arnold School of Public Health
University of South Carolina
2017
Accepted by:
Anwar Merchant, Major Professor
Eric Brenner, Committee Member
Alexander McLain, Committee Member
Dana Giurgiutiu, Committee Member
DEDICATION
This is dedicated to my parents, Dr. Gary Alianell and Michele Alianell, my
ACKNOWLEDGEMENTS
I would like to acknowledge my dissertation committee chair, Dr. Anwar Merchant,
for his guidance and support as well as passing along his experience in epidemiology,
nutrition, and foodborne illness research. I would also like to acknowledge Dr. Alexander
McLain for all of his knowledge and expertise in the field of biostatistics, Dr. Eric Brenner
for imparting his experience in epidemiology and infectious diseases, and Dr. Dana
Giurgiutiu for conveying her experience in acute disease epidemiology. I would also like
ABSTRACT
Foodborne illness remains a serious public health problem in the United States in
general as well as South Carolina in particular. Obtaining good food ingestion histories as
well as possible risky environmental exposures is one of the earliest, most important tasks
to complete in any foodborne outbreak investigations. Because time is of the essence in
investigations, we have evaluated a rarely used biostatistical method, Random Forests, to
data obtained from DHEC. Random Forests has the potential to facilitate more rapid
identification of foods or environmental exposures that may be associated with outbreaks.
We also examined previous cases of salmonellosis using two different definitions (state
and FDA) of what constitutes a foodborne outbreak using logistic regression with a Poisson
distribution. Dietary patterns were similarly evaluated, as they are associated with mortality
from all causes. We aimed to characterize the nutrition and dietary intake of South Carolina
residents and see what foods eaten may be associated with foodborne outbreaks. In
summary, we have used Random Forests to analyze data that are routinely collected during
foodborne outbreak investigations. This new application of Random Forests can make
identification of foods responsible outbreaks more efficient. This information will address
the challenges of a rural southern state with a high obesity rate by using a representative
sample that contains geographic and socio-demographic diversity and using said
information to help affect change in the programs available. The results of this study can
TABLE OF CONTENTS
DEDICATION ... iii
ACKNOWLEDGEMENTS ... iv
ABSTRACT ...v
LIST OF TABLES ...x
LIST OF FIGURES ... xii
LIST OF ABBREVIATIONS ... xiii
CHAPTER 1INTRODUCTION ...1
1.1BACKGROUND ...1
1.2 SPECIFIC AIMS ...3
1.3SIGNIFICANCE ...4
CHAPTER 2LITERATURE REVIEW ...6
2.1WHAT IS FOODBORNE ILLNESS? ...6
2.2MONITORING SYSTEMS ...9
2.3 EXAMPLES OF SALMONELLAOUTBREAKS IN THE US ...11
2.4RANDOM FORESTS ...16
2.5WORKS CITED ...18
CHAPTER 3METHODS ...23
3.1STUDY DESIGN ...23
3.2STUDY POPULATION ...26
3.4SAMPLE SIZE ...34
3.5PROTECTION MEASURES ...35
3.6STRENGTHS AND LIMITATIONS ...36
3.7SUMMARY ...40
3.8WORKS CITED ...42
CHAPTER 4USE OF RANDOM FORESTS TO ESTIMATE FOOD AND ENVIRONMENTAL CAUSES OF SALMONELLA OUTBREAKS IN SOUTH CAROLINA ...43
4.1 ABSTRACT ...44
4.2INTRODUCTION ...44
4.3METHODS ...47
4.4RESULTS ...52
4.5DISCUSSION ...53
4.6CONCLUSION ...56
4.7WORKS CITED ...56
4.8TABLES ...59
4.9FIGURES ...67
CHAPTER 5EVALUATION OF FOOD CAUSES OF SALMONELLA OUTBREAKS IN SOUTH CAROLINA ...70
5.1ABSTRACT ...71
5.2INTRODUCTION ...71
5.3METHODS ...74
5.4RESULTS ...81
5.5DISCUSSION ...83
5.6CONCLUSION ...85
5.8TABLES ...88
CHAPTER 6DIETARY INTAKE AND FOOD CAUSES OF FOODBORNE ILLNESS OF SOUTH CAROLINIANS –EVALUATION OF THE SOUTH CAROLINA DEPARTMENT OF HEALTH AND ENVIRONMENTAL CONTROL FOOD EXPOSURES SURVEY ...95
6.1ABSTRACT ...96
6.2INTRODUCTION ...96
6.3METHODS ...99
6.4RESULTS ...109
6.5DISCUSSION ...112
6.6CONCLUSION ...115
6.7WORKS CITED ...116
6.8TABLES ...119
CHAPTER 7CONCLUSION ...128
7.1CONCLUSION ...128
7.2WORKS CITED ...131
APPENDIX A–PROTECTION OF HUMAN SUBJECTS ...132
APPENDIX B–DHECHYPOTHESIS-GENERATING QUESTIONNAIRE FOR CHAPTERS 4 AND 5...135
APPENDIX C–FOOD EXPOSURES SURVEY QUESTIONNAIRE FOR CHAPTER 6 ...148
APPENDIX DAGUIDE TO RANDOM FORESTS ...172
D.1WHAT ARE RANDOM FORESTS? ...172
D.2HOW DO ENSEMBLE MODELS WORK? ...172
D.3ADDING RANDOMNESS TO THE MODELS ...173
D.4VARIABLE IMPORTANCE ...175
D.6CONCLUSION ...176
LIST OF TABLES
TABLE 3.1SUMMARY OF DATASETS USED ...25
TABLE 3.2SUMMARY OF OUTBREAK DEFINITIONS USED ...25
TABLE 4.1STUDY POPULATION CHARACTERISTICS OF THE 3OUTBREAKS ...59
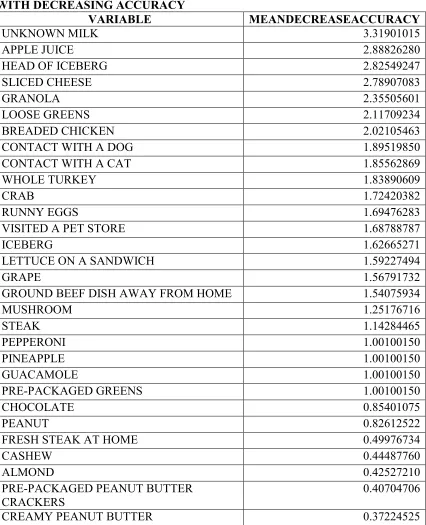
TABLE 4.2VARIABLE IMPORTANCE FOR THE MAY 2015OUTBREAK WITH DECREASING ACCURACY ...60
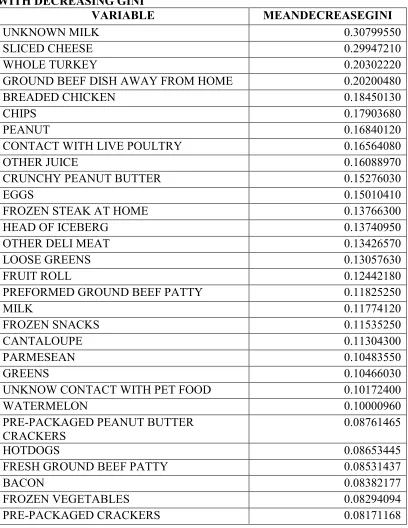
TABLE 4.3VARIABLE IMPORTANCE FOR THE MAY 2015OUTBREAK WITH DECREASING GINI ...61
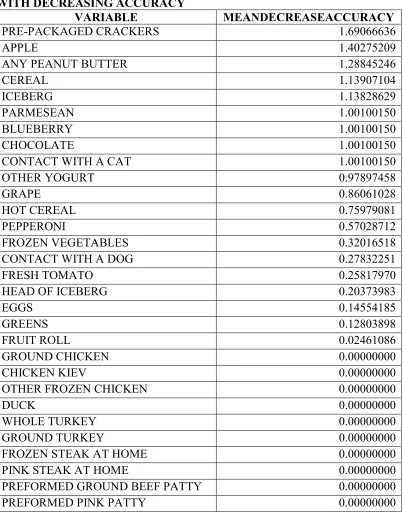
TABLE 4.4VARIABLE IMPORTANCE FOR THE AUGUST 2012OUTBREAK WITH DECREASING ACCURACY ...62
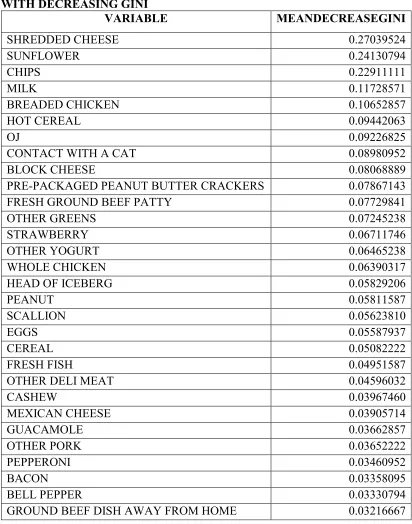
TABLE 4.5VARIABLE IMPORTANCE FOR THE AUGUST 2015OUTBREAK WITH DECREASING GINI ...63
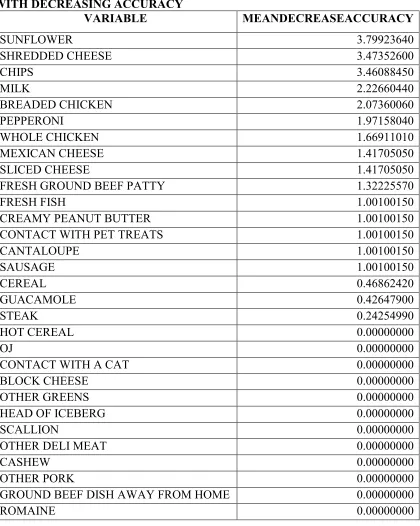
TABLE 4.6VARIABLE IMPORTANCE FOR THE MAY 2012OUTBREAK WITH DECREASING ACCURACY ...64
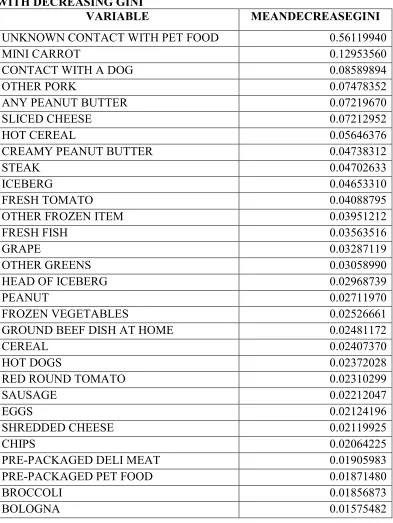
TABLE 4.7VARIABLE IMPORTANCE FOR THE MAY 2012OUTBREAK WITH DECREASING GINI ...65
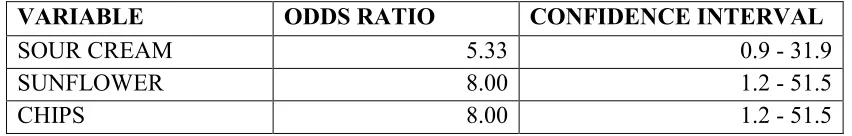
TABLE 4.8CAUSES OF THE MAY 2012OUTBREAK AS IDENTIFIED BY DHEC ...66
TABLE 5.1STUDY POPULATION CHARACTERISTICS OF THE 4058SALMONELLACASES ...88
TABLE 5.2MODEL SELECTION –DHECDEFINITION ...89
TABLE 5.3RELATIVE RISKS FOR EACH VARIABLE SELECTED TO THE MODEL –DHEC DEFINITION ...90
TABLE 5.4RELATIVE RISKS FOR EACH VARIABLE SELECTED TO THE MODEL STRATIFIED BY URBAN/RURAL AND HISPANIC–DHECDEFINITION ...91
TABLE 5.6RELATIVE RISKS FOR EACH VARIABLE SELECTED TO THE MODEL –FDA
DEFINITION ...93
TABLE 5.7RELATIVE RISKS FOR DAIRY VARIABLES CHOSEN TO EACH DEFINITION’S
MODEL...94
TABLE 6.1STUDY POPULATION CHARACTERISTICS OF THE 875RESPONDENTS –
WEIGHTED ...119
TABLE 6.2RELATIVE RISKS OF EACH CATEGORY –WEIGHTED ...120
TABLE 6.3RELATIVE RISKS OF EACH CATEGORY WHEN CONTROLLING FOR URBAN VS.
RURAL –URBAN ...121
TABLE 6.4RELATIVE RISKS OF EACH CATEGORY WHEN CONTROLLING FOR URBAN VS.
RURAL –RURAL ...122
TABLE 6.5PARAMETERS SELECTED TO EACH FOOD MODEL ...123
TABLE 6.6RELATIVE RISKS FOR EACH VARIABLE SELECTED TO THE SEAFOOD MODEL ..124
TABLE 6.7RELATIVE RISKS FOR EACH VARIABLE SELECTED TO THE SNACKS MODEL ....125
TABLE 6.8RELATIVE RISKS FOR EACH VARIABLE SELECTED TO THE NUTS MODEL ...126
LIST OF FIGURES
FIGURE 4.1VARIABLE IMPORTANCE FOR THE MAY 2015OUTBREAK...67
FIGURE 4.2VARIABLE IMPORTANCE FOR THE AUGUST 2012OUTBREAK ...68
FIGURE 4.3VARIABLE IMPORTANCE FOR THE MAY 2012OUTBREAK...69
FIGURE D.1SMALL DECISION TREE ...173
LIST OF ABBREVIATIONS
DHEC ... South Carolina Department of Health and Environmental Control
IPSPR ... University of South Carolina’s Institute for Public Service and Policy Research
STEC ... Shiga toxin-producing Escherichia coli
FDA... Food and Drug Administration
CHAPTER
1
INTRODUCTION
1.1 BACKGROUND
With foodborne outbreaks constituting a major, ongoing public health burden in
South Carolina and the United States, prompt and effective detection of the source through
epidemiologic investigations are necessary to remove contaminated food from the market.
These investigations help prevent further illnesses, and focus prevention strategies on
critical contamination points along the “farm-to-fork” continuum. The plan, in conjunction
with South Carolina’s Department of Environmental Health and Control (DHEC) is to
enhance detection, investigation, and control of foodborne disease.
Currently, it is mandated by the state of South Carolina that cases of infection with
Salmonella need to be reported to DHEC within three business days. While many more
pathogens cause gastrointestinal illness, the main focus of the present research will be
Salmonella as it is one of the top causes of foodborne illness in the US. DHEC staff
monitors daily laboratory and provider disease reports to identify positive reports, followed
by immediate interview of those with positive laboratory results. For the interview, a
standard core questionnaire assessing food history was developed and implemented by
DHEC for initial screening and hypothesis generation. Interviews are administered without
waiting for the serotype results. Conducting real-time review of subtyping results in
But, while the interviews are being conducted, organisms are sent to the DHEC Bureau of
Laboratories (BoL) to be characterized. These results were used to separate the interviews
into cases possibly associated with a common source of exposure versus sporadically
occurring cases. The incidence, rates, and risk of certain pathogens in the state as a whole
as well as by geographical area can be determined from the questionnaires through the use
of a cohort study. Currently, foods associated with an outbreak are characterized using
excel to manually look for possible associations.
Eighteen counties (Pickens, Greenville, Spartanburg, Cherokee, Union, Richland,
Lexington, Newberry, Fairfield, Chester, Lancaster, York, Horry, Williamsburg,
Georgetown, Berkeley, Dorchester, and Charleston) were selected for this sentinel project.
This was based upon: 1) disease burden (66% of all cases of Salmonella, Shiga
toxin-producing Escherichia coli (STEC) and Listeria), 2) geographic diversity (Upstate,
Midlands and Coastal areas), 3) population density (these counties represent 65% of the
total state population), and, 4) presence of three metropolitan statistical areas (MSAs) listed
in the “Top 100” nationally within the selected counties.
To further the investigation into the food preferences of South Carolinians, the
DHEC Food Exposures Survey was conducted in conjunction with the University of South
Carolina’s Institute for Public Service and Policy Research (IPSPR). This is a telephone
(both landline and cell phone) survey with a representative sample of the state’s population
two years of age or older that will help determine the level of exposure that South
Carolinians have to various types of food. The questionnaire used in this survey was
used by DHEC when it encounters a confirmed case of Salmonella. Each of the
questionnaires was administered to a representative sample of the target population.
While these data contribute to disease surveillance, we plan to use them to
characterize the dietary patterns of South Carolinians and test a new method to identify
foods associated with outbreaks. This information will address the challenges of a rural
southern state with high disease burden in locations with the highest number of cases,
something that has not previously been shown.
1.2 SPECIFIC AIMS
The Specific Aims of this study are as followed:
Aim 1: To compare food(s) that may have caused a foodborne outbreak identified by the random forests method using data from standardized hypothesis-generating questionnaires
conducted by the South Carolina Department of Health and Environmental Control.
Research Question 1.1: Does the random forests method applied to a foodborne outbreak study lead to identification of more defined food clusters?
Research Question 1.2: How do the groups identified by random forests compare to traditional methods (i.e. a case-only study)?
Aim 2: To evaluate food eaten by South Carolina residents who may have been involved in a foodborne outbreak using data from standardized hypothesis-generating questionnaires
conducted by the South Carolina Department of Health and Environmental Control.
Research Question 2.1: Are there commonalities in dietary intake patterns among individuals who live in urban settings and those who live in rural settings and
Research Question 2.2: Is there a relation between food clusters identified by random forests and the dietary patterns of South Carolinians?
Aim 3: To characterize the nutrition and dietary intake of South Carolina residents using the South Carolina Department of Health and Environmental Control Food Exposures
Survey.
Research Question 3.1: What are the demographic, social, and geographic determinants of dietary patterns in the South Carolina population not investigated
for foodborne illness outbreaks?
Research Question 3.2: Is there an association between the dietary patterns and frequency of eating pre-packaged foods or fresh foods?
1.3 SIGNIFICANCE
While foodborne pathogens and the study of outbreaks themselves are not
innovative, the ways they are being investigated continue to evolve. Random Forests is a
relatively new data driven machine-learning tool to identify predictive patterns in big data
that is used in many diverse fields. Its application to foodborne disease outbreak
investigations can potentially help to identify foods causing illness quickly, but to the best
of our knowledge, this has not yet been done. We have applied Random Forests to identify
foods associated with Salmonella outbreaks in South Carolina using outbreak investigation
data collected by DHEC (Aim 1). The results of this study can potentially improve
foodborne disease outbreak investigations in South Carolina and beyond. Also, no other
studies have looked at Salmonella in the context of regions in South Carolina.
In addition, we studied dietary patterns derived from questionnaires that DHEC
derived from a food exposure questionnaire that had been administered to individuals as
part of outbreak investigations. Food groups associated with Salmonella outbreaks were
identified, and then described by demographic and other characteristics (Aim 2). The
second food group pattern was derived from a questionnaire that was similar to the one
DHEC had used for the outbreak investigation, but was administered to a representative
sample of individuals living in South Carolina. We then described the demographic, social
and geographic predictors of consumption of these food groups by South Carolina residents
(Aim 3). This information characterizing food exposure data collected by DHEC as part of
its surveillance, will help in interpreting data collected in outbreak investigations. To the
best of our knowledge, no other study has attempted to collect this information and make
this comparison. In summary, we have used Random Forests to analyze data that are
routinely collected during foodborne outbreak investigations. This new application of
CHAPTER 2
LITERATURE REVIEW
2.1 WHAT IS FOODBORNE ILLNESS?
Foodborne illness is a serious public health threat. The Centers for Disease Control
and Prevention (CDC) estimates that 76 million foodborne illnesses, including 325,000
hospitalizations and 5,000 deaths, occur in the United States each year.1,2 This roughly
equates to 1 in 6 Americans getting sick every year.2,3 Anyone can get a foodborne illness.
However, some people are more likely to develop foodborne illnesses than others,
including infants and children, pregnant women, older adults, and people with weak
immune systems.4
Many different disease-causing microbes (or pathogens) can contaminate foods or
beverages, leading to many different foodborne infections.3 Most diseases are infections
caused by a variety of bacteria, viruses, and parasites that can be foodborne. Since so many
microbes can cause foodborne illness, there can be many different symptoms, but the most
common are nausea, vomiting, abdominal cramps, and diarrhea.3,5 Most healthy
individuals will recover without treatment in about 4 to 7 days without the need for
hospitalization.6 Microbes can also spread in more than one way, so it can be tough to tell
if a disease is foodborne, which is a matter of public health importance due to the fact that
knowing how a disease is spread is crucial in the process of stopping it from spreading
2.1a SALMONELLA
One of the most common causes of foodborne illness is Salmonella. Salmonella
is a Gram-negative facultative intracellular pathogen that causes a spectrum of clinical
diseases depending on the serotype of the infecting bacteria and the susceptibility of the
host.7,8 Infections are classified in three categories, (1) gastroenteritis, (2) systemic
infection of an otherwise healthy host, or typhoid, and (3) infection of an
immunocompromised host. In terms of this review, focus will be on the first of three
aforementioned types, gastroenteritis, or non-typhoidal Salmonella.
Large foodborne outbreaks, including those caused by Salmonella, associated with
the ingestion of contaminated foods, like tomatoes, produce, and peanut butter are
becoming a more and more common occurrence.7,9-12 Approximately 50% of all foodborne
infections are caused by bacteria, and of those, about 30-50% can be attributed to
Salmonella and its variates.1,13 What is important to note is that these intestinal infections
can be initiated by any of the approximately 2,000 different serotypes of Salmonella that
infect both human and animal reservoirs.7
The most common human isolates of non-typhoidal Salmonella (NTS) are
Salmonella Enterica serotypes Typhimurium (S. Typhimurium) and Enteritidis (S.
Enteritidis) as well as S. Newport and S. Heidelberg.14 Annually, there are around 40,000
cases of NTS reported each year, which underestimates the actual problem due to the ill
person not visiting a physician or the fact that no specimen is obtained for laboratory
testing.15,16 It is estimated that of these cases, 582 deaths occur each year, making this
States.14 The incidence of foodborne human infections caused by S. Enteritidis and by
multi-drug-resistant strains of S. Typhimurium increased substantially during the second
half of the 20th century moving into the first part of the 21st century in the US with similar
trends being reported from Europe.17-21
2.1b NTS GLOBALLY
NTS is the single most common cause of death from diarrheal disease associated
with viruses, parasites, or bacteria. In addition, it is the leading cause of foodborne disease
outbreaks in the United States.15,13 This produces between $500 million to $2.3 billion in
annual costs for medical care and lost productivity.22 In the US and Europe, the press does
a good job in getting the word out about outbreaks, but what is less known publicly is the
impact of NTS infections in developing countries. Diarrheal diseases result in
approximately 2-3 million deaths among children annually in developing countries, of
which a significant portion is caused by NTS.14 NTS are currently the most common blood
isolates from children and the second most common cause of neonatal meningitis in
sub-Saharan Africa, resulting in mortality rates exceeding 20%.23,24 In adults, NTS is
associated with AIDS as a top risk factor due to the HIV epidemic. Annually, about 10%
of HIV positive African adults develop NTS infections, resulting in mortality rates about
2.2 MONITORING SYSTEMS
2.2a NATIONAL NOTIFIABLE DISEASES SURVEILLANCE SYSTEM
(NNDSS)
The CDC National Notifiable Diseases Surveillance System (NNDSS) is a
nationwide collaboration that enables all levels of public health (local, state, territorial,
federal, and international) to share health information to monitor, control, and prevent the
occurrence and spread of state-reportable and nationally notifiable infectious and some
noninfectious diseases and conditions.25 NNDSS is a multifaceted program that includes
the system for collection, analysis, and sharing of health data. It also allows for the sharing
of policies, laws, electronic messaging standards, people, partners, information systems,
processes, and resources at the local, state, and national levels.25 State health departments
voluntarily submit notifiable disease information electronically and through the NNDSS;
that information is collected, analyzed, interpreted, managed, and shared according to
standards set by NNDSS. This information is then disseminated nationally through the
Morbidity and Mortality Weekly Report (MMWR).
2.2b FOODCORE
While little is known publicly about the impact of NTS globally, the US does a
good job of monitoring all outbreaks with a system called FoodCORE (Foodborne Diseases
Centers for Outbreak Response Enhancement), which is a supplemental surveillance
system to the NNDSS. In 2009, the CDC funded a pilot program to improve response to
foodborne disease outbreaks in conjunction with U.S. Department of Agriculture's Food
was successful, it was expanded to seven states, of which South Carolina is one, and
renamed FoodCORE. This covers about 14% of the US population.26 Each center works
together to develop better methods to detect, investigate, respond to, and control multistate
outbreaks of foodborne diseases. Efforts are focused on outbreaks caused by bacteria,
including Salmonella. FoodCORE focuses on four key areas: enhancement of public health
laboratory surveillance, epidemiologic interviews and investigations, environmental health
assessments, and best practices and replicable models for detection, investigation,
response, and control.26
2.2c PULSENET
Molecular subtyping of bacterial isolates has been successfully applied to help in
epidemiologic investigations of foodborne disease outbreaks since plasmid fingerprinting
was used close to 30 years ago.27,28 Since then, several more methods for identifying
restriction fragment length polymorphisms on chromosomal DNA have been developed,
and molecular subtyping has become an integral part of epidemiologic investigations of
infectious diseases, including foodborne outbreaks.29-36 Given the number of techniques
and protocols that can be used for subtyping, even for the same type of bacteria, the results
cannot be compared across laboratories, leading to diminished power and thus diminished
identification of outbreaks.
In 1993, there was an investigation of an Escherichia coli O157:H7 outbreak caused
by contaminated hamburgers served in a fast-food restaurant chain in the western United
States.28 Barrett et al. applied pulsed-field gel electrophoresis (PFGE) to characterize
investigations.37 This led to a high demand in requests, which in turn led to the realization
that decentralization of subtyping activities to public health laboratories would enable more
timely subtyping of food isolates. This would have information more readily available to
epidemiologists while investigating outbreaks.
Thus, in 1995, the CDC, with assistance from the Association of Public Health
Laboratories (APHL) created a national molecular subtyping network for foodborne
bacterial disease surveillance, later to be known as PulseNet.28,38 Over the years,
PulseNet’s laboratory evaluation of isolates from clusters or outbreaks identified through
epidemiologic surveillance has demonstrated its value in early recognition of outbreaks
and rapid identification of their microbial sources.
2.3 EXAMPLES OF SALMONELLA OUTBREAKS IN THE US
2.3a SALMONELLA SAINTPAUL
There have been many national outbreaks that were cause for concern in the United
States in the past decade. Raw produce is an increasingly recognized vehicle for
transmission of pathogens.39-41 In May 2008, the New Mexico Department of Health
notified the CDC of 19 cases of salmonella infection, of which 7 had completed serotyping.
All 7 came back as Salmonella Enterica serotype Saintpaul. Four isolates tested had
indistinguishable patterns on PFGE. Later in the month, PulseNet staff identified three
additional isolates in Colorado and Texas, which was surprising considering only 40 human
Saintpaul isolates were submitted to PulseNet in 2007.39 By the end of the investigation,
approximately 1500 case subjects were identified in 43 states, the District of Columbia,
Cluster investigations were started on the cases, with questionnaires being utilized
to locate commonalities of those potentially exposed. Salsa and guacamole, both foods
typically containing tomatoes and hot peppers, were implicated repeatedly in cluster
investigations, thus leading many to think tomatoes were the source of the Salmonella,
since they have been implicated many times. 42-44 However, as the investigation proceeded,
it was indicated that hot peppers, including jalapeño and Serrano peppers, were the vehicle
for transmission. There is an amount of collinearity due to the fact that tomatoes and
peppers are eaten together in things like salsa and guacamole.39
After an environmental investigation conducted by the FDA, the pepper
contamination may have occurred on the farm, which may not be that unusual. A small
survey of Mexican farms that grow chile peppers indicated that 6 of 14 irrigation-water
samples (43%) and 3 of 5 pepper rinses (60%) yielded salmonella, although none of the
serotypes were Saintpaul.45 This outbreak investigation highlighted the challenges of
epidemiologic identification of ingredients in foods that are commonly consumed, rapid
identification and investigation of local clusters, the need to continue exploring hypotheses
during an ongoing outbreak, and produce tracing in the supply chain.39
2.3b SALMONELLA TENNESSEE
Salmonella Tennessee infections are rare and most of the sources of infection are
unknown.46 An average of 52 cases were reported annually during 1995-2004, 0.1% of all
Salmonella strains, but the only reported outbreak previously reported was due to
contaminated powdered milk.47,48 In November 2006, there was a widespread increase in
December, 52 isolates from 25 states, and by July 2007, a total of 715 cases were identified
in 48 states.46
In the initial investigation, it was noted that cases were not geographically clustered
nor were there common food exposures when patient interviews were conducted locally.
When the investigation was expanded using a standard food consumption survey, it was
noted that of the 31 patients interviewed, 48% ate turkey and 85% consumed peanut
butter.46 Epidemiologic data suggested that two brands of peanut butter were the possible
sources of the outbreak, both of which were manufactured in the same plant. This led to
the company making radical changes at its manufacturing plant.
This was the first reported peanut butter outbreak reported in the US. Peanut butter
was previously considered as low risk for Salmonella contamination, but that is no longer
the case. Peanuts could have become contaminated with salmonellae during growth,
harvest, or storage. Salmonellae can enter food-processing plants by various mechanisms,
such as through raw agricultural products, water, animals, humans, or other surfaces.46 The
organisms are able to survive high temperatures in high-fat, low water activity
environments.49 Peanut butter provides such an environment, and Salmonella has been
shown to survive for at least 6 months in peanut butter.50 This outbreak helped to reveal
the potential for widespread illness from a broadly distributed product with a long shelf life
and that Salmonella surveillance with serotyping is critical in detecting such outbreaks. It
also showed that processed foods have the potential to be contaminated in many steps,
2.3c SALMONELLA TYPHIMURIUM
In November 2008, PulseNet detected a cluster of Salmonella Typhimurium with
the same, rare PFGE pattern in 16 states and later in the month a second cluster of 27
isolates in 14 states with two rare PFGE patterns was noted.51 Due to similarity, this was
defined as an outbreak that identified 714 cases from 46 states. Of these cases, 86
hypothesis-generating interviews from 26 states noted that 47 of 81 respondents (58%)
reported having been exposed to institutional settings; 56 of 79 (71%) reported eating
peanut butter; and 61 of 71 (86%) reported eating chicken. However, respondents reported
eating many different types and brands of peanut butter and chicken products.51 Ongoing
interviews revealed that peanut butter was the source of the outbreak, with one
manufacturer at the heart of the problem.
This nationwide outbreak was linked to eating contaminated peanut butter, peanut
paste, and roasted peanuts produced at the PCA facilities in Georgia and Texas. This
outbreak resulted in one of the largest food recalls in U.S. history and an estimated $1
billion loss in peanut sales.52 The traceback investigations led to multiple possibilities for
the source of the contamination. Salmonella can survive in a low-moisture food such as
peanut butter for at least 24 weeks; therefore, if postprocessing contamination occurs,
Salmonella may survive in peanut butter for its entire shelf life of 18 to 24 months.50
Contamination of low-moisture foods is likely to lead to prolonged, dispersed outbreaks
that may be sustained as long as production conditions lead to contamination. The duration
of the outbreak and range of production dates among Salmonella-positive food samples
suggest that the outbreak strain may have been present in the PCA facilities for an extended
and spurring discussions about gaps in the food safety system and methods for establishing
and enforcing basic preventive controls.
2.3d SALMONELLA NEWPORT
Salmonella Newport causes more than an estimated 100,000 infections annually in
the United States, making it the third most common serotype causing human illness.44
From July to November 2005, 72 laboratory confirmed S. Newport isolates
indistinguishable by PFGE from the outbreak strain were identified in 16 states. During
the investigation, it was found that most cases (70%) were exposed to uncooked tomatoes
in restaurants than any other item. Of 27 cases, 11 (41%) reported eating beefsteak
tomatoes, and 13 (48%) reported eating other types of tomatoes. Twenty-six (90%) of 29
cases and 86 (72%) of 119 controls had any exposure to tomatoes in either a home or
restaurant.44
Traceback investigation showed that two growers/packing houses on the eastern
shore of Virginia were the source of the contaminated tomatoes. Farms in this region
supplied only the eastern and central United States at the time of this outbreak, matching
the national distribution of cases of the outbreak pattern of S. Newport.44 This outbreak
was actually much larger than reported. Given that about one of every 38 cases of sporadic,
laboratory-confirmed Salmonella infection is ascertained by public health surveillance, it
was estimated that more than 2,500 patients might have been affected by this outbreak.53
2.4 RANDOM FORESTS
Random forests is a machine-learning tool used for classification with applications
in big data. Most uses of it applications in epidemiology are in genetic studies. Random
forests classify by inputting a new object down each of the trees in the forest.54 In a random
forest, a number of decision trees are built during the process. Since there are many trees
built in the process of running a random forest algorithm, it is called a forest. To classify a
new object from an input variable, put said variable down each of the trees in the forest. It
is a model that uses binary splits on independent variables to predict outcome, read like a
flow chart. Random forests iteratively develops decision trees which can be used in
categorical or continuous variable prediction.54 Each tree classifies each observation into a
particular category and the tree “votes” for that category. The forest chooses the category
having the most votes over all the trees in the forest. The underlying algorithms are highly
accurate, can run quickly on large databases, and can give estimates of what variables are
important in classification, referred to as “variable importance”. Random forests is an
effective method for estimating missing data and maintains accuracy when a large
proportion of the data are missing.54
The core building block of random forests is a CART (classification and regression
tree) inspired decision tree. The CART algorithm starts by drawing a random sample of
individuals from the main dataset and building a decision tree based on this sample. Then,
it repeats the process a second time, picking another random sample and growing a second
decision tree. The prediction from the second tree will typically be different than those of
the first tree.55 This process continues, generating more trees each built on a slightly
forests builds upon CART by adding randomness into the actual tree growing and not just
the sampling.54 Random forests takes a randomized sample of the rows in the dataset,
creating a collection of unique trees which all make their classifications differently. Each
tree is called to make a classification, the “votes” are tallied, and the majority decision is
chosen. Since each tree is grown out fully, they each overfit, but in different ways. Thus,
the mistakes one makes will be averaged out over them all.55
Random forests also result in a measure of variable importance. This method
measures the relative importance of a variable correctly predicting the outcome category.
It is based on measuring the damage that would be done to our predictive models if we lost
access to true values of a given variable.56 The more the accuracy of the random forest
decreases due to the exclusion (or permutation) of a single variable, the more important
that variable is deemed. Hence, variables with a large mean decrease in accuracy are more
important for classification of the data.57 While that measures accuracy, there is another
measure, GINI. GINI is based on the actual role of a predictor and offers an alternative
importance assessment based on the role the predictor plays in the data. The mean decrease
in Gini coefficient is a measure of how each variable contributes to the homogeneity of the
nodes and leaves in the resulting random forest.57 Each time a particular variable is used to
split a node, the Gini coefficient for the subsequent child nodes are calculated and
compared to that of the original node. The Gini coefficient is a measure of homogeneity
from 0 (homogeneous) to 1 (heterogeneous). The changes in Gini are summed for each
variable and normalized at the end of the calculation. Variables that result in nodes with
Currently, hierarchical cluster analysis is the main method of identifying
similarities and differences among serotypes of Salmonella. This method results in clusters
formed in a hierarchical fashion, which may be less efficient than using a method like
random forests.58 Most uses of random forests in a foodborne illness setting do not extend
past looking at the PFGE patterns to determine similarities in serotypes, something that
will be achieved here.58,59 The importance of this work will be to attempt to use a method
currently more focused on either genetic or microbiological studies and apply them to an
epidemiological setting. This work will focus on finding a group of foods that will contain
the true cause of an outbreak. This could result in faster and more accurate resolutions to
outbreaks than the currently used case studies or hierarchical cluster analysis.
2.5 WORKS CITED
1. Nyachuba DG. Food-borne illness: is it on the rise? Nutr Rev.2010; 68: 257-269. 2. Centers for Disease Control and Prevention (CDC). Surveillance for foodborne
disease outbreaks—United States, 2007. Morbidity and Mortality Weekly Report.
2010;59(31):973–979.
3. Centers for Disease Control and Prevention. Foodborne Illness, Foodborne Disease, (sometimes called “Food Poisoning”).
http://www.cdc.gov/foodsafety/facts.html#what. Published 2014. Accessed 1 April 2014.
4. National Institute of Diabetes and Digestive and Kidney Diseases. Foodborne Illnesses. http://digestive.niddk.nih.gov/ddiseases/pubs/bacteria/. Published 2012.
Accessed 1 April 2014.
5. US Department of Health and Human Services. Food Poisoning.
http://www.foodsafety.gov/poisoning/. Published 2014. Accessed 1 April 2014. 6. Santos RL, Raffatellu M, Bevins CL, Adams LG, Tükel C, Tsolis RM, Bäumler AJ. Life in the inflamed intestine, Salmonella style. Trends Microbiol. 2009:17, 498–506.
7. Griffin AJ, McSorley SJ. Development of protective immunity to Salmonella, a mucosal pathogen with a systemic agenda. Mucosal Immunol. 2011;4:371–382. 8. Parry CM, Hien TT, Dougan G, White NJ, Farrar JJ. Typhoid fever. N. Engl. J.
Med.. 2002; 347: 1770-1782.
9. Centers for Disease Control and Prevention (CDC). Multistate outbreaks of
10.Centers for Disease Control and Prevention (CDC). Outbreak of Salmonella
serotype Saintpaul infections associated with multiple raw produce items—United States, 2008. Morbidity and Mortality Weekly Report. 2008;57(34):929-934. 11.Centers for Disease Control and Prevention (CDC). Multistate outbreak of
Salmonella infections associated with peanut butter and peanut butter-containing products—United States, 2008–2009. Morbidity and Mortality Weekly Report.
2009;58:85-90.
12.Centers for Disease Control and Prevention (CDC). Multistate outbreak of
Salmonella serotype Tennessee infections associated with peanut butter—United States, 2006-2007. Morbidity and Mortality Weekly Report. 2007;56(21):521-524. 13.Olsen SJ, MacKinnon LC, Goulding JS, Bean NH, Slutsker L. Surveillance for
food-borne-disease outbreaks—United States, 1993–1997. Morbidity and Mortality Weekly Report Surveillance Summary. 2000;49:1-62.
14.Rabsch W, Tschäpe H, Bäumler AJ. Non-typhoidal salmonellosis: emerging problems. Microbes Infect. 2001; 3(3):237-247.
15.Mead PS, Slutsker L, Dietz V, McCaig LF, Bresee JS, Shapiro C, Griffin PM, Tauxe RV. Food-related illness and death in the United States. Emerg. Infect Dis.
1999; 5: 607-625.
16.Chalker RB, Blaser MJ. A review of human salmonellosis: III. Magnitude of
Salmonella infection in the United States. Rev. Infect. Dis. 1988;10:111-124. 17.Glynn MK, Bopp C, Dewitt W, Dabney P, Mokhtar M, Angulo FJ. Emergence of
multidrug-resistant Salmonella enterica serotype typhimurium DT104 infections in the United States, N. Engl. J. Med. 1998;338:1333–1338.
18.Angulo FJ, Swerdlow DL. Salmonella enteritidis infections in the United States,
J. Am. Vet. Med. Assoc. 1998;213:1729–1731.
19.Cohen ML, Tauxe RV. Drug-resistant salmonella in the United States: an epidemiologic perspective, Science. 1986;234:964–969.
20.St. Louis ME, Morse DL, Potter ME, DeMelfi TM, Guzewich JJ, Tauxe RV, Blake PA. The emergence of grade A eggs as a major source of Salmonella
enteritidis infections. New implications for the control of salmonellosis. JAMA
1988;259:2103–2107.
21.Rodrigue DC, Tauxe RV, Rowe B. International increase in Salmonella
enteritidis: a new pandemic? Epidemiol. Infect. 1990;105:21–27.
22.Frenzen PD, Riggs TL. Salmonella cost updated using foodnet data. Food Review. 1999;22(2):10–15.
23.Walsh AL, Phiri AJ, Graham SM, Molyneux EM, Molyneux ME. Bacteremia in febrile Malawian children: clinical and microbiologic features. Pediatr Infect Dis J. 2000;19:312-318.
24.Molyneux EM, Walsh AL, Malenga G, Rogerson S, Molyneux ME. Salmonella
meningitis in children in Blantyre, Malawi, 1996-1999. Ann Trop Paediatr.
2000;20:41-44.
26.Centers for Disease Control and Prevention. About FoodCORE.
http://www.cdc.gov/foodcore/about.html. Published 2014. Accessed 1 April 2014.
27.Holmberg SD, Wachsmuth IK, Hickman-Brenner FW, Cohen ML. Comparison of plasmid profile analysis, phage typing, and antimicrobial susceptibility testing in characterizing Salmonella typhimurium isolates from outbreaks. J Clin Microbiol.
1984;19:100-4.
28.Swaminathan B, Barrett TJ, Hunter SB, Tauxe RV. PulseNet: the molecular subtyping network for foodborne bacterial disease surveillance, United States. Emerg Infect Dis. 2001;7: 382–389.
29.Ackers ML, Mahon BE, Leahy E, Goode B, Damrow T, Hayes PS, et al. An outbreak of Escherichia coli O157:H7 infections associated with leaf lettuce consumption. J Infect Dis. 1998;177:1588-93.
30.Barrett TJ. Molecular fingerprinting of foodborne pathogenic bacteria: An introduction to methods, uses and problems. In: Tortorello ML, Gendel SM, editors. Food microbiological analysis: new technologies. New York: Marcel Dekker; 1997. p. 249-64.
31.Graves LM, Swaminathan B, Hunter SB. Subtyping Listeria monocytogenes. In: Ryser EM, Marth EH, editors. Listeria, listeriosis and food safety. New York: Marcel Dekker; 1999. p. 279-98.
32.Jimenez A, Barros-Velazquez J, Rodriguez J, Villa TG. Restriction endonuclease analysis, DNA relatedness and phenotypic characterization of Campylobacter jejuni and Campylobacter coli isolates invovled in food-borne disease. J Appl Microbiol. 1997;82:713-21.
33.Maslanka SE, Kerr JG, Williams G, Barbaree JM, Carson LA, Miller JM, et al. Molecular subtyping of Clostridium perfringens by pulsed-field gel
electrophoresis to facilitate food-borne-disease outbreak investigations. J Clin Microbiol. 1999;37:2209-14.
34.Threlfall EJ, Hampton MD, Ward LR, Rowe B. Application of pulsed-field gel electrophoresis to an international outbreak of Salmonella agona. Emerg Infect Dis. 1996;2:130-2.
35.Threlfall EJ, Ward LR, Hampton MD, Ridley AM, Rowe B, Roberts D, et al. Molecular fingerprinting defines a strain of Salmonella enterica serotype Anatum responsible for an international outbreak associated with formula-dried milk.
Epidemiol Infect. 1998;121:289-93.
36.Wachsmuth K. Molecular epidemiology of bacteria infections: Examples of methodology and of investigations of outbreaks. Rev Infect Dis. 1986;8:682-92. 37.Barrett TJ, Lior H, Green JH, Khakhria R, Wells JG, Bell BP, et al. Laboratory
investigation of a multi-state food-borne outbreak of Escherichia coli O157:H7 by using pulsed-field gel electrophoresis and phage typing. J Clin Microbiol.
1994;32:3013-7.
38.Stephenson J. New approaches for detecting and curtailing foodborne microbial infections. JAMA. 1997;277:1337-40.
40.Sivapalasingam S, Friedman CR, Co- hen L, Tauxe RV. Fresh produce: a growing cause of outbreaks of foodborne illness in the United States, 1973 through 1997. J Food Prot. 2004;67:2342-53.
41.Lynch MF, Tauxe RV, Hedberg CW. The growing burden of foodborne outbreaks due to contaminated fresh produce: risks and opportunities. Epidemiol Infect.
2009;137:307-15.
42.Hedberg CW, Angulo FJ, White KE, et al. Outbreaks of salmonellosis associated with eating uncooked tomatoes: implications for public health. Epidemiol Infect.
1999;122:385-93.
43.Gupta SK, Nalluswami K, Snider C, et al. Outbreak of Salmonella Braenderup infections associated with Roma tomatoes, northeastern United States, 2004: a useful method for subtyping exposures in field investigations. Epidemiol Infect.
2007;135: 1165-73.
44.Greene SK, Daly ER, Talbot EA, et al. Recurrent multistate outbreak of
Salmonella Newport associated with tomatoes from contaminated fields, 2005.
Epidemiol Infect. 2008;136:157-65.
45.Gallegos-Robles MA, Morales-Loredo A, Alvarez-Ojeda G, et al. Identification of Salmonella serotypes isolated from cantaloupe and chile pepper production systems in Mexico by PCR-restriction fragment length polymorphism. J Food Prot. 2008;71:2217-22.
46.Sheth AN, Hoekstra M, Patel N, Ewald G, Lord C, Clarke C, Villamil E, Niksich K, Bopp C, Nguyen T, Zink D, Lynch M. A national outbreak of Salmonella
serotype Tennessee infections from contaminated peanut butter: a new food vehicle for salmonellosis in the United States. Clin Infect Dis. 2001;53: 356–362. 47.Centers for Disease Control and Prevention. Salmonella surveillance summary,
2004. http://www.cdc.gov/ncidod/dbmd/phlisdata/salmonella.htm. Published 2006. Accessed 1 April 2014.
48.Centers for Disease Control and Prevention (CDC). Salmonella serotype Tennessee in powdered milk products and infant formula—Canada and United States, 1993. Morbidity and Mortality Weekly Report. 1993; 42:516–7.
49.Mattick KL, Jorgensen F, Legan JD, Lappin-Scott HM, Humphrey TJ.
Habituation of Salmonella spp. at reduced water activity and its effect on heat tolerance. Appl Environ Microbiol. 2000; 66:4921–5.
50.Burnett SL, Gehm ER, Weissinger WR, Beuchat LR. Survival of Salmonella in peanut butter and peanut butter spread. J Appl Microbiol. 2000; 89:472–7. 51.Cavallaro E,Date K, Medus C, et al. Salmonella Typhimurium infections
associated with peanut products. New Engl J Med. 2011; 365: 601–610.
52.ThomasNet News. Peanut recall sparks large-scale food safety concerns. http://news.thomasnet.com/IMT/archives/2009/03/salmonella-related-peanut-recalls-impact-on-manufacturers-businesses-becoming-clearer.html. Published 2009. Accessed 1 April 2014.
54.UC Berkeley. Random Forests.
https://www.stat.berkeley.edu/~breiman/RandomForests/cc_home.htm. Published 2001. Accessed 20 Sep 2014.
55.Stephens T. Titanic: Getting Started With R - Part 5: Random Forests. http://trevorstephens.com/kaggle-titanic-tutorial/r-part-5-random-forests/. Published 2014. Accessed 28 Feb 2017.
56.Salford Systems. Random Forests for Beginners.
http://info.salford-systems.com/an-introduction-to-random-forests-for-beginners. Published 2014. Accessed 19 Feb 2017.
57.Dinsdale et al. Random Forests.
https://dinsdalelab.sdsu.edu/metag.stats/code/randomforest.html. Published 2016. Accessed 31 Mar 2017.
58.Zou W, Lin WJ, Foley SL, Chen CH, Nayak R, Chen JJ. 2010. Evaluation of pulsed-field gel electrophoresis profiles for identification of Salmonella serotypes.
J. Clin. Microbiol. 48:3122–3126.
CHAPTER
3
METHODS
3.1STUDY DESIGN
A case-only study design was used for Aim 1, and a cross-sectional study design
was used for Aims 2 and 3. The dataset used for Aim 1 and Aim 2 was collected from
standardized surveillance questionnaires submitted to the South Carolina Department of
Health and Environmental Control (DHEC). The following events occurred for an illness
to be ascertained and thus for inclusion in the study (Aims 1 and 2). The ill person sought
medical care and had a specimen that tested positive for Salmonella was submitted to
DHEC Bureau of Laboratories (BoL) for testing. The laboratory test identified the
causative agent and reported the illness to public health authorities, in this case DHEC
Division of Acute Disease Epidemiology (DADE). DADE administered the appropriate
questionnaire and the person who was ill completed it fully. Data were collected for this
study from January 2008 to June 2015, with 4058 possible Salmonella cases identified for
inclusion based on the above criteria. Through the questionnaire, information on the foods
consumed in the past seven days was collected. Both Aim 1 and Aim 2 also used serological
data as recorded by BoL. All participants have their serological data linked to their
questionnaire at DADE. Participants were grouped by serotype as well as whether or not
For Aim 1 we further split the dataset down to three separate outbreaks. DHEC
assigned outbreak status in this dataset based on their knowledge of sporadically occurring
cases. They limited it by geographical location, serotype, date, and foods eaten, taking into
account seasonality and a threshold of commonly occurring cases. Based on the definition
provided, three known DHEC outbreaks were chosen for analysis, May 2015, August 2012,
and May 2012. The May 2015 outbreak was suspected to be caused by fast food chain
chicken with 24 suspected cases. The August 2012 outbreak had 17 suspected cases was
thought to be caused by boiled peanuts, contact with an amphibian, or a waterborne
exposure. The May 2012 outbreak was caused by guacamole, chips, and sour cream with
9 cases.
For Aim 3 we used a different dataset that assessed food preferences of South
Carolinians. The South Carolina Department of Health and Environmental Control
(DHEC) commissioned the University of South Carolina’s Institute for Public Service and
Policy Research (IPSPR) to conduct a telephone survey with a representative sample of the
state’s population two years of age or older. The questionnaire used in this survey was
initially designed by DHEC staff and based on the hypothesis-generating questionnaire that
is used by DHEC when it encounters cases of Salmonella and Shiga toxin-producing E.
coli (STEC). The modified questionnaire became the Food Exposures Survey, used to
address the questions of foods eaten without being in relation to an outbreak or confirmed
case of foodborne illness. This helps to aid in the assessment of overall eating patterns and
not just those around the time the study participant may have gotten ill. The survey was
administered to a target population aimed at being a representative sample of the entire
telephone, both cell phone and landline, from July 27-August 30, 2012 from 9:00 AM to
9:30 PM Monday through Friday, from 10:00 AM to 4:00 PM on Saturday, and 3:00 PM
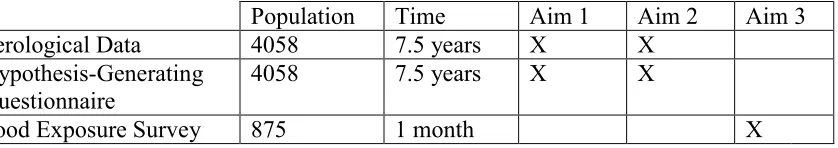
to 8:00 PM on Sunday. Table 3.1 shows a summary of datasets used.
Outbreaks were identified in multiple ways for the purposes of this research. First,
the DHEC outbreak definition as given in the data. DHEC has more knowledge of
sporadically occurring cases and thus, they are more stringent with their outbreak
definition. They identify outbreaks by serotype, date, and foods eaten. DHEC defines an
outbreak as two or more persons not living in the same household with the same enteric
illness following a common exposure. Secondly, the FDA/CDC definition was used. They
both define an outbreak as two or more cases of foodborne illness occurring during a
limited period of time, here 30 days, with the same organism that are associated with either
the same food service operation, such as a restaurant, or the same food product.1,2 From
here, it will be referred to as the FDA definition. The DHEC definition was used for Aim
1, while for Aim 2 we used both the DHEC and FDA definitions. Table 3.2 provides a
summary of what outbreak was used in each case.
TABLE 3.1 SUMMARY OF DATASETS USED
Population Time Aim 1 Aim 2 Aim 3
Serological Data 4058 7.5 years X X
Hypothesis-Generating Questionnaire
4058 7.5 years X X
Food Exposure Survey 875 1 month X
TABLE 3.2 SUMMARY OF OUTBREAK DEFINITIONS USED
Aim 1 Aim 2 Aim 3
DHEC X X
3.2 STUDY POPULATION
Setting Aims 1 and 2: All South Carolinians who went to see a health care provider
for symptoms of foodborne illness, submitted a stool sample for Salmonella testing, and
received a confirmation of illness were eligible to fill out the state-mandated
hypothesis-generating questionnaire on foodborne illness (See appendix B). DHEC staff attempted to
call all eligible participants, but not all were administered the questionnaire as some were
lost to follow-up and others did not fully complete the questionnaire. All completed
questionnaires and serotypes were collected from eighteen counties (Pickens, Greenville,
Spartanburg, Cherokee, Union, Richland, Lexington, Newberry, Fairfield, Chester,
Lancaster, York, Horry, Williamsburg, Georgetown, Berkeley, Dorchester, Charleston).
The counties were selected for this sentinel project based upon: 1) disease burden (66% of
all cases of Salmonella, Shiga toxin-producing Escherichia coli (STEC) and Listeria); 2)
geographic diversity (Upstate, Midlands and Coastal areas); 3) population density (65% of
the total state population); and, 4) presence of three metropolitan statistical areas (MSAs)
listed in the “Top 100” nationally within the selected counties.
Time Period Aims 1 and 2: All individuals who participated in the study and filled
out a questionnaire were included in the analysis. Data for this study was collected from
January 2008 to June 2015, which is a total of 7.5 years.
Setting Aim 3: The study population of this aim was a random sample of South Carolina
residents two years and older. A dual sampling frame approach was used in selecting study
participants. One sampling set was based on landline telephone exchanges and the second
from a random sample of households with telephones in the state. Respondents in the cell
phone sample were randomly selected from a list of cell phone exchanges in South
Carolina. All phones with a South Carolina exchange were eligible for the study and all
counties were included in the sample. The survey interviewers called each of these
numbers. Numbers that were found to be businesses, institutions, not in service, or
otherwise not assigned were ineligible for the survey.
The remaining non-excluded numbers were called, which resulted in contact in both
the landline component and the cell phone component of the study. When contact was
made with a residence in the landline component, a participant two years of age or older
was randomly chosen from the occupants of the household. If the selected participant was
between the ages of 2 and 11, an adult in the household was asked to be a proxy to answer
the questions for the child. Participants aged 12 or older were interviewed directly about
their food exposure experiences. Proxy interviews were conducted for participants between
the ages of 12 and 17 if an adult in the household did not want the selected child to
participate. The food preferences questionnaire used in this survey was based on the
hypothesis-generating questionnaire that is used by DHEC when it encounters a confirmed
case of Salmonella or STEC (See Appendix C).
Time Period Aim 3: Data collection was done via telephone from July 27-August
30, 2012 from 9:00 AM to 9:30 PM Monday through Friday, from 10:00 AM to 4:00 PM
3.3 DATA ANALYSIS
AIM 1: In order to determine food(s) that may have caused a foodborne outbreak, investigators used the questionnaire data obtained from DHEC and serotype data obtained
by DHEC BoL and identified those individuals associated with an outbreak by grouping
according to the serotype data. DHEC staff attempted to call all South Carolinians who
went to see a medical physician for symptoms of foodborne illness, submitted a stool
sample for Salmonella testing, and received a confirmation of illness were eligible to fill
out the hypothesis-generating questionnaire on foodborne illness (See appendix B). Not all
eligible participants were administered the questionnaire as some were lost to follow-up
and others did not fully complete the questionnaire.
The following events had to have occurred for an illness to be ascertained and thus,
for inclusion into the study. The ill person sought medical care and a specimen was
submitted to SC DHEC Bureau of Laboratories (BoL) for testing. For the purposes of this
analysis, only Salmonella cases were considered. The laboratory test identified the
causative agent as Salmonella and reported the illness to SC DHEC Division of Acute
Disease Epidemiology (DADE). DADE then administered the appropriate questionnaire
and the person who was ill completed it fully, stating what had been eaten in the seven days
prior to illness onset. All completed questionnaires and serotypes were collected from
eighteen counties (Pickens, Greenville, Spartanburg, Cherokee, Union, Richland,
Lexington, Newberry, Fairfield, Chester, Lancaster, York, Horry, Williamsburg,
Georgetown, Berkeley, Dorchester, Charleston). The counties were selected for this
sentinel project based upon: 1) disease burden (66% of all cases of Salmonella, Shiga
Midlands and Coastal areas); 3) population density (65% of the total state population); and,
4) presence of three metropolitan statistical areas (MSAs) listed in the “Top 100” nationally
within the selected counties.
Serotypes were grouped by dates of illness onset, serotype pattern, and whether or
not it was a confirmed case as determined by DHEC BoL. Once grouped, the dataset was
narrowed down to three separate outbreaks. DHEC assigned outbreak status in this dataset
based on their knowledge of sporadically occurring cases. They limited it by geographical
location, serotype, date, and foods eaten, taking into account seasonality and a threshold of
commonly occurring cases. Based on the definition provided, three known DHEC
outbreaks were chosen for analysis, May 2015, August 2012, and May 2012. The May
2015 outbreak was suspected to be caused by fast food chain chicken with 24 suspected
cases. The August 2012 outbreak had 17 suspected cases was thought to be caused by
boiled peanuts, contact with an amphibian, or a waterborne exposure. Guacamole, chips,
and sour cream with 9 cases caused the May 2012 outbreak.
Data from each outbreak was run through the random forests package in R
(randomForest). The package was run to determine a shortened list of food or
environmental exposures responsible. The random forests algorithm drew a random
sample from the main dataset and built a decision tree based on this sample. The package
repeated multiple times, each time picking another random subset of data and growing a
decision tree for each random subset. The prediction from each tree will typically be
The forest grown was used to calculate variable importance, a method to measure
the relative importance of any variable. First, there is mean decrease accuracy. The more
the accuracy of the random forest decreases due to the exclusion of a single variable, the
more important that variable is deemed. Random forests performs this action one variable
at a time to aid in the measurement of the loss of accuracy. Thus, variables with a large
mean decrease in accuracy are more important for classification of the data.3 There is also
another variable importance measure, GINI. The mean decrease in GINI is a measure of
how each variable contributes to the homogeneity of the resulting random forest. Each
time a particular variable is used to split a note, the GINI coefficient for each of the
subsequent nodes are calculated and compared to the original node. GINI is measured
from 0 to 1.4 The changes in the GINI coefficient are summed for each variable and
normalized at the end of the random forest calculation. Variables with higher purity have
a higher decrease in GINI.
From here, using the variable importance measures (mean decrease accuracy and
GINI) a comparison on the effectiveness of random forests to traditional methods was
completed. Food and environmental exposures for past outbreaks was collected from
DHEC for comparison against the list of exposures generated from random forests. This
comparison led to more defined methods of classification for the foods responsible for
foodborne illness. Data management and analysis was done using R and SAS 9.4 software.
AIM 2: In order to determine dietary intake of South Carolinians involved in a foodborne outbreak, investigators used the same dataset as AIM 1, collecting data from
January 2008 to June 2015, with 4058 possible Salmonella cases identified for inclusion.
according to the serotype data. This was done using two separate outbreak definitions. The
FDA defines an outbreak as two or more cases of foodborne illness caused by the same
organism that occur within a limited period of time and are associated with either the same
food or same food service operation.1 This study interpreted this as two or more cases of
the same organism that occurred within 30 days and used this to find the food
commonalities. Since DHEC has more knowledge of sporadically occurring cases, they are
more stringent with their outbreak definition and limit it by serotype, date, and foods eaten.
This definition has been provided to us in the data collected from DHEC. Of the 4058
Salmonella cases identified by DHEC from 2008-2015, DHEC identified 78 as being part
of a statewide outbreak while using the FDA definition yielded 2565 cases as part of an
outbreak. Dietary patterns were assessed using the same data in AIM 1 in conjunction with
guidance available from the Center for Nutrition Policy and Promotion.5 There were 186
food exposures categorized for analysis. The groups were poultry (8), meat (18), pork (6),
seafood (9), egg (3), dairy (24), fruit (35), vegetables (26), greens (19), snacks (17), nuts
(18), grains (3), raw foods (14), frozen foods (18), and prepackaged foods that are not
frozen (17). The raw, frozen, and prepackaged categories contain foods that are already in
the main categories. Each group was categorized as 0 for no and 1 for yes.
The investigators also looked at gender, racial, ethnic, and geographical differences
among those identified in an outbreak. Urban or rural was categorized by using the county
of residence from the questionnaire and then the rural definition based on the Office of
Management and Budget (OMB) metropolitan statistical areas. A metro area includes one
or more counties containing a core urban area of 50,000 or more people, together with any
by commuting to work) with the urban core. OMB also defines micropolitan statistical
areas using the same method but centered on urban areas with at least 10,000 but no more
than 50,000 people.6
Gender was classified as 0 for female and 1 for male for ease of analysis. Age was
categorized as an integer with the option of being missing if the participant refused. Race
was made into a numeric variable and put into categories of white, African American,
other, and unknown/refused. Hispanic was asked as whether or not the person being
interviewed identified as Hispanic with the answers being categorized as 0 for no, 1 for
yes, 99 and missing as unknown. The model used for analysis was a log-linear regression
model with a Poisson distribution. Forward, backward, and stepwise selection methods
were used to find the best variable selection. Relative risks were also calculated for each
food exposure group and demographic variable. Data management and statistical analyses
were performed using SAS 9.4 software.
AIM 3: Aim 3 conducted similar analyses to AIM 2, but used a different set of data. The investigators sought to characterize the nutrition and dietary intake of South
Carolina residents using the South Carolina Department of Health and Environmental
Control Food Exposures Survey. The questionnaire used in this survey was initially
designed by DHEC staff and based on the hypothesis-generating questionnaire that is used
by DHEC when it encounters cases of Salmonella and Shiga toxin-producing E. coli
(STEC). The modified questionnaire became the Food Exposures Survey, used to address
the questions of foods eaten without being in relation to an outbreak or confirmed case of
foodborne illness. This helps to aid in the assessment of overall eating patterns and not just