VOLUME 2
July 1949
Number 3
In this Issue
A Report form the President ... F.G. Renner
101
Condition and Management of Range Land Based on
Quantitative Ecology ... E.J. Dyksterhuis
104
Reaction of a California Annual-Plant Community to fire...
Donald F. Hervey
116
Control of Bitterweed on Texas Ranges... ...
Omer E. Sperry
122
Control of Noxious Range Plants in a Range Management
Program ... Kenneth W. Parker
128
Conservation of the Western Range... R.R. Renne
133
Influence of Grazing and Mulch on Forage Growth
H.E. Schwan, Donald J. Hodges, and Clayton N. Weaver 142
Some Probable Future Developments in Control of
Noxious Range Plants
George E. Glendening
149
Abstracts... ... ... ... 153
Book Reviews.... ... ... ... 157
News and Notes ... ... ... 160
Current Literature... Robert A. Darrow
164
Published Quarterly by
Volume 2, Number 3, - July, 194.9
Journal
of
RANGE
MANAGE'MENT
A Report from the President
F. G. RENNER
5.232 South Agr. Bldg., Washington, D. C.
S
INCE we met in January, I have vis- ited range men in Utah, New Mexico, Colorado, Oklahoma, California, Kansas, Nebraska, and Texas. Everywhere, I found a keen interest in Society affairs. Many members have appointed them- selves one-man committees to help in- crease the size of our organization, Oth- ers are at work helping to organize local sections to knit us closer together and everywhere, I found members determined to do everything possible to expand the influence of our Society. With this kind of interest and support, working to ad- vance the interests of the Society has in- deed been a pleasure.Immediately following our Denver meeting the newly-elected officers and Council members present met to consider policy matters and actions needed to carry on the affairs of the Society. The first order of business was to approve the ap- pointment of W. James Anderson, Bureau of Land Management, Washington, D. C., as Secretary of the Society. Jim took over these duties immediately and has been a tremendous help in handling the increasing correspondence, in working with Treasurer M. S. Morris in develop- ing the yearly budget, and in many other ways.
By early March, twelve committees had been appointed and were hard at work on Society business. Forty-seven individuals were asked to serve on these committees and it gives me real pleasure
to report that every member accepted this responsibility, despite the fact that most of them are exceedingly busy per- sons.
An Advertising Committee is investigat- ing the possibility of securing a business firm to solicit advertising for the Journal on a contract basis. It is expected that such an arrangement under terms satis- factory to the Society can be made and that some advertising will be obtained before the end of the year. This will strengthen our financial position and speed the time when we can shift from a quarterly, to a monthly Journal.
The Arrangements Committee is hard at work on the preliminary arrangements for our next annual meeting at San An- tonio, January 10-12, 1950. As our of- ficial headquarters for the meeting, the famous Gunter Hotel has agreed to fur- nish meeting and committee rooms with- out charge and our Texas members may be depended upon to show us an inter- esting time.
102 F. G. RENNER
duties in connection with the current is- sues of the Journal, is developing a set of far-reaching recommendations and stand- ards for future guidance of the Society’s publication. It is expected that these will not only facilitate their own efforts to improve the quality of the Journal, but will be helpful to prospective authors.
An Elections Committee has been ap- pointed to receive and count the ballots and report the results of the election of our next set of officers to be held this fall.
A Finance Committee is preparing a brochure about the Society for use in interesting foundations, corporations, and others in “contributing” and “sustaining memberships”. They are also working on plans to stimulate “life memberships” and report that one member has already disposed of his annual dues problem for all time by a contribution of $100.00.
The Incorporation Committee has en- listed the services of a public-spirited at- torney and is proceeding with action to get the Society incorporated in one of the western states.
A committee on Local Sections is study- ing the question of jurisdictional bound- aries and is preparing recommendations to the Society in this matter. They are also taking action to stimulate the forma- tion of additional sections. Thus far, local sections have been formed in Wyoming, Colorado, Utah, and Texas.
The Membership Committee has set up small sub-committees in each of the west- ern states, the eastern regions, and in Canada, and is’ coordinating their efforts in a strenuous attempt to meet the Council-approved goal of doubling our membership during the current year. In addition to this increase in general mem: bership, they expect to add at least twenty new stockmen-members from each of the seventeen western states. As of April 20, Treasurer Morris reports 104 new
members since *January 1, making our present total 857. Although this is a siz- able increase, we still have some dis- tance to go.
The Nominations Committee is giving careful consideration to a prospective slate of officers for 1950. All members are urged to take advantage of the pro- vision in our constitution which provides for nomination of candidates by petition. Such petitions should be submitted di- rectly to the committee chairman not later than August 1.
The Program Committee under the di- rection of our hard-working Vice Presi- dent is well along with its plans for the program of our next annual meeting. Advance information is that considerable emphasis will be given to actual accom- plishments in improvement and conserva- tion of the range and that a number of leading stockmen-members will appear on the program.
A REPORT FROM THE PRESIDENT 103
these will be found newsworthy and used in their papers and prgrams.
Committees appointed for this year are as follows :
ADVERTISING-A. L. m7hite, Chairman, B. W. Allred, David F. Costello, Fred
H . Kennedy.
ARRANGEMENTS-David Foster, Chair- man, R. D. Burr, James Parks, Vernon A. Young.
CunmcuLA-Wm. G. McGinnies, Chuir- man, H. R. Guilbert, L. E. Spence, L. A. Stoddart.
EDITORIAL BOARD-H. H. Biswell, Editor, F. W. Albertson, B. W. Allred, David F. Costello, Walter P. Cottam, Fred H. Kennedy, William C. Weir. ELEcTIoNs-Richard B. Millan, Chuir-
man, Thomas L. Kimball, Cal Taylor.
FINANCE-W. R. Chapline’, Chairman, 0. S. Aamodt, Henry Biederman, Grover F. Brown, Harold J. Burback, Bruce Orcutt .
INCORPORATION-Albin D. Molohon, Chairman, Floyd D. Larson.
LOCAL SECTIONS-Lynn H. Douglas, Chairman, Walter D. Armer, Wesley Keller, C. C. Waneka.
MEMBERSHIP-A. L. Hafenrichter, Chuir- man, C. Kenneth Pearse.
NOMINATIONS-E. R. Greenslet, Chuir- man, Robert V. Boyle, Enoch W. Nel- son, Paul H. Roberts.
PROGRAM-D. A. Savage, Chairman, H. M. Bell, T. Lommasson, Kenneth B. Platt, Jos. H. Robertson, Chester A. Williams.
.
Condition
and Management
of Range Land
Based on Quantitative
Ecology
E. J. DYKSTERHUIS
Range Division, Soil Conservation Service, Lincoln Nebraska
T
ODAY there are many different bases for range condition classifications. Stockmen commonly associate the term “range condition” with favorableness of the season. In this sense, good range condition may mean simply that an area recently received good rains. However, professional range conservationists have long associated good range condition with something less fleeting than good seasonal growth.In the glossary of technical terms pub- lished by the Society of American Fores- ters (11)) range condition is defined as “The state of health or productivity of both soil and forage of a given range, in terms of what it could or should be under normal climate and best practicable man- agement”. This article describes a sys- tem for determining range condition which considers climate, soil, and vegeta- tion both present and potential. It in- cludes a review of researches that pro- vide a scientific foundation for the system, and shows how earlier qualitative appli- cations have been replaced by quantita- tive ones. An actual example is used to demonstrate practical application of the system to range management.
REVIEW OF LITERATURE Most of the literature on range condi- tion classes was published within the past decade. In 1936 Talbot and Crafts (29) called attention to the need for simple, usable measures of range condition. Since then, Farmers’ Bulletins of the ,
ous mimeographed and processed publica- tions have popularized the idea of range condition classes. They have resulted in a new and better understanding of range condition by many ranchers and profes- sional conservationists. However, pop- ularized descriptions must eschew elab- oration of underlying principles and technical procedures. The descriptions themselves testify that many different bases for classification were used. Since the descriptions usually show a differ- ent floristic, or species, composition for each condition class and also associate range improvement with secondary plant succession, it is concluded that the con- cept of range condition classes dates back to research by Sampson (23, 24).
Sampson’s research published in 1919 after about 13 years of study in western United States, contains the conclusion that “The most rational and reliable way to detect overgrazing is to recognize the replacement of one type of plant cover by another.” Equally important was his conclusion, “The grazing value of the vegetative covers is essentially deter- mined by the stage of succession. Lo- cally, and indeed generally, the carrying capacity and forage value are the highest where the cover represents a stage in close proximity to the herbaceous climax and lowest in the type most remote from the climax.” This was application of the Clementsian concept of plant succession and climax to practical range problems. Later researches (5, 6,
14,
20, 21) cov- U. S. Department of Agriculture (13,22), ering both plant production and succes- and livestock journals as well as numer- sion showed differences in methods, asCONDITION AND MANAGEMENT OF RANGE LAND 105
well as in locale, but served to confirm Sampson’s (24) conclusions. While re- search was in progress, the idea of an ecologic classification of range conditions was generally accepted and put to exten- sive use (27). The “stage” concept of range degeneration of Sampson (24) mean- while had been transformed into range condition classes. Humphrey (19) traced early development of the use of range condition classes in forage surveys. He also presented one method of determin- ing range condition. There are now many ways of determining, as well as applying, range condition classes. Some no longer have the original ecologic ba- sis. This is true of classifications that do not depend upon position of the vege- tation in the scale of secondary succes- sion. For’example, one viewpoint is that range condition may be measured directly in terms of forage production. How- ever, ecologic research shows that forage production is generally only a reflection of range condition. Also, that “Range recovery is accomplished through second- ary succession” (12).
Attempts to apply the information on range condition classes reported in re- search and popular literature showed: 1) That different classes in the series for a site were either described qualitatively, or only selected examples were described quantitatively; 2) That quantitative data on classes were inadequate to cover var- iations in the vegetation encountered on a site, and; 3) That one description for each class of a series for a site was inade- quate because a site with one kind of veg- etation when in climax condition often had many kinds of vegetation when in poor condition. A quantitative system for determining range condition with res- pect to a climax evidently has not been published. However, some features of a quantitative system were presented at a joint session of the American Society
of Range Management and the American Society of Agronomy (16). The system has been in daily use since 1945 in field operations of the Soil Conservation Service throughout Oklahoma and Texas.
ECOLOGIC PRINCIPLES IN A &UANTITATIVE SYSTEM
Range condition might be defined at this point as “The percentage of the pres- ent vegetation which is original vegeta- tion for the site.” However, the defini- tion could have little meaning without a background of principles applied and al- ternatives discarded in practical field tests.
106 E. J. DYKSTERHUIS value because trends changed within pe-
riods of less than a year. On the other hand, maps of range conditions based on position in the subsere, or “stage” in secondary succession, provided useful in- ventory data.
Many problems were encountered in developing a uniform conception of areas that should be differentiated on maps. In any climate there are many soils and vegetation types, both climax and de- velopmental. The combination of cli- matic and soil conditions of an area may be referred to as site (8). Many kinds of vegetation may occur on the same site; depending upon the history of use of the vegetation. Range condition rat- ings were first applied to current forage types, even though these sometimes crossed important site or soil differences, Such differences became apparent when the range reached a higher condition. Since range condition expresses departure from potential for a site, it followed that delineation of sites had to precede delin- eation of range condition classes. It has been stated (18) that sites should be clas- sified on the basis of potential forage production. This would be the case if range condition classes were simply pro- duction classes. Attempts to base a quantitative system of range condition classification on potential production showed: 1) That there was often as much difference in forage production on one site from year to year as there was dif- ference between sites in the same year; 2) That relative coverage (species composi- tion) fluctuated less from year to year than forage production; 3) That cIi- maxes which are different floristically may produce essentially the same amount of forage per unit of surface area; and 4)
That in field operations, men could not classify a range with respect to potential production except as judged from relative coverage. Though there is a direct rela-
tion between range condition and produc- tion, the relation is general. Quantita- tive data are needed to show the specific relation for each site under different kinds and seasons of grazing. Accordingly, sites are now delineated on the basis of differences in relative coverage in the cli- max. In rare instances sites have been sub-divided because of differences in pro- duction within a map unit of climax vege- tation. In those rare cases where two or more sites have about the same species composition in the climax but differ in productivity
(14),
composition must still be considered to determine departures from potential. Differences in produc- tivity are recognized by recommending different stocking rates. Differences in range condition are recognized by com- paring present vegetation with Climax veg- etation.CONDITION AND MANAGEMENT OF RANGE LAND 107
azonal soils as potentially stable soils or sites, and consider the relatively stable plant community in equilibrium with such soils as climax. Summarily, the term cli- max as used here refers to climatic, eda- phic, or physiographic climaxes and is usually synomyous with original vegeta- tion. In early 194,5 our guides to range condition divided sites of each climatic belt between preclimax, climax, and post- climax sites, according to the climatic climax theory of Clements (IO). Our site classifications may still be grouped under these headings but the terms do not ap- pear on the guides. For any area a site separation is considered justified if: 1) There is a measurable difference in spe- cies composition of the climax or; 2) There is sufficient difference in productivity to justify recommending a different rate of stocking. Differences considered measur- able are indicated by field data in a later section. The climax vegetation of a re-, gion, as verified by scattered relicts on- comparable sites, shows far less variation than present range vegetation (15). The former is a product of soil and climate. The latter is a product of soil and cli- mate plus the particular kind and amount of grazing disturbance it has received. As would be expected, the site classification based on climax units has resulted in mapping fewer sites than range condi- tion classes.
It will be appreciated that if the cli- max for a certain site is forest, secondary succession would finally result in loss of grazing values. Accordingly, the concept being presented is limited to soils and climates where the climax vegetation is suitable for grazing; for example, grass- lands or savannahs. Perhaps the term “range land” should also be limited. to such sites. Natural pastures in poorly developed forest are commonly called forest range. If a classification of native pasture conditions is made in poorly de-
veloped forest, it would seem appropriate to determine whether secondary succes- sion would lead to Savannah or to forest. Areas where the climax is Savannah may show a great increase in woody plants after decades of overgrazing and may ap- pear like poor forest. Range degenera- tion and condition classes under such circumstances ha#ve been described for the Western Cross Timbers of Texas (15).
There are annual-plant ranges such as those of the granite basin of Texas, and the California foothills (4), where range management may logically be aimed at efficient use of annual-plant forage in its most productive condition. The best annual-plant range in these areas is evi- dently far from the climax. Accordingly, it would not be classified as range in ex- cellent condition under this system of classification though it might be excel- lent annual-plant range. Our goal in range management is not invariably ex- cellent range condition. Our goal may be a lower range condition, but it is under- stood that the concept of excellent range condition remains unchanged.
108 E. J. DYKSTERHUIS
lent condition. Range improvement on the poor pastures mentioned could be vis- ualized as movement upward from the ends of the spokes of the lower portion of a wheel, toward the hub, or climax. Consequently, the present system de- scribes only the climax or 100 per cent level of development of vegetation for a site. The 100 per cent level may not be reached under practical rates of stocking with domestic animals. Range condi- tion is measured by percentages of de- parture in any downward direction from the 100 per cent level.
NED GROUPING OF RANGE PLANTS A discussion of the ecologic basis for range condition classes in 1944 (3) pre- sented a diagram showing range deter- ioration as a curve downward from cli- max vegetation, to bare soil. This showed a departure from the stage, or stair-step, idea of range improvement. It was felt that segments of the curve from top to bottom should represent range condition classes. The counterparts of the stages of primary succession had not been read- ily discernible in secondary succession on range lands (14). All of the range con- ditions that could be found on a site at one time could seldom be related to a series of stages or steps because the more orderly processes of priseres are variously modified by grazing in range subseres. There remained a need for some means of quantitatively measuring position of a range on this curve rather than finding a series of stages or steps. This led to a new grouping of range plants. Among range men, the time-honored groups of plants were “Weeds, ” “Grasses and Grass- like Plants,” and “Shrubs.” In 1940, Smith (26) reported a classification of prairie species on the basis of behavior under range deterioration from climax. He listed species that had decreased in abundance, species that had increased,
invading species, and species more or less unaffected. In 1941, Weaver and Han- sen (31) reported a classification of plants based upon their response to grazing. They provided data on distribution and relative importance of six kinds of plants, namely, prairie grasses and prairie forbs that decrease under grazing, prairie gras- ses and prairie forbs that increase under grazing, and grasses and weedy forbs that invade pastures. Many ecologists pre- viously had observed that certain climax species might increase in abundance for a time under grazing.
These ecological classifications of spe- cies, based upon response to grazing were grouped and incorporated in a quantita- tive system of range classification by applying percentages of coverage to them and terming them ‘LDecreasers,” “In- creasers,” and “Invaders” (15). The “Decreasers” and “Increasers” being spe- cies of undisturbed and relatively stable ‘or climax plant communities, whereas the the “Invaders” are not. Though many invaders were present in the original veg- etation, they occupied disturbed areas such as mounds of burrowing animals. Overstocking with domestic livestock has since permitted them to occupy entire landscapes, where they are now often as- sociated with species not native to North America. The usefulness of the concept that all range plants belong to one of these groups is apparent.
CONDITION AND MANAGEMENT OF RANGE LAND 109
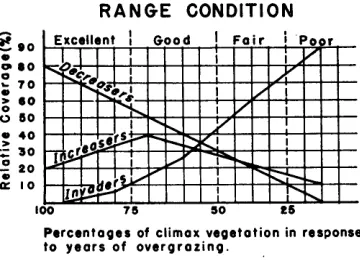
in relative coverage, species that decrease some in relative coverage after a period of increase, and species that are ultimately eliminated.” These and other data (12) showed that upward and downward movements along the curve of range im- provement and deterioration were con- tinuous series of changes in the relative proportions of decreasers, increasers, and invaders. Range condition classes may then be shown diagrammatically, as in- dicated in Figure 1.
In Figure 1, the course of degeneration is arbitrarily, but objectively, divided into four parts called excellent, good, fair, and
RANGE CONDITION
iit 90 : 00
0 & 70 z 60 0 60 = 40 ‘= 30 ,o 20 : IO
100 78 50 LS
Percentages of climax vegetation in response to years of overgrazing.
FIG. 1. DIAGRAM ILLUSTRATING A QUANTITA- TIVE BASIS FOR DETERMINING
RANGE CONDITION
poor, range condition. Since each is ac- tually a class of conditions, the term range condition class is appropriate. The ad- jective ratings and segments of curves intercepted may be varied without chang- ing the basis for the concept. As shown in Figure 1 the total of decreasers, in- creasers and invaders is always 100 per cent. The horizontal scale shows per- centage of decreasers plus the percentage of increasers prior to increase. It has been found practical to use relative cov- erage of decreasers, increasers, and in- vaders when estimated to the nearest five per cent (1). This relative coverage is based on the total of all foliage produced
in average years. Relative foliage pro- duction in pounds of air-dry weight might prove to be more satisfactory. These are but two of five distinctly different con- cepts in quantitative relations of vegeta- tion (2). It should be emphasized that annuals, as well as tree canopies beyond the reach of livestock, must be included in estimates of relative amounts of de- creasers, increasers, and invaders. There are good theoretical grounds for including all of the vegetation on a site rather than only perennials or forage within reach of livestock. Increase or invasion by an- nuals and woody plants are among the most common results of range depletion. The range concept of density is not used as a criterion of range condition in this system (1). Where range condition is based upon position in the subsere relative amount of various species is always more certain evidence of condition than density of total vegetation. Instances have been reviewed where a decrease in absolute density was associated with range im- provement and vice versa (28). Further- more, estimates of absolute coverage or total density and forage density have been found unreliable (25).
110 E. J. DYKSTERHUIS
soils under 42 inches of average annual haps 100 acres of very shallow upland, or precipitation in northeastern Oklahoma, Site 1. Your estimate of relative cov- to desert soils under 10 inches of average erage is indicated in the first column of annual precipitation near El Paso, Texas. figures in Table 2.
The technicians’ guide used here as rep- Reference to Table 1 shows sideoats resentative, was prepared for the general grama to be a decreaser in this climate vicinity of San Angelo, Texas. Mr. Ben and on these soils. Therefore, any 0. Osborn, Work Unit Conservationist, amount remaining represents a part of Soil Conservation Service, San Angelo, the original vegetation and counts toward
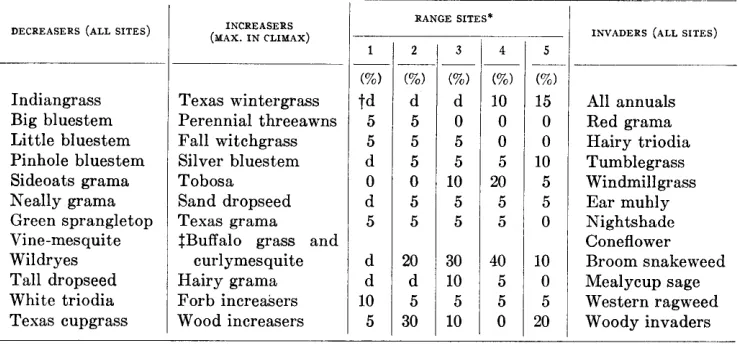
TABLE 1
Part I of “Technicians’ guide to condition and management of ranges in District Group 39, Soil Conservation Service, San Angelo, Texas, September 1947.”
(Key species, are grouped according to response to overstocking. Increasers in this climate are shown with their percentages of coverage in climax vegetation of various sites)
DECREASERS (ALL SITES)
Indiangrass Big bluestem Little bluestem Pinhole bluestem Sideoats grama Neally grama Green sprangletop Vine-mesquite Wildryes Tall dropseed White triodia Texas cupgrass
INCREASERS (MAX. IN CLIMAX)
Texas wintergrass Perennial threeawns Fall witchgrass Silver bluestem Tobosa Sand dropseed Texas grama IBuffalo grass and
curlymesquite Hairy grama Forb increahers Wood increasers
RANGE SITES*
(%I (%I (%I td d d
5 5 0
5 5 5
d 5 5
0 0 10 d 5 5 5 5 5
d 20 30
d d 10 10 5 5 5 30 10
2
_ 4
(%I 10 0 0 5 20 5 5 40 5 5 0 5 (%I 15 0 0 10 5 5 0 10 0 5 20
INVADERS (ALL SITES)
--
All annuals Red grama Hairy triodia Tumblegrass Windmillgrass Ear muhly Nightshade Coneflower Broom snakeweed Mealycup sage Western ragweed Woody invaders
* Site 1 = ‘Very shallow upland (Soil group 24~); Site 2 = Scrub-oak upland (Soils on which shin oaks are part of climax) ; Site 3 = Ordinary upland (Soil groups 24d, 17) ; Site 4 = Deep upland
(Soil groups 1 and 2; heavy clays) ; Site 5 = Draws and bottomlands (Soil group 4; overflow land). t “d” indicates that on this site the species is a decreaser rather than an increaser. $ Consider the two species together in estimating coverage. For sites 3,4, and 5 near 19-inch isohyet use 35, 50, and 15%, respectively, and near 29-inch isohyet use 25, 30, and 5% respec- tively.
Texas, provided most of the percentage values and described the sites. These were corroborated by examination of rel- icts. The portion of the guide used to determine site and range condition class is given in Table 1.
The data and the use of Table 1 may be best explained by applying it to a typic&l problem. Assume that you have exam- ined a native range, and on an aerial photo you have delineated the boundary of per-
CONDITION AND MANAGEMENT OF RANGE LAND 111
circumstances surrounding deterioration of t,his pasture. The five per cent is not abnormal for the site and is tallied. Cer- tain of the less palatable forbs associated with the original vegetation ordinarily increase for a time under deterioration. Such species now compose only five per cent of the total vegetation. However, they may have increased beyond 10 per cent of the total at some point in the course of range deterioration. Since the remaining five per cent represents five per cent of the climax vegetation it is tallied. Certain woody species were always pres- ent on this generally shallow site, though they were rooted in the relatively deep
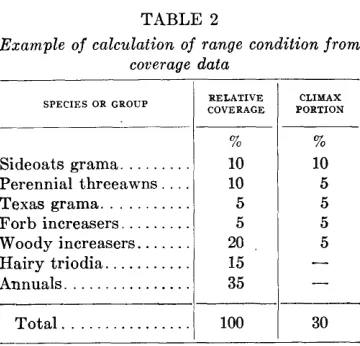
TABLE 2
Example of calculation of range condition from coverage data
SPECIES OR GROUP
Sideoats grama. ... Perennial threeawns. ... Texas grama. ... Forb increasers. ... Woody increasers. ... Hairy triodia. ... Annuals. ...
- ,
RELATIVE CLIMAX COVERAGE PORTION
% 10 10 5 5 20 15 35
% 10
5 5 5 5 - - --
30 Total . . . 100
-
_-
-
soils formed in joints of horizontal lime- stones. Under grazing, woody plants in- creased to 20 per cent of the total coverage. Originally, they composed not over five per cent and that amount is tallied. Hairy triodia and annuals were not found in recognizable amounts on areas of relict vegetation of this site. They are, there- fore, classed as invaders. Any percent- age of invaders represents an equal per- centage departure from climax vegetation. Hence, they are not tallied in the second column of figures. The total of this col- umn is 30 per cent. Reference to Figure 1 would place this range in the fair con- dition class.
In field practice, technicians, though following a guide such as this, mentally calculate departures from climax or add what remains of the climax, whichever is the smaller number. These calculations are made with sufficient accuracy to name the correct condition class almost in- stantaneously. Moreover, in describing higher and lower range conditions to the rancher it can be stated in terms of kinds and amounts of key plants which may be pointed out. Table 1 shows that on site 3 as much as 10 per cent of the vegetation may be tobosa when a range reaches top condition, even though some other species might be preferred by the rancher in what is agreed upon as the top condition. Likewise, the herbaceous species listed in Table 1 as invaders will be virtually elim- inated from the plant cover as a range improves even though the rancher is “sold” on certain annuals. This makes it necessary to explain how management of native ranges differs from management of tame pastures. On range, plants come in certain combinations indicated in Table 1. Figure 1 illustrates the principle. The guide utilizes indicator plants in the concept of Clements (9) who stated, “There can be no doubt that the commu- nity is a more reliable indicator than any single species of it. . . . The significant spe- cies are the dominants and subdominants which give character to definite commu- nities.” In Table 1, the term “key spe- cies” is used with this connotation. We endeavor to select the 30 to 40 key species, or groups of species, in each area. Any
112 E. J. DYKSTERHUIS
for classifying ranges and for interpreting common range phenomena.
The technicians’ guide, from which Table 1 was taken, shows recommended stocking rates for each site and condition on the lower half of the same page. This portion of the San Angelo, Texas, guide is here presented as Table 3.
Table 3 indicates grazing capacity for the top condition only. All other values are simply guides to appropriate stocking rates for rapid and obvious improvement in range condition. A presentation of the complete basis for the stocking rates is outside the scope of this article. Briefly, the recommended rates were based on
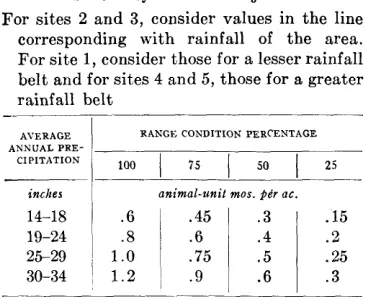
TABLE 3
Part II of technicians’ guide
For sites 2 and 3, consider values in the line corresponding with rainfall of the area, For site 1, consider those for a lesser rainfall belt and for sites 4 and 5, those for a greater rainfall belt
-
AVERAGE RANGE CONDITION PERCENTAGE
ANNUAL PRE-
CIPITATION 100 75
50
I 25 inches animal-unit mos. p6r ac.
14-18 .15
19-24 :fi ’ :“,” :i .2 25-29 i 1.0 .75 .5 .25 30-34 1.2 , .9 .6 .3
stocking experience locally and at experi- ment stations, supplemented where nec- essary with determination of differences in plant production associated with sites and condition classes within a belt of similar average annual rainfall. It n-ill
be understood that great droughts, ab- normally short or winter seasons of use, and other factors result in different rec- ommended rates. The only purpose of presenting Table 3 is to show how data on range condition are applied in making recommendations on stocking rates.
Assume that you were asked to rec-
ommend a rate of stocking for the 100 acres of very shallow upland which was found to be in fair (30 per cent) condition.
CONDITION AND MANAGEMENT OF RANGE LAND 113
described by Canfield (Y), have been used. One or more lines are used in a key area of a pasture. Their locations a.re de- scribed and the ends of the line are permanently marked with iron stakes. A string or wire may then be tied to the same stakes in later years. These perma- nent transects are commonly reread at intervals of two years. The first of such lines was established in 1943. Since then, hundreds have been established in Texas and Oklahoma. It will be underst)ood that these lines do not provide an ade- quate sample of the vegetation in the pasture. Rather, when reread they pro- vide quantitative data on range improve- ment and range deterioration between these two stakes. The transects are a rich source of basic ecological information. Their establishment and rereading has been one of our best devices for giving new personnel an intimate knowledge of the vegetation of their area.
SUMMARY
The development and use of systems for classifying range conditions was traced back to the researches of Sampson re- ported in 1919. “Common denomina- tors” of current systems appeared to be; a) recognition of secondary succession to- ward a climax type, and b) the use of floristic composition to indicate condition or position of a range in this succession. A review of basic research showed a direct though general relation between forage production and secondary succession.
The evolution of a quantitative system of range condit,ion classification was re- viewed, particularly the practical prob- lems encountered by field technicians and how these were resolved under widespread field trials. Such problems included; 1) distinction between tactors relating’ to trend in condition and factors determining condition at, any one time; 2) develop-
ment of a site classification not dependent on current vegetation so that both current and potential range conditions under the climax theory could be recognized; 3) dis- tinguishing between forage production as a purpose and forage production as a basis, for range condition classification; 4) recognizing that different principles apply when determining condition of range land and lands with forest climax; 5) recognizing that economic considera- tions may not justify restoration of excel- lent range condition in certain cases but not permitting this to influence the con- cept of excellent range condition; 6) making proper distinction between stages in plant succession and range condition classes; 7) replacing an empirical group- ing of range plants with an ecologic classi- fication namely, decreasers, increasers, and invaders, based on response to grazing; 8) quantitatively determining range con- ditions rather than quantitatively describ- ing selected conditions, and 9) displacing the widely used concept of “forage den- sity” with an expression of the quantita- tive relations of vegetation based on total annual foliage production.
114 E. J. DYKSTERHUIS
Quantitaitve guides are prepared by field terms used in forestry. Sot. Amer. For- esters, Mills Bldg., Washington, D. C. technicians for their local areas. The 12 CosTELLo
technicians are applying our accumulated ’
D F
. . 1939. Range ecology.
knowledge of ecology and the guides are U. S. Forest Service, Rocky Mt. Forest and Range Exp. Sta., Ft. Collins, Colo. easily revised to incorporate new findings Mimeo.
by research in vegetation science at ex- 13. COSTELLO, D. F., AND TURNER, G. T. 1944. periments stations, colleges, and univer- Judging condition and utilization of sities. One such guide, in use by range short-grass plains. U. S. D. A. Farmers’ Bul. 1949. ranges on the central great technicians in WeSiT Central Texas, k 14. DYKSTERHUIS, E. J. 1946. The vegeta_ presented, and its application is demon- tion of the Fort Worth Prairie. Ecol. strated by an example. Monog., 16: l-29.
15. DYKSTERHUIS, E. J. 1948. The vegeta-
LITERATURE CITED tion of the Western Cross Timbers. Ecol. Monog., 18: 325-376.
1. ALLRED, B. W. 1947. Range Fieldbook, 16. DYKSTERHUIS, E. J. 1948. Guide to con- Series III. U. S. D. A., Soil Conserva- dition and management of ranges based tion Service, Western Gulf Region, Fort on quantitative ecology. Abstracts of Worth, Texas. Mimeo. papers, Amer. Sot. Agron. App. Sec., 2. BAUER, H. L. 1934. The statistical anal- Mimeo. p. 25. Aug.
ysis of chaparral and other plant com- 17. FOSBERG, F. R. 1948. Economic botany munities by means of transect samples. -A modern concept of its scope. Econ. Ecology, 24: 45-60. Bot., 2: 3-14.
3. BELL, H. M. 1944. Range handbook. U. S. D. A., Soil Conservation Service,
18. HUMPHREY, R. R. 1947. Range forage evaluation by the range condition Western Gulf Region, Fort Worth, Texas. method. Jour. Forestry, 45: 10-16. Mimeo. pp 352-356. 19. HUMPHREY, R. R. 1949. Field comments 4. BENTLEY, J. R., AND TALBOT, M. W. 1948. on the range condition method of forage
Annual-plant vegetation of the Califor- survey. Jour. Range Management, 2 : nia foothills as related to range manage- l-11.
ment. Ecology, 29: 72-79. 20. PICKFORD, G. D., AND REID, E. H. 1942. 5. CAMPBELL, R. S. 1929. Vegetative suc- Basis for judging subalpine grassland
cession in the Prosopis sand dunes of ranges of Oregon and Washington. U. southern New Mexico. Ecology, 10: 392- S. D. A. Circ. 655.
398. 21. REID, E. H., AND PICKFORD, G. D. 1946. 6. CAMPBELL, R. S. 1931. Plant succession Judging mountain meadow range condi-
and grazing capacity on clay soils in southern New Mexico. Jour. Agr. Res., 43 : 1027-1051.
7. CANFIELD, R. H. 1941. Application of the line interception method in sampling range vegetation. Jour. Forestry, 39: 388-394.
8. CARPENTER, J. R. 1938. An ecological glossary. Univ. of Okla. Press, Norman. 9. CLEMENTS, F. E. 1928. Plant succession and indicators. The H. W. Wilson Co., New York City.
10. CLEMENTS, F. E. 1936. Nature and struc- ture of the climax. Jour. Ecol., 24: 252-284.
11. COMMITTEE ON FORESTRY TERMINOLOGY, R. C. HAWLEY, chairman. 1944. For- estry terminology, a glossary of technical
tion in eastern Oregon and eastern Wash- ’ ington. U. S. D. A. Circ. 748.
22. RENNER, F. G., AND JOHNSON, E. A. 1942. Improving range conditions for wartime livestock production. U. S. D. A. Farm- ers’ Bul. 1921.
23. SAMPSON, A. W. 1917. Succession as a factor in range management. Jour. of Forestry, 15 : 593-596.
24. SAMPSON, A. W. 1919. Plant succession in relation to range management. U. S. D. A. Bul. 791.
25. SMITH, A. D. 1944. A study of the relia- bility of range vegetation estimates. Ecology, 25 : 441-448.
CONDITION AND MANAGEMENT OF RANGE LAND 115
mixed-grass prairie of Oklahoma. Ecol- ogy, 21: 381397.
27. SPENCE, L. E. 1938. Range management for soil and water conservation. The Utah Juniper, 9: 18-25.
28. STODDART, L. A., AND SMITH, A. D. 1943. Range management. McGraw-Hill Book Co., Inc., New York and London, p. 261. 29. TALBOT, M. W., AND CRAFTS, E. C. 1936. The lag in research and extension. (in)
The Western Range. pp. 185-192. 74th Cong., 2d Session, Senate Dot. No. 199. 30. TANSLEY, A. G. 1939 The British Is-
lands and their vegetation. Cambridge at the University Press.
Reaction of a California Annual-plant
Community
to Fire
DONALD F. HERVEY
Colorado A & M College, Fort Collins, Colorado
T
HE occurrence of fires on annual- plant ranges of California poses a question to the range manager: How will the plant community react to burning and what will be the effects of fire on its grazing value?Hart, Guilbert, and Goss
(4)
investi- gated variations in chemical composition of forage from adjoining burned and un- burned areas in an attempt to explain the preference shown by cattle, sheep, and deer for the herbage of burned-over areas. They did not find either consistent or ap- preciable changes in the calcium, phos- phorus, or protein content of individual forage species and consequently concluded that other factors were involved in the matter of preference shown by the grazing animals. They did note that more filaree grew on the burned than unburned areas. They also noted that plants on unburned areas attained nearly twice the height of those on burned sites.Studies were made during the growing season of 1947-1948 on coastal foothill range lands near Berkeley, California, to determine the reaction of annual-plant communities to fire, particularly with respect to height growth, forage yield, and species composition. Four areas, each of which had been burned in July, 1947, were selected for study. They may be com- pared as follows :
AREA DESIGNATION
Pasture Pasture Pasture Pasture
I ... II. ... III ... IV ...
1
INTENSITY OF GRAZING USE DURING THE SEASON
PRIOR TO BURNING
Moderate to mod- erately light Ungrazed Moderate Heavy
NTENSITY OF TEE
FIRE
Light Light Heavy Light
The intensity of grazing use was deter- mined from unburned portions of the pas- tures; intensity of burns was determined from general knowledge of atmospheric and fuel conditions at the time of the fire.
Vegetation on the pastures consisted of an annual-plant mixture of grasses and forbs. It corresponded closely to typical central coastal foothill ranges described by Bentley and Talbot (1). The major grasses were wild oat (Avene futua), slen- der wild oat (Avene barbata), soft chess (Bromus mollis) , ripgut (Bromus rigidus), foxtail fescue (Festuca megaluru), Mediter- ranean barley (Hordeum gussoneanum), Italian rye grass (Lolium multiflorum), and mouse barley (Hordeum meguluru). The main forbs were red stem filaree (Ero- dium cicuturium), broad-leaf filaree (Ero- dium botrys), and bur clover (Medicago hispidu) .
The soils have been classified by the Bureau of Chemistry and Soils (2) at Los Osos adobe clay and clay loam. At depths of one to two feet the soil was underlaid with disintegrated sandstone. The upper few inches of soil showed pH of 6.0. Steepness of topography made these areas unsuited to cultivation.
REACTION OF A PLANT
region, yet a severe drought condition did not exist on the areas studied. The sea- sonal precipitation here for the period October 1, 1947 to May 1, 1948 was 20.39 inches. For a similar period during the past five years, precipitation averaged 22.60 inches and during the past ten years it averaged 27.96 inches.
Air temperatures dropped below 32°F. occasionally during December, January, and February, with the daily minimum generally reading between 30” and 40°F. during the months of November to April.
In Pasture I, duplicate exclosures, each 30 by 90 feet, were erected with their long
COMMUNITY TO FIRE 117
winter growth; and (3) at the time of forage maturity. On the other three pas- tures, estimates of species composition were made only at the time of forage ma- turity. Composition was based upon the percent of total foliage density made up by each species.
The burning resulted in an increase of forbs during the first season; this was least on the heavily utilized pasture
(Table 1). H owever, the unburned por- tion of this pasture also contained a rela- tively large percentage of forbs. The greatest increase in forbs as a result of fire occurred on the ungrazed pasture. V 1
TABLn I
Comparison of percentage of grasses and forbs present on adjoining burned and unburned portions of four pastures near Berkeley, California. Percentages are based upon foliage density at
time of plant maturity
LOCATION
Pasture I
Exclosure I ... Exclosure II ... Pasture II ... Pasture III ... Pasture IV. ... c__-
GRAZING TREATMENT BURN
PRIOR TO
Lightly grazed Moderately grazed Ungrazed
Moderately grazed Closely grazed
SEVERITY OF BURN
Light Light Light Heavy Light
PERCENT COYPOSITION
Forbs Grasses
Burn Unburn
- Burn Unburn
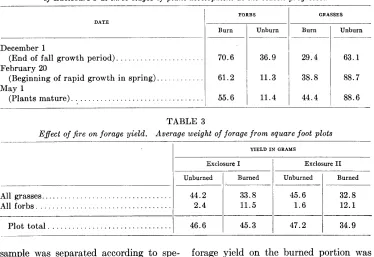
55.6 11.4 44.4 88.6 53.3 10.7 46.7 89.3 58.5 6.9 41.5 93.1 45.2 13.1 54.8 86.9 60.0 44.7 40.0 55.3
axes paralleling the fire-line and with equal areas of burned and unburned vege- tation included. By protecting the vege- tation of these two exclosures from graz- ing, comparison could be made of height growth and forage yield on adjoining burned and unburned areas. Compari- son was made of species.composition on burned and unburned areas in these two exclosures and also in the other three pastures.
EFFECT OF FIRE ON SPECIES COMPOSITION
Estimates were made of the species composition at three stages of growth in exclosures I and II: (1) at the end of rapid fall growth; (2) at the end of slow
On the unburned area a significant re- duction in forbs was noticed as the season progressed (Table 2). This change was brought about as a result of suppression of bur clover and filagrees by the grasses. On the burned area a similar reduction of forbs is indicated, yet in this case there was little or no actual suppression of bur clover and filarees. The change resulted from a more rapid increase in the foliage density of grass than that of forbs with neither class of plants seriously affecting the development of the other.
118 DONALD F. HERVEY
merely removing the surface litter by The reason why there was 26a/o less for- hand from strips within an ungrazed ex- age on the burned portion than on the un- closure. burned portion of Enclosure II, and prac-
EFFECT OF FIRE ON FORAGE YIELD tically burned no difference and unburned portions in yield of Enclo- between Forage yield was sampled during the sure I was not apparent. However, ob- first week in May when most of the vege- servations in the other three pastures tation was mature and just beginning to indicated that commonly a decrease in dry. On random square-foot plots all forage yield accompanies burning. herbaceous growth was cut at a height of Clipped samples were also taken in Pas- one-half inch above the ground. Each ture II, which was ungrazed. Here the
TABLE 2
Comparison of percentage of grasses and forbs present on adjoining burned and unburned portions of Exclosure I at three stages of plant development as the season progressed
DATE
December 1
(End of fall growth period). . . . . . . . . . February 20
(Beginning of rapid growth in spring). . . May 1
(Plants mature)...
FORBS GRASSES
Burn Unburn Burn Unburn
70.6 36.9 29.4 63.1
61.2 11.3 38.8 88.7
55.6 11.4 44.4 88.6
TABLE 3
E$ect of jire on forage yield. Average weight of forage from square foot plots
YIELD IN GRAMS
Exclosure I Exclosure II Unburned Burned Unburned Burned -__
All grasses... 44.2 33.8 45.6 32.8 All forbs... 2.4 11.5 1.6 12.1
- -- --
Plot total... 46.6 45.3 47.2 34.9
sample was separated according to spe- cies, then dried at 60” Centigrade for 24 hours, and weighed.
The difference in total forage yield between burned and unburned portions of Exclosure I, as shown in table 3, was not statistically significant; the difference in total forage yield between burned and un- burned portions of Exclosure II was sta- tistically significant, as are the differences between amount of grasses and forbs pro- duced on burned and unburned areas.
REACTION OF A PLANT COMMUNITY TO FIRE 119
TABLE 4
E$ect of fire on the yield of some important forage species. Comparison of mean air dry weight of clippings from square-foot plots
YIELD IN GRAMS
SPECIES LOCATION
Burn
I^
UnburnExclosure I 17.5 22.3”
Exclosure II 2.9 9.9
Exclosure I 0.8 3.1
Exclosure II 4.6 13.9
Exclosure I 7.1 11.8
Exclosure II 10.4 19.9
Exclosure I 5.0 0.5
Exclosure I 4.8 1.2
Exclosure II 1.0 0.5*
Exclosure II 9.1 0.8
Wild Oat Slender Wild Oat Soft chess
Italian Rye Grass
Bur Clover Red Stem Filaree
Broad Leaf Filaree
I
-
* Differences between burned and unburned sites not statistically significant for this sample. All others are significant.
TABLE 5
Average heights of important forage species on adjoining burned and unburned portions of Exclo- sures I and II
AVERAGE HEIGHT IN INCHES
_
Dec. 1, 1947 Feb. 20, 1948 May 1, 1948
FORAGE SPECIES
-
Excl. 1 Excl. 2 Excl. 1 Excl. 2 Excl. 1 Excl. 2
Wild Oat
Burn...
Unburn. . . . .‘. . Italian Rye Grass
Burn... Unburn... Foxtail Fescue
Burn...
Unburn . . . . . . . . . . . Soft Chess
Burn... Unburn... Bur Clover
Burn... Unburn... Red Stem Filaree
Burn...
Unburn . . . . . . . .
2.9 3.1 5.2 3.5 21.7 20.2
4.8 5.5 8.8 7.9 24.5 25.2
2.4 2.8 3.5 3.2 13.7 13.0
3.7 4.6 6.9 6.7 16.1 16.0
1.5 2.0 3.1 2.4 14.7 12.0
3.0 2.5 5.1 3.6 13.8 -
- 1.9 - 2.2 11.8 11.8
3.6 3.0 5.3 4.8 13.8 15.4
1.1 1.2 1.7 1.8 1.7 2.4
0.9 1.2 1.5 1.8 2.4 2.5
1.4 3.0
1.5 3.0
7.7 4.4 7.0 4.6
4.8 2.7 5.9 4.6
EFFECT OF FIRE UPON PLANT HEIGHTS The average height of forage plants was determined on 24 plots, each one foot square. These figures cover the growth made during three periods of the growing
120 DONALD F. HERVEY
EFFECT OF BURNING ON CERTAIN HABITAT FACTORS
Measurements were made of the effects of burning upon soil moisture, soil tem- perature, and organic matter in the top inch of soil. Summarized briefly, the re- sults are: (1) burning did not significantly affect soil moisture during the growing season; (2) burning did significantly raise the temperature at the soil surface and also at a depth of 29 inches; and (3) a single burning of annual-plant communi- ties did not significantly affect the amount of organic matter in the top inch of the soil. In the latter case, methods were used as reported by Hedrick (5).
DISCUSSION
Results indicate that burning of an- nual-plant ranges may affect grazing man- agement. Where yields are substantially reduced by burning, it may be expected that,t,he carrying capacit)y will be reduced accordingly. However, where yields are not substantially reduced by burning, the increase of bur clover may actually bring about an increase in carrying. capacity. This would result because of the fact that bur clover is a palatable legume which is higher in protein content than most grasses during the latter part of the grow- ing season. It also stays green later than many other annual forage plants. Even after the herbage becomes dry, the burs furnish high value protein feed (3).
To compensate for slower height devel- opment, either the grazing season should be delayed on burned areas, or fewer ani- mals placed on such areas until spring growth assures ample forage for the live- stock. The replacement of grasses by red stem filaree on burned areas where bur clover does not occur tends to shorten the length of the grazing season, since filaree matures about a month ahead of the
grasses. Upon maturing, filaree disinte-
grates, while grasses remain standing upon maturing and continue to be avail- able as forage.
SUMMARY AND CONCLUSIONS 1. Studies were made during the grow- ing season of 1947-l 948 on adjoining burned and unburned annual-plant ranges near Berkeley, California.
2. Composition of the plant cover was significantly changed by burning. Red stem filaree, broad-leaf filaree, and bur clover increased in response to burning, whereas wild oat, soft chess, ripgut, meadow barley, and Italian ryegrass de- creased.
3. The forage cover on four unburned areas consisted of approximately 90 per- cent grasses, while that on adjoining burned areas contained only 45 percent grasses. On a pasture which had been grazed heavily prior to burning, the change in percentage of grasses and forbs was not so great. Here, grasses composed 55 percent of the forage on unburned sites and 40 percent on burned.
4. On unburned sites, filarees and bur clover decreased significantly in abun- dance as the season progressed, while on burned sites they decreased only slightly.
5. Forage yield was less on burned por- tions of an exclosure than on those un- burned, but in another exclosure the yield. was similar for burned and unburned areas. Observations indicate that forage yield was significantly greater on un- burned portions of a moderately grazed pasture but only very slightly greater on unburned portions of a heavily grazed pasture.
6. Forage yields of important grass species were decreased by burning, whereas yields of important forbs were increased.
7. Burning caused a reduction in height To compensate for
REACTION OF A PLANT COMMUNITY TO FIRE 121
growth, either the grazing season should Soil survey of Contra Costa County, be delayed, or fewer animals placed on California. USDA. Bureau of Chemis- burned areas until spring. (3) GUILBERT, H. R. AND G. H. HART. 1946. try and Soils. Series 1933, No. 26.
8. An increase of red stem filaree in the California beef production. California forage cover of burned areas would reduce
forage availability early in the season and during summer. On the other hand, an increase in bur clover would raise the graz- ing value by providing higher protein feed than grasses.
Agricultural Experiment Station Circu- lar 131.
(4) HART, G. H., H. R. GUILBERT, AND H. Goss. 1932. Seasonal changes in the chemical composition of range forage and their relation to nutrition of animals. California Agricultural Experiment Sta- tion Bulletin 543.
LITERATURE CITED (5) HEDRICK, D. W. 1948. The mulch layer of California annual ranges. Journal of (1) BENTLEY, J. R. AND hf. W. TALBOT. 1948. Range Management 1: 22-25.
The Control of Bitterweed (Actinea
o&rata)
on Texas Ranges
OMER E. SPERRY
Department of Range and Forestry, Texas A & M College, College Station, Texas
M
ORE than sixty species of plants on Texas range lands have been proven poisonous to livestock. About twenty species are of major importance in specific areas and localities depending upon their abundance and development of growth. Poisoning usually occurs dur- ing seasons when range forage is scarce. Texas poisonous plants are chiefly native species which have increased in abun- dance and area with overgrazing of the ranges.Bitterweed (Actinea odor&a (DC) Kuntze) heads the list in importance and has been of concern in parts of Texas since the early nineteen twenties. Bit- terweed poisoning of sheep was first rec- ognized on the Edwards Plateau in 1922 and deductive evidence was directed to this weed in 1924 (1). Many sheep are still lost every year where bitterweed is abundant with a corresponding loss of wool clip and reduction in lamb crops. The recognition of bitterweed and its increase in abundance and area paralleled the increased stocking rates on the range areas of West Texas. Bitterweed is an annual of the sunflower family which may in moist areas attain a height of about 2 feet. It has numerous ascending branches which terminate in small heads (Fig.1). A single plant may produce more than a hundred flower heads and each head consists of more than fifty flowers, each of which is a potential seed pro- ducer. A single vigorous plant may thus produce more than 5000 seeds during its growing season. The leaves are alter- nate, once to thrice parted into thread-
like segments which are not ridged and are glandular dotted throughout. A characteristic of the plant is its aromatic odor and its bitter taste.
AREA OF INFESTATION
Bitterweed has been located in almost every county of Texas west of the 99th meridian. Its range extends into western Oklahoma, eastern and southern New Mexico, southern Arizona, southeastern California, and northern Mexico (4, 6). The area of heaviest infestation covers about 15 counties of the western portion of the Edwards Plateau (Fig. 2).
Within the area of greatest infestation, floods have been responsible for much of the spread of bitterweed. Drainage areas, lake beds, draws, and flooded sites are the usual places of infestation. Per- ennial vegetation is often killed out in these sites by standing water or by over- grazing and trampling and the bitter- weed takes over. It is also common along roadways, trails, bed grounds, headquar- ters, and watering places. Bitterweed has been rather recently introduced into new localities, especially in Southwest Texas by moving sheep from infested areas.
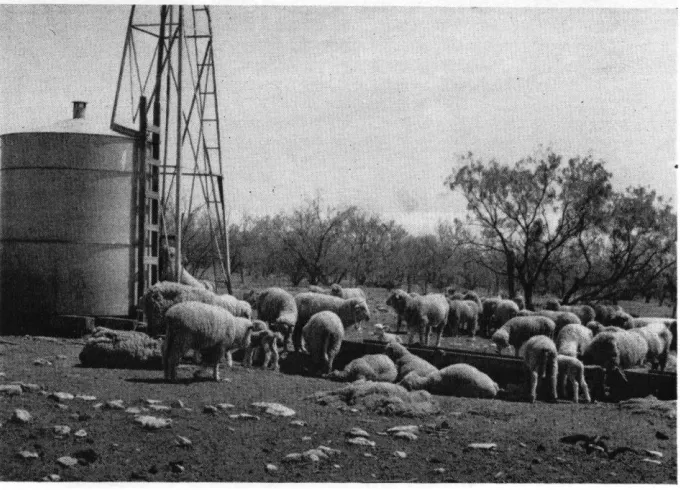
SHEEP LOSSES
124 OMEE E.
made in fifteen countiw in 1948 losses from one or a few animals were common, losses from 10 to 25 per cent were frequent, and a fox incidences of losst~s a~ great as 50 per cent, mostly from bitterwed, were recorded. Figure 3 show several dead animals around water in a severely over- grazed hitt~erweed pasture. Over 400 &rcp were lost on this ranch during the late spring and early summer of 1948.
SPERRY
ally a dark green discharge from the mouth and nose. A laggard gait and an arched hack indicating abdominal pain are the early symptomsof chronic fieldpoi- soning. Ranchmen find the first symp- toms usually hecomc obvious 7 to 12 days after sheep are placed in bitterweed in- fested pastures. Some animals may be- come sick earlier while ot,hers m&y not shorn signs of poisoning for 30 or 60 days.
In early feeding tests (4, 6) young bit- terwrrd plants amounting to 1.3 pzr cent of 111~ animal’s body n-right, fed in large dose, produced acute symptoms in a sin& day. Wbcn bittenwrd equaling 0.1 per rent of the body weight vas fed daily, chronic symptoms wcrc produced in 44 days.. Howvrr, uhw 0.25 pc, cent wns fed, the animals bcrame ex- tremrly sick in 17 days.
Thr usual symptoms of illness are loss of appetite, nnakness, depression, indi- cations of abdominal pain, and occasion-
Lambs appear to hc the first, and cl\-es t,hr last to show the poisoning symptoms.
CONTROL OF BITTERWEED ON TEXAS RANGES 125
the case in 1948 when the heaviest losses occurred in April and May.
CONTROL MEASURES
Numerous methods have been used in the attempt to control bitterweed or to overcome the sickness which results from eating the plant. Some methods have proven to be of little value, others show some merit, but those incorporating good range management practices have given definite results.
Short range due to overgrazing and drought combined with bitterweed have forced many operators to sell their sheep in much of the bitterweed country. In one county for example, 60 per cent of the bitterweed infested ranches have been cleared of sheep in recent years and have been restocked with cattle, goats or both. A precautionary measure that has been taken on several ranches is to fence off the worst bitterweed infestations and hand pull the remainder. On ranches where sites have been fenced 4 to 10 years, even in dry situations, perennial vegetation has completely crowded out the bitterweed.
An example of the ability of perennial vegetation to crowd out bitterweed was observed in two pastures, one of 400 acres and one of 10 sections, which had been rested for a period of 4 years. The re- duction of bitterweed the first and second years Was not noticeable but there was a marked improvement in the vigor of the grasses. During the third growing season the bitterweed showed a sharp decrease and, except for a few flooded and disturbed spots, all bitterweed had been crowded out by the perennial growth the fourth year.
All successful range management
pians
have envolved reduction in the stocking rate or the introduction of deferred or rotational grazing practices. In order that deferment and rotation could be car-ried out, most ranchmen have had to provide fencing to establish smaller pas- tures. In practice it has been found that small pastures, in which animals can be worked easily, are more adapted to a man- agement program than large pastures in which animals can not be closely ob- served. Units of one to four sections are found to be the most Workable.
On a 24-section ranch of 8 pastures and traps, a reduction in stocking and rota- tional-deferment grazing cleared the ranch of bitterweed in less than ten years. The better pastures were rested alternate growing seasons and the drier-upland units were given additional deferment. Some bitterweed seed washes on this ranch every year along a drainage area but plants that appear are hand pulled before they produce seed. The stock on this ranch are not only rotated in rela- tion to available forage but the animals are segregated according to their relative nutritional needs. To begin the program, the operator reduced stocking from 200 sheep and 20 cattle per section to 100 sheep and 8 or 10 cattle per section. This rate was maintained or slightly reduced during low rainfall years. The dividends of this lo-year program were clearly shown in 1948 by a 108 per cent lamb crop in which it was estimated that the lambs Would run 70 to 80 pounds. Ad- jacent ranches produced from 10 to 65 per cent lamb crops With most lambs run- ning from 60 to 65 pounds.