© 2018 IJSRCSEIT | Volume 3 | Issue 5 | ISSN : 2456-3307
Analysis on Big Data Using R Programming
Sangita1, Shagun2
1M. Tech. Scholar, 2Asstt. Professor
1,2Department of Computer Science & Engineering Manav Institutes of Technology & Management, Haryana,
India
ABSTRACT
Over the past decade, big data analysis has seen an exponential growth and will certainly continue to witness spectacular developments due to the emergence of new interactive multimedia applications and highly integrated systems driven by the rapid growth in information services and microelectronic devices. So far, most of the current mobile systems are mainly targeted to voice communications with low transmission rates. In the near future, however, big data access at high transmission rates will be. This is a result on accessible big-data systems that include a set of tools on R Studio and technique to load, extract, and improve dissimilar data while leveraging the immensely parallel processing power to perform complex transformations and analysis. “Big-Data” system faces a series of technical challenges.
Keywords : Big Data, IDC, NIST, Big Data, EMC.
I.
INTRODUCTIONMany people unfortunately focus just on the analysis/modeling phase: while that phase is crucial, it is of little use without the other phases of the data analysis pipeline. Even in the analysis phase, which has received much attention, there are poorly understood complexities in the context of multi-tenanted clusters where several users‟ programs run concurrently. Many significant challenges extend beyond the analysis phase. For example, Big Data has to be managed in context, which may be noisy, heterogeneous and not include an upfront model. Doing so raises the need to track provenance and to handle uncertainty and error: topics that are crucial to success, and yet rarely mentioned in the same breath as Big Data. Similarly, the questions to the data analysis pipeline will typically not all be laid out in advance.[2]
We may need to figure out good questions based on the data. Doing this will require smarter systems and
also better support for user interaction with the analysis pipeline. In fact, we currently have a major bottleneck in the number of people empowered to ask questions of the data and analyze it. We can drastically increase this number by supporting many levels of engagement with the data, not all requiring deep database expertise. The system may need to predict potential congestion points along a route chosen by a user, and suggest alternatives. Doing so requires evaluating multiple spatial proximity queries working with the trajectories of moving objects. New index structures are required to support such queries. Designing such structures becomes particularly challenging when the data volume is growing rapidly and the queries have tight response time limits.
BIG DATA:DEFINITION,HISTORY AND PARADIGMS
several definitions for “Big Data” are found in the literature, and three types of dentition play an important role in shaping how “Big Data” is viewed: [4]
1) Attributive Definition: IDC is a pioneer in studying “Big Data”science and its impact. It defines “Big Data” in a 2011 report that was sponsored by EMC (the cloud computing leader): „„Big data technologies describe a new generation of technologies and architectures [1], designed to frugally extract value from very huge volumes of extensive variety of data, by enabling high-velocity capture, discovery or analysis.‟‟
2) Comparative Dentition: In 2011, McKinney‟s report denned “Big Data” as „„datasets whose size is beyond the ability of typical database software tools to capture, store, manage, and analyze [1]‟‟. 3) Architectural Definition: The National Institute
of Standards and Technology (NIST) suggests that, „„“Big Data” is where the data volume, acquisition velocity, or data representation limits the ability to perform effective analysis using traditional relational approaches or requires the use of significant horizontal[5] scaling for efficient processing.‟‟
ABRIEF HISTORY OF BIG DATA
Considering the growth and intricacy of “Big Data”science systems, previous descriptions are based on a one-sided view point, such as chronology or milepost technologies. The history of “Big Data” is presented in terms of the data size of interest. Under this framework, the history of “Big Data” is tied closely to the capability of efficiently storing and managing larger datasets, with size boundaries expanding by orders of degree.
II.
Big Data Problem and ChallengesHowever, considering variety of data sets in “Big Data” problems, it is still a big challenge for us to purpose efficient representation, access, and analysis of shapeless or semi-structured data in the further
researches [12]. How can the data be preprocessed in order to improve the quality of data and analysis results before we begin data analysis [1] [2]? As the sizes of dataset are often very large, sometimes several gigabytes or more, and their origin from varied sources, current real-world databases are pitilessly susceptible to inconsistent, incomplete, and noisy data. Therefore, a number of data preprocessing techniques, including data cleaning [11], data integration, data transformation and date reduction, can be applied to remove noise and correct irregularities. Different challenges arise in each sub-process when it comes to data-driven applications.
III.
Principles for designing Big Data SystemIn designing “Big Data” analytics systems, we summarize seven necessary principles to guide the development of this kind of burning issues [3]. “Big Data” analytics in a highly distributed system cannot be achievable without the following principles [13]: 1) Good architectures and frameworks are necessary
and on the top priority.
2) Support a variety of analytical methods 3) No size fits all
4) Bring the analysis to data
5) Processing must be distributable for in-memory computation.
6) Data storage must be distributable for in-memory storage.
7) Coordination is needed between processing and data units.
BIG DATA OPPORTUNITIES
potential of harnessing “Big Data” to uncover the next wave of growth in their fields. There are many advantages in business section that can be obtained through harnessing “Big Data” increasing operational efficiency, informing strategic direction, developing better customer service, identifying and developing new products and services, identifying new customers and markets, etc.
BIG DATA ANALYSIS
The last and most important stage of the “Big Data” value chain is data analysis, the goal of which is to get useful values, suggest best conclusions and support decision-makingsystem of an organization to stay in competition market. [1]
PURPOSE AND CATEGORIES
Data analytics addresses information obtained through comment, measurement, or tests about a phenomenon of interest. The following lists only a few potential purposes:
1) To generalize and deduce the data and determine how to use it.
2) To check whether the data are genuine.
3) To give guidance and contributionin decision making system.
4) To identify and conclude reasons for fault. 5) To forecast what will occur in the future.
Descriptive Analytics: exploits historical data to describe what occurred in past. For instance, a regression technique may be used to find simple trends in the datasets, visualization presents data in a meaningful fashion, and data modeling is used to collect, store and cut the data in an efficient way. Descriptive analytics is typically associated with business intelligence or visibility systems [2].
Predictive Analytics: focuses on predicting future probabilities and trends. For example, predictive modeling uses statistical techniques [6] such as linear and logistic regression to understand trends and predict future out-comes, and data mining extracts
patterns to provide insight and forecasts [4].
Prescriptive Analytics: addresses decision making and efficiency. For example, simulation is used to analyze complex systems to gain insight into system performance and identify issues and optimization techniques are used to find best solutions under given constraints.
IV.
Big Data Classification Algorithm There are three algorithms:-1) Decision Tree 2) Random Forest
3) Support Vector Machine
Decision tree learning uses a decision tree as a predictive model which maps observations about an item to conclusions about the item's target value. It is one of the predictive modelling approaches used in statistics, data mining and machine learning. Tree models where the target variable can take a finite set of values are called classification trees. In these tree structures, leavesrepresent class labels and branches represent conjunctions of features that lead to those class labels. Decision trees where the target variable can take continuous values are called regression trees.In decision analysis, a decision tree can be used to visually and explicitly represent decisions and decision making. In data mining, a decision tree describes data but not decisions; rather the resulting classification tree can be an input for decision making [23].
V.
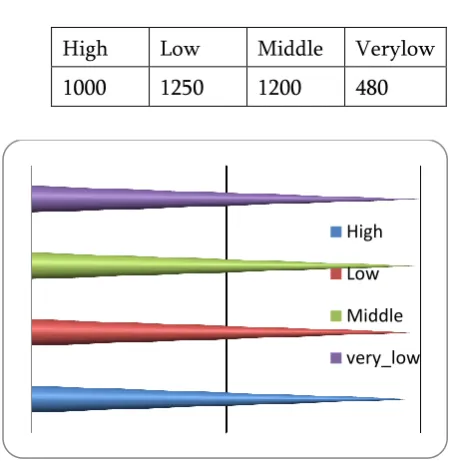
R ProgrammingTABLE 1 Values of Births
High Low Middle Verylow
1000 1250 1200 480
FIGURE 1:Frequency of Factors (Line Chart)
Considering the growth and intricacy of “Big Data” science systems, previous descriptions are based on a one-sided view point, such as chronology or milepost technologies. The history of “Big Data” is presented in terms of the data size of interest.
BIG DATA ANALYSIS
The last and most important stage of the “Big Data” value chain is data analysis, the goal of which is to get useful values, suggest best conclusions and support decision-making system of an organization to stay in competition market. [1]
FIGURE 2:Matrix of scatter plots
Above Figure , the barplot for each leaf node shows the probabilities of an instance falling into the births 2000 to 2014 .
Table 2 Test
Test High Low Middle Very_low
High 1000 0 10 0
Low 0 1250 50 50
Middle 10 10 1100 0
Very_low 0 0 0 400
Figure 3 Decision Tree on test data
Above Figure , the line graph for each test shows the probabilities of an instance falling into the births 2000 to 2014 .
Table 3 Data History
High
Low
Middle
very_low
TRADITIONAL
DATA BIG DATA
VOLUME GB
CONSTANTLY
UPDATED (TB OR
PB) Generated
Rate Per hour, day, More rapid
Structure Structured Semi- structured
or un-structured
Data Source Centralized fully distributed
Data
Integration Easy Difficult
Data Store RDBMS HDFX, No SQL
Access Interactive Batch or near
VI.
ConclusionAs we have entered an era of “Big Data” which is the next frontier for innovation, competition and productivity, a new wave of scientific revolution is about to begin. Fortunately, we will witness the coming technological leapfrogging. In this survey paper, we give a brief overview on “Big Data” problems, including “Big Data” opportunities and
challenges, current techniques and
technologies.There is no doubt that “Big Data” Therefore, more scientific investments from both governments and enterprises should be poured into this scientific paradigm to capture huge values from “Big Data”.
VII.
REFERENCES
[1]. Andrew Crotty, Alex Galakatos, Kayhan Dursun, Tim Kraska, Ugur Cetintemel, Stan Zdonik, “Tupleware: “Big” Data, Big Analytics, Small Clusters”, 2016
[2]. Jennifer Ortiz, Victor Teixeira de Almeida, Magdalena Balazinska, “Changing the Face of Database Cloud Services with Personalized Service Level Agreements”, 2015
[3]. Anant Bhardwaj1, Souvik Bhattacherjee2, Amit Chavan2 Amol Deshpande2, Aaron J.
Elmore1,3, Samuel Madden1, Aditya
Parameswaran, “DataHub: Collaborative Data Science & Dataset Version Management at Scale”, 2015
[4]. Challenges and Opportunities with Big Data [5]. Hongbo Zou, Yongen Yu, Wei Tang, Hsuan-
Wei Michelle Chen, “Flex Analytics: A Flexible Data Analytics Framework for Big Data
Application with I/O Performance
Improvement”, Elsevier 2014
[6]. Alekh Jindal, Robust Data Transformations, 2015
[7]. Radu Tudoran, “High-Performance Big Data Management Across Cloud Data Centers”, Jan 2015
[8]. Bill Howe, “Big Data Science Needs Big Data Middleware”, Jan 2015
[9]. Burt L. Monroe , Jennifer Pan , Margaret E. Roberts, Maya Sen , Betsy Sinclair, “No! Formal Theory, Causal Inference, and Big Data Are Not Contradictory Trends in Political Science”, American Political Science Association, 2015 C.L. Philip Chen, Chun-Yang Zhang, “Data intensive applications, challenges, techniques and technologies: A survey on Big Data” Information Science 0020-0255 (2014), PP 341-347, elsevier
[10]. Han hu1At. Al. (Fellow, IEEE),” Toward Scalable Systems for Big Data Analytics: A
Technology Tutorial”, IEEE
2169-3536(2014),PP 652-687
[11]. Shweta Pandey, Dr.VrindaTokekar,”
Prominence of MapReduce in BIG DATA Processing”, IEEE (Fourth International Conference on Communication Systems and Network Technologies)978-1-4799-3070-8/14, PP 555-560
[12]. Katarina Grolinger At. Al.“Challenges for MapReduce in Big Data”, IEEE (10th World Congress on Services)978-1-4799-5069-0/14,PP 182-189
[13]. Zhen Jia1 At. Al.“Characterizing and Subsetting Big Data Workloads", IEEE 978-1-4799-6454-3/14, PP 191-201
[14]. AvitaKatal, Mohammad Wazid, R H Goudar, “Big Data: Issues, Challenges, Tools and Good Practices”, IEEE 978-1-4799-0192-0/13,PP 404-409
[15]. Du Zhang,” Inconsistencies in Big Data”, IEEE 978-1-4799-0783-0/13, PP 61-67
Congress on Big Data) 978-0-7695-5006-0/13, PP 403-410
[17]. Lei,Wang At. Al., “BigDataBench: aBig Data Benchmark Suite from Internet Services”,IEEE 978-1-4799-3097-5/14.
[18]. AnirudhKadadi At. Al., “Challenges of Data Integration and Interoperability in Big Data”, IEEE (International Conference on Big Data)978-1-4799-5666-1/14, PP 38-40
[19]. SAS, Five big data challenges and how to overcome them with visual analytics
[20]. HajarMousanif At. Al., “From Big Data to Big Projects: a Step-by-step Roadmap”, IEEE (International Conference on Future Internet of Things and Cloud) 978-1-4799-4357-9/14, PP 373-378
[21]. Tianbo Lu At. Al., “Next Big Thing in Big Data: The Security of the ICT Supply Chain”, IEEE (SocialCom/PASSAT/BigData/EconCom/BioMe dCom) 978-0-7695-5137-1/13, PP 1066-1073 [22]. Ganapathy Mani, NimaBarit, Duoduo Liao,
Simon Berkovich, “Organization of Knowledge Extraction from Big Data Systems”, IEEE (4 Fifth International Conference on Computing for Geospatial Research and Application) 978-1-4799-4321-0/14, PP 63-69
[23]. Joseph Rickert, “Big Data Analysis with Revolution R Enterprise”, 2011