Screening and identification of specific markers for bladder
transitional cell carcinoma from urine urothelial cells with
suppressive subtractive hybridization and cDNA microarray
Cite as: Can Urol Assoc J 2011;5(6):E129-E137; http://dx.doi.org/10.5489/cuaj.09118. Epub 2011 Jan 13.
Abstract
Objective: The objective of this study was to screen and identify differentially expressed genes in invasive bladder transitional cell carcinoma (BTCC).
Methods: Voided urine samples were collected from consecutive patients with BTCC and patients under surveillance for bladder cancer recurrence; voided urine samples from patients with non-malignant diseases served as control. We identified the differen-tially expressed genes by comparing urine samples of bladder carcinoma to that of the control group with suppressive subtract-ive hybridization (SSH) and cDNA microarray. The differentially expressed genes were verified by quantitative real-time polymerase chain reaction (QPCR).
Results: From the 762 white colonies, a total of 449 positive clones were obtained in which 112 were found to be upregulated in BTCC. Sequencing and homology analysis were performed for these 112 clonies. The detection rates of some known genes (including IGF-1, human telomerase reverse transcriptase [hTERT], bladder cancer specific nuclear matrix protein 4 [BLCA-4] and homeobox A13 [HOXA13]) for BTCC at the Ta, T1 and >T1 stages were 48%, 90% and 100%, respectively, with a specificity of 85%. The test specificity was 80% for the 30 control patients with urinary tract infections. The combination of BLCA-4 and HOXA13 could distinguish between low- and high-grade tumours, with specificity and sensitivity of 80%. Conclusion: We successfully constructed a reliable SSH library of BTCC and found that combination detection insulin-like growth factor 1 (IGF-1), hTERT, BLCA-4 and HOXA13 genes could help to evaluate BTCC at different stages.
Introduction
Bladder transitional cell carcinoma (BTCC) is the fourth
com-mon cancer worldwide.1 The 5-year relative survival rate is
about 6% for patients with an advanced stage of bladder
cancer.1 Cystoscopy and biopsy of suspected lesions have
been regarded as the gold standard in the diagnosis of blad-der cancer and in the follow-up of these patients. A variety
of studies have focused on developing new non-invasive methods for the diagnosis of bladder cancer and monitoring the progression of the disease. New biomarkers that would increase the detection rate of transitional cell carcinomas (TCCs) before bladder muscle layer invasion would reduce TCC-related morbidity and mortality. Although the detection of telomerase and hyaluronic acid phyaluronidase in the urine is sensitive and specific, their role in bladder cancer
still requires validation through multicentre clinical studies.2
Therefore, it is important to find the specific biomarkers for bladder cancer which may improve the early diagnosis and effective postoperative follow-up.
Recent studies using high-throughput microarray analysis have shown that cDNA expression is helpful in discrimin-ating bladder tumours from normal urothelium at different
stages or grades.3,4 The detection of gene expression in the
urine may be promising in the diagnosis of TCC and would provide more information for clinical practice. With the rapid development of molecular biotechnology, the combina-tion of SSH and cDNA microarray, with its high efficiency, specificity and rapidity, has become feasible in the screen-ing bladder cancer-related genes. However, screenscreen-ing with urine samples has not been reported. In the present study, we constructed subtractive cDNA library with urine exfoli-ated cells to screen differentially expressed genes in patients with BTCC and to identify some urine markers for BTCC. Additionally, the relationship between these markers and bio-logical behaviours of BTCC, including stage, grade, invasion and metastasis, relapse and recurrence, was also analyzed.
Patients and methods
Clinical samples
All samples were collected from patients treated at the Department of Urology, People’s Hospital of Gansu Province (China) from 2005 to 2008. The staging of cancer was based
on the TNM classification5 and the grading was based on
the World Health Organization criteria;6 these classifications
were independently reviewed by 2 pathologists blinded to our study. Voided urine samples were obtained from consecutive patients with BTCC; 32 TCC samples were obtained by cold-cup biopsy during transurethral resection, and 40 samples were from patients under surveillance for bladder cancer recurrence. Eighty-three voided urine samples were obtained as part of the control group; bladder tumours in these patients were excluded by flexible cystoscopy. These control patients were diagnosed with urinary tract infections (n = 30), other nonmalignant uro-logical diseases (including benign prostate hyperplasia, uroli-thiasis) and neurogenic bladder (n = 53). The mean age of the patients in the TCC and control group was 72 and 69 years, respectively. Eighty-six percent of TCC patients and 76% of con-trol patients were male. Written informed consent was secured according to the local ethical guidelines.
Construction of cDNA library for SSH
A total of 200 mL of midstream urine was obtained from patients with TCC before the surgery; the urine from the con-trol patients was collected in the morning. Total RNA of urine exfoliated cells was extracted using the acid guanidium
thio-cyanate-phenol-chloroform method.7 The integrity of the total
RNA was displayed on 1% formaldehyde denatured agarose gel. cDNAs were synthesized with 1 μg of total RNA using SMART Polymerase chain reaction (PCR) cDNA synthesis kit (Clontech Laboratories, Inc., Mountain View, CA), according to the manufacturer’s instructions. The first strand of cDNA purified by phenol/chloroform was used to generate double-stranded cDNA. DIG-11-dUTP-labelled cRNA was synthe-sized using the Enzo RNA Transcript Labeling Kit (Clontech, Palo Alto, CA), according to the manufacturer’s protocol.
The double-stranded cDNAs were divided into 2 groups: tester group and driver group. The cDNA were digested with
Hae Ⅲ at 37℃ for 6 hours. The cDNA of the tester group was
then subdivided into 2 parts which were ligated to different
cDNA adaptors (adaptor 1, adaptor 2) at 16℃ for 20 hours
followed by inactivation at 70℃ for 10 minutes. The ligation
efficiency was greater than 25% which was verified by PCR with GAPDH (Forward: 5’-TTAGCACCCCTGGCCAAG-3’; Reverse: 5’-CTTACTCCTT GGAGGCCAT-3’) and CR1 (5’-CTAATACGACTCACTATAGGGC-3’). Subtractive hybridization was performed using PCR-Select cDNA Subtraction Kit (Clontech Laboratories, Inc., Mountain View, CA); we then ran the PCR amplified twice with CR1 and nested primers to reduce the background and enrich the differentially expressed cDNA sequence. PCR products were visualized in 1% agarose gels after amplification at 15, 25 or 35 cycles. The subtractive library was constructed through T/A PCR cloning with Advantage PCR cloning kit (Clontech Laboratories, Inc., Mountain View, CA), according to the manufacturer’s recommendations. In brief, 2 μL of SSH PCR products containing enriched differentially expressed transcripts were cloned into the PGM-T vector (Invitrogen,
Carlsbad, CA) at 16℃ for 20 hours, and transformed into E.
coli JM109 competent cells (BioTeke, Beijing, China). The
transformed E. coli JM109 were placed on the agar plate
containing the ampicillin resistance gene (Amp), X-gal, and isopropyl-beta-D-thiogalactopyranoside (IPTG) followed by
incubation at 37℃ for 18 hours. White colonies were selected
and alkaline lysis was performed to extract the recombinant plasmids. The exogenous fragments inserted in the plasmid were confirmed to set up forward-subtracted cDNA library (BTCC exfoliated urothelial cells for the tester group, normal as the driver group) and reverse-subtracted cDNA library (normal for the tester group, BTCC as the driver group).
Microarray analysis
DIG-11-dUTP-labelled fragmented cDNA was first hybrid-ized to the forward/reverse subtractive PCR products of recombinant plasmid. The quality of each probe was detected through hybridizing it to a control (blank) nylon
membrane which was prehybridized at 68 ℃ for 30 minutes
under continuous agitation followed by the hybridization
with the probe at 68℃ overnight under continuous
agita-tion. The membrane was rinsed with sodium citrate and sodium dodecyl sulfate (SDS). The microarrays were then automatically rinsed and stained with BCIP and NBT in an affymetrix genechip fluidics station and gray scales were scanned with a GeneArray Scanner (Affymetrix Inc, Santa Clara, CA). The images were analyzed using established quality control measures. Centroid clustering was performed for an unsupervized hierarchical analysis of the selected genes with the fold change greater than 2. The selected genes were further sequenced with unsupervized hierar-chical clustering based on the standard correlation for the logarithmically transformed data and homology analysised in the GenBank to classify those genes based on defined categories of molecular function and biological processes
by using the Expressed Gene Anatomy Database (EGAD).8
Quantitative real-time PCR analysis
To verify the results of the SSH, the expressions of genes and glyceraldehyde 3-phosphate dehydrogenase (GAPDH) were evaluated with quantitative real-time PCR (QPCR) analysis in patients with BTCC, other urological cancers or nonmalig-nant urological diseases. In brief, the total RNA of urothel-ial cells was extracted using Trizol Reagent (Invitrogen Life Technologies, Carlsbad, CA), according to the manufacturer’s instructions. One microgram of total RNA was used to gener-ate cDNA using Superscript II reverse transcriptase (Invitrogen Life Technologies, Carlsbad, CA). PCR primers were designed to amplify products of 250bp to 400 bp. QPCR was per-formed as previuosly described with ABI Prism 7000 series
QPCR (Corbett Research, Sydney, Australia).9,10 The
for all markers. The relative copy number was calculated with the concentration-CT standard curve method followed
by normalization with the average expression of GAPDH.11
Western blot analysis
A total of 60 μg of protein was loaded onto 10% SDS-polyacrylamide gel electrophoresis (PAGE) and transferred to a polyvinylidene difluoride membranes (Millipore, Watford,
UK) which were incubated with primary antibodies at 4℃
overnight, followed by horseradish peroxidase conjugated mouse anti-human or monoclonal anti-mouse IgG (1:5000) for 1 hour at room temperature. The signal was detected with an enhance chemiluminescene (ECL) western blotting detection kit (ZhongShan Co., Beijing, China). The expres-sion levels were determined through normalization with the
corresponding β-actin (42 kD) to validate the correlation
between the mRNA and proteins.
Statistical analysis
Changes in CT values in QPCR were used to determine the classification score through Fisher linear discriminant analy-sis (LDA). This analyanaly-sis generates a formula (the linear dis-criminant, LD1) that is a linear combination of changes in CT values and can be used to discriminate between 2 types of samples (i.e., non-BTCC vs. BTCC). LD1 was determined for each marker or combination of markers using 10 rounds of 10-fold cross-validation to test performance. The sensitivity and specificity, as well as 95% confidence interval (CI), were obtained using the LD1 values (for each marker or combina-tion of markers) and the distribucombina-tion of these values across training runs. The 95% CI for sensitivity at a given specific-ity was obtained by calculating the 95% confidence limit for the cut-off value (corresponding to that specificity) fol-lowed by calculation of the 95% CI for the sensitivity at the extreme cutoff values. The LD1 values of each sample were assumed to be normally distributed across different training runs. All analyses were done with the R package for statistical
computing.12 The LDA and logistic regression (generalized
linear model) analysis was performed with the MASS pack-age, receiver operating characteristic (ROC) curve, and ROC package was used to analyze the sensitivity and specificity.
Results
SSH library and its subtractive efficiency
To ensure the high quality of RNA used for the construction of SSH library, we determined the integrity of total RNA with gel electrophoresis. The ratio of 28s to 18s RNA was greater than 2:1, suggesting high quality in the extracted RNA (Fig. 1, part a). To evaluate the subtraction efficiency, we used subtracted
and unsubtracted cDNA pools as templates to amplify GAPDH (about 500 bp). The PCR products were displayed in the aga-rose gels. The intensity of GAPDH band in subtracted samples was more profound at 35 cycles compared with that of unsub-tracted samples, which was in line with the criteria (require-ment) of the kit (Fig. 1, part b). After ensuring that the house-keeping gene had been extensively removed in the subtraction reactions, we cloned the forward and reverse-subtracted
cDNA into PGM-T vector and transformed it to E. coli JM109.
Totally, 762 white colonies were selected from the X-gal/IPTG ampicillin (100 μg/mL) agar plate. To evaluate the diversity of the inserted cDNA fragments and the positive rate of SSH library, we amplified the inserts with PGM-T vector sequenc-ing primers (F: 5’-CGCCAGGGTTTTCCCAGTCACGAC-3’; R: 5’-AGCGGATAACAATTTCACA CAGGA-3’), using each clone of the cDNA subtractive library as the template. The size of the inserted fragment was between 100 and 700 bp (Fig. 1c, Fig. 1d). Out of the 762 tested colonies, 449 contained insert fragments, which suggests an approximate 59% positive rate of the SSH library.
cDNA array hybridization and bioinformatic analysis
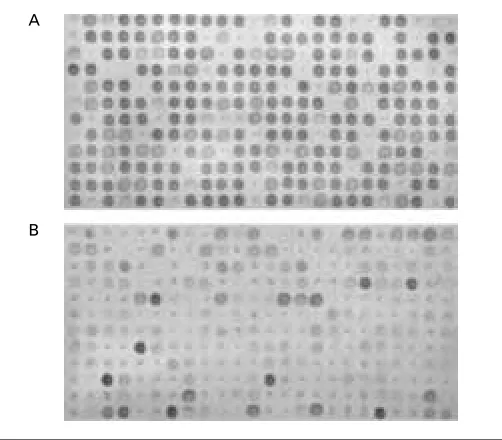
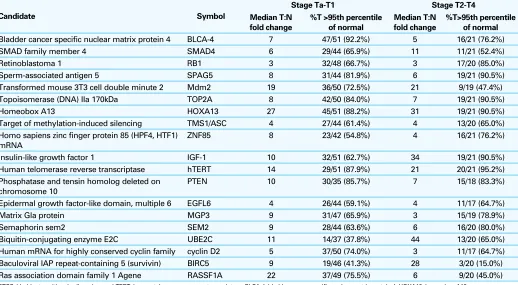
Four hundred and forty-nine clones were dot-blotted on 18 × 12 cm nylon membrane using manual microarrayer, and probed with reverse transcribed DIG-labeled cDNA. The results demonstrated that there were 246 and 63 differentially expressed genes in forward library (BTCC group) and reverse library (control group), respectively (Fig. 2). The strength and accuracy of the filtered genes with fold change >2 were esti-mated with leave-one-out cross validation based on Fisher’s exact test after analysis. After initial screening, 112 clones were identified with upregulation in patients with BTCC. The selected genes were further sequenced, and homology analy-sis was performed as an additional validation to the micro-array. The results indicated real upregulation of these genes in patients with BTCC. DNA sequence comparison with the GenBank database was performed to analyze the similarity between 112 sequences. The results indicated these genes involved 78 genes, which exhibited a variety of functions. No housekeeping gene or DNA contamination was observed, suggesting the high quality of the SSH library. On the basis of the EGAD database, genes involved in the cell immunity and regulation of cell cycle signal transduction, DNA bind-ing, transcription and transfer, protein synthesis, cytoskeleton movement and metabolism were found to be the target genes which might play different role in the development of BTCC. For convience of publication, only 19 genes with fold change greater than 3 were presented in Table 1.
Selection of potential diagnostic markers
change >3. Cluster analysis revealed that the refined genes formed clusters on the basis of their sensitivity to early diag-nosis of BTCC that also successfully identified bladder car-cinoma at different stages or grades.
To test the abundance of these markers in urine, QPCR was carried out using total RNA extracted from the urine sample of patients with confirmed BTCC and control group. The human runt-related transcription factor (RUNX3) and bladder cancer specific nuclear matrix protein 4 (BLCA-4) exhibited the highest median upregulation in both stage >T1 tumours and stage Ta to T1 tumours. Topoisomerase II A (TOP2A) and cell division cycle 2 (CDC2) showed the high-est median upregulation in both stage >T1 tumours and stage Ta to T1 tumours, and also showed the least overlap between normal and tumour tissues, and their expressions in 93% of >T1 tumours and 88% of Ta to T1 tumours were greater than the 95th percentile of the expression in normal uro-thelium. Ras association domain family l Agene (RASSF1A) showed high median upregulation in normal samples, but poor overall separation between tumours and normals, with only 45% of the T2 to T4 tumours with expressions greater than 95% of the normal samples. Four candidate mark-ers, insulin-like growth factor 1 (IGF-1), human telomerase reverse transcriptase (hTERT), BLCA-4 and homeobox A13 (HOXA13) showed greater upregulation in stage Ta to T1 tumours than in stage >T1 tumours, with the greatest dif-ferential expression of BLCA-4 and HOXA13.
Based on the reproducibility of real-time PCR, we deter-mined the genes to be included in further difference analy-sis of marker accumulation between BTCC patients and controls. IGF-1, hTERT, BLCA-4 and HOXA13 were finally
chosen for the further analysis of both BTCC detection and stratification of patients with low- or high-risk disease.
QPCR analysis
QPCR was performed to detect the candidate markers (IGF-1, hTERT, BLCA-4 and HOXA13). In addition to assessing the performance of individual marker, we used LDA to develop
Fig. 1. Construction and identification of SSH library. A. Total RNA quality assay. B. Detection efficiency of SSH. C. Part of gene fragments in forward subtractive cDNA library. D. Part of gene fragments in reverse subtractive cDNA library. M: 100 bp DNA ladder; M’: DL 2000 DNA ladder; 1-23: Part of the amplified product of plasmid cDNA.
A 1 2 3
28s–
18s–
5s–
B M S15 U15 S25 U25 S35 U35
500bp–
C M 1 2 3 4 5 6 7 8 9 10 11 12 13 14 15 16 17 18 19 20 21 22 23
500bp–
D 1 2 3 4 5 6 7 8 9 10 11 12 M’ 13 14 15 16 17 18 19 20 21 22 23
500bp– 250bp– 100bp–
Fig. 2. Part of cDNA library array hybridization. A. Hybridization of forward subtractive PCR products with DIG-labeled cDNA probes in BTCC urine samples. B. Hybridization of reverse subtractive PCR products with DIG-labeled cDNA probes in normal samples.
A
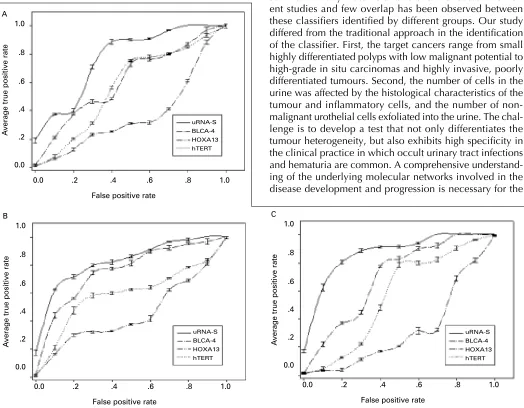
a multivariate analysis that consisted of all 4 markers (des-ignated uRNA-D). Sensitivities and specificities for each marker and uRNA-D were determined and the character-istics of each analysis were further evaluated using ROC curves. Because of the potential effects on the analysis of characteristics of samples from patients with urinary tract infections, sensitivities and specificities were analyzed in the absence or presence of 30 samples from patients with infection. Figure 3 illustrates the ROC curves for the detec-tion of BTCC of stage Ta to T1, stage >T1, grade 1, grade 2, and grade 3 in the absence of these samples (72 BTCC and 53 normal controls). The sensitivity of each marker and the combination analysis with uRNA-D in this cohort of 72 BTCC and 53 normal controls, with a specificity of 85%, are shown in Table 2. At this specificity, hTERT and IGF-1 were unique markers with the highest sensitivity for high-stage/high-grade BTCC. 87% of grade 3, tumours, 90% of stage T1 tumours and 100% of stage >T1 tumours could be detected with hTERT.
At the same specificity used in Table 3, the inclusion of patients with infection into the non-BTCC control group had minor effects on the sensitivity of BLCA-4, HOXA13 and IGF-1. BLCA-4 and HOXA13 showed small improve-ments in sensitivity and hTERT showed no more than a 3% loss in performance for cancers of any stage or grade. There was, however, a significant change in IGF-1 with an aver-age 10% of decrease in sensitivity across the different staver-ages
and grades. The effect of uRNA-D was intermediate for the single marker analysis, showing 2% and 5% decrease in the sensitivity of detection of BTCC of grade 1 to 2 and grade 3, respectively (Table 4). Analysis of ROC curves, generated from the 72 BTCC samples and either the 53 noninfection controls or the 30 infection samples alone, confirmed that infection samples have no negative effects on overall sensitivity of BLCA-4 and HOXA13 in the 80% to 100% specificity range and only a minor effects on IGF-1 and uRNA-D (Fig. 4).
The specificity of each marker and uRNA-D for the dif-ferent non-BTCC control groups is shown in Table 4. When the specificity for all control samples was set at 85%, the specificity for the infection samples alone ranged from 75% for BLCA-4 to 100% for HOXA13; uRNA-D exhibited an intermediate specificity for the 80% of infection samples. No significant difference in the marker specificities was found between patients with non-BTCC cancers and benign urin-ary tract diseases. In summurin-ary, these results indicated that the combination of these markers (IGF-1, hTERT, BLCA-4 and HOXA13) leads to a better sensitivity than the analysis with one marker alone. In each case, the greatest accuracy in discriminating difference classes was provided through the introduction of HOXA13 and BLCA-4 to the analysis. At 80% specificity, this combination (designated uRNA-S) showed 42% and 73% in accuracy when differentiating low-grade from high-grade or stage Ta from stage T2 to T4, respectively.
Table 1. cDNA microarray analysis of candidate BTCC markers
Candidate Symbol
Stage Ta-T1 Stage T2-T4 Median T:N
fold change
%T >95th percentile of normal
Median T:N fold change
%T>95th percentile of normal
Bladder cancer specific nuclear matrix protein 4 BLCA-4 7 47/51 (92.2%) 5 16/21 (76.2%)
SMAD family member 4 SMAD4 6 29/44 (65.9%) 11 11/21 (52.4%)
Retinoblastoma 1 RB1 3 32/48 (66.7%) 3 17/20 (85.0%)
Sperm-associated antigen 5 SPAG5 8 31/44 (81.9%) 6 19/21 (90.5%)
Transformed mouse 3T3 cell double minute 2 Mdm2 19 36/50 (72.5%) 21 9/19 (47.4%)
Topoisomerase (DNA) IIa 170kDa TOP2A 8 42/50 (84.0%) 7 19/21 (90.5%)
Homeobox A13 HOXA13 27 45/51 (88.2%) 31 19/21 (90.5%)
Target of methylation-induced silencing TMS1/ASC 4 27/44 (61.4%) 4 13/20 (65.0%)
Homo sapiens zinc finger protein 85 (HPF4, HTF1) mRNA
ZNF85 8 23/42 (54.8%) 4 16/21 (76.2%)
Insulin-like growth factor 1 IGF-1 10 32/51 (62.7%) 34 19/21 (90.5%)
Human telomerase reverse transcriptase hTERT 14 29/51 (87.9%) 21 20/21 (95.2%)
Phosphatase and tensin homolog deleted on chromosome 10
PTEN 10 30/35 (85.7%) 7 15/18 (83.3%)
Epidermal growth factor-like domain, multiple 6 EGFL6 4 26/44 (59.1%) 4 11/17 (64.7%)
Matrix Gla protein MGP3 9 31/47 (65.9%) 3 15/19 (78.9%)
Semaphorin sem2 SEM2 9 28/44 (63.6%) 6 16/20 (80.0%)
Biquitin-conjugating enzyme E2C UBE2C 11 14/37 (37.8%) 44 13/20 (65.0%)
Human mRNA for highly conserved cyclin family cyclin D2 5 37/50 (74.0%) 3 11/17 (64.7%)
Baculoviral IAP repeat-containing 5 (survivin) BIRC5 9 19/46 (41.3%) 28 3/20 (15.0%)
Ras association domain family 1 Agene RASSF1A 22 37/49 (75.5%) 6 9/20 (45.0%)
The sensitivity in discriminating grade 1 to 2 BTCC from high-risk BTCC, which had progressed to either grade 3 or stage T2 to T4, was 82% (Fig. 4, part c). These findings suggested that IGF-1, hTERT, BLCA-4, HOXA13 and their combination could provide greater sensitivity than single marker and also provide a means to differentiate low-grade Ta tumours from those either with high grade or with an invasive phenotype.
Western blot validation
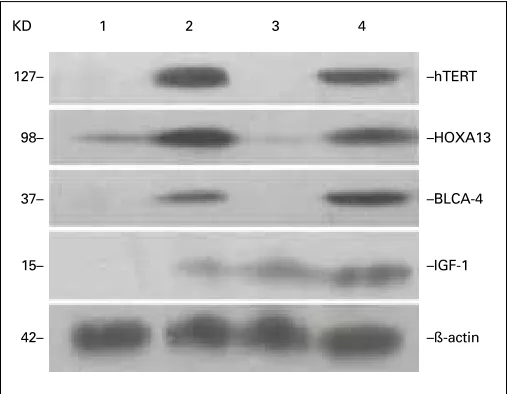
Western blot analysis was used as an additional validation of the microarray analysis and as a way to find potential markers for early diagnosis of BTCC. The levels of IGF-1, hTERT, BLCA-4 and HOXA13 proteins, of which the genes were up-regulated by more than 3 folds, were determined using independent sample analysis (Fig. 5). The expression of
Table 2. Specificity of individual markers and uRNA-D
Test positives/total true positives* (%) positives (%)Cytology
IGF-1 hTERT BLCA-4 HOXA13 uRNA-D
Control group 14/83 (16.9%) 19/83 (22.9%) 14/83 (16.9%) 1/83 (1.2%) 16/83 (19.3%) 0/83 (0%)
BTCC group 61/72 (84.7%) 65/72 (90.3%) 65/72 (90.3%) 64/72 (88.9%) 65/72 (90.3%) 61/72 (84.7%)
Overall 85% 85% 85% 85% 85% 80%
*True positives were defined as samples from patients who were positive for BTCC by flexible cystoscopy and biopsy. BTCC: bladder transitional cell carcinoma; hTERT: human telomerase reverse transcriptase; BLCA-4: bladder cancer specific nuclear matrix protein 4; HOXA13: homeobox A13.
Fig. 3. ROC curves for the detection of stage Ta~T1 tumours (A), stage T2~T4 tumours (B), grade 1~2 tumours (C), and grade 3 tumours (D). Seventy-two TCC and 53 non-TCC samples were used in each analysis. The dotted vertical lines in A and C mark 90% specificity.
IGF-1, hTERT, BLCA-4 and HOXA13 proteins was elevated in exfoliated urothelial cells of patients with BTCC, while no expression was observed in normal urine samples. All results demonstrated a good correlation between the mRNA and protein expression.
Discussion
Several studies have focused on microarray based on the classifiers for the prediction of characteristics of bladder
cancer such as stage,13,14 progression,15 recurrence16 and
survival.17 Many classifiers have been validated in
differ-ent studies and few overlap has been observed between these classifiers identified by different groups. Our study differed from the traditional approach in the identification of the classifier. First, the target cancers range from small highly differentiated polyps with low malignant potential to high-grade in situ carcinomas and highly invasive, poorly differentiated tumours. Second, the number of cells in the urine was affected by the histological characteristics of the tumour and inflammatory cells, and the number of non-malignant urothelial cells exfoliated into the urine. The chal-lenge is to develop a test that not only differentiates the tumour heterogeneity, but also exhibits high specificity in the clinical practice in which occult urinary tract infections and hematuria are common. A comprehensive understand-ing of the underlyunderstand-ing molecular networks involved in the disease development and progression is necessary for the
Table 3. Sensitivity of detection of BTCC at 85% specificity by stage and grade using individual markers and the combined as-say uRNA-D
BTCC
presentation n
Mean percentage (95% confiden ceinterval) Cytology
positives (%)
IGF-1 hTERT BLCA-4 HOXA13 uRNA-D
Stage Ta 31 52 (50-54) 66 (64-69) 91 (89-94) 34 (32-35) 68 (67-69) 4/31 (13%)
The mean sensitivities and 95% confidence intervals determined by LDA and cross-validation are shown. Fifty-three non-BTCC samples were included in this analysis. BTCC: bladder transitional cell carcinoma; hTERT: human telomerase reverse transcriptase; BLCA-4: bladder cancer specific nuclear matrix protein 4; HOXA13: homeobox A13.
Fig. 4. ROC curves showing the discrimination between grade 1/2 tumours and grade 3 tumours (A), stage Ta~T1 tumours and stage T2~T4 tumours (B), and grade 1/2 tumours and either grade 3 or stage T2~T4 tumours (C).
development of new treatments and, as a molecular diag-nostic approach, it may also be a promising supplement to the conventional pathological classification.
We constructed SSH library which contained differen-tially expressed cDNA fragments between urine exfoliated cells of BTCC patients and health controls. The quality of cDNA library is of importance in screening the differentially expressed genes. To avoid any selection biases and ensure adequate information had been screened, we used RNA pool from 10 BTCC patients and the integrity of the total RNA was determined. Identification of library subtractive efficiency confirmed that GAPDH delayed more than 10 cycles, indi-cating that the genes with non-specific expression were sig-nificantly inhibited. The SSH library was further screened using DIG-labelled PCR amplification products as probe and 87 upregulated genes were confirmed. After integrating information from EGAD database and hierarchical clustering analysis of the selected genes, this appeared to be a series of complicated molecular events in the development of BTCC.
Highly sensitive QPCR has already demonstrated its abil-ity to determine the stage and grade of tumours and to dis-tinguish malignant tumours from benign tumours. Among the highly overexpressed epithelial genes selected for QPCR analysis, 4 markers were further verified, particularly in the tumours of T1 to T4. The results showed a good correlation in the data between the microarray and PCR. Genes, such as IGF-1, which is involved in cell growth and prolifera-tion and is a potent inhibitor of programmed cell death, showed high expression across most of the tumours
exam-ined.18 The expression of hTERT, however, was variable
and its upregulation was only observed in a fraction of the
tumours.19 HOXA13, a transcriptional factor, is involved in
the morphogenesis and differentiation of the genitourinary
tracts.20 BLCA-4 is a bladder cancer specific nuclear matrix
protein, which is the cancellated component and affects diverse processes including development, differentiation,
and survival of cancer cells.21,22 Our findings indicated the
expression of HOXA13 and BLCA-4 was elevated in stage Ta tumours, which was consistent with the literature. The levels of IGF-1, hTERT, BLCA-4 and HOXA13 proteins were also examined with Western blots. The expressed proteins and their mRNA of the target genes were highly correl-ated in the exfolicorrel-ated urothelial cells of BTCC and control patients, indicating a strong correlation in the data between the microarray and protein analysis.
ROC curves showed that, in the 90% to 100% specificity range, HOXA13 and BLCA-4 showed better performance in the detection of Ta/low-grade tumours than either IGF-1 or hTERT. In contrast, IGF-1 and hTERT were closely related with the highly invasive and high-grade tumours. To develop a test with strong performance for both early- and late-stage cancers, LDA was used to develop algorithms that incorporated all 4 markers. The combined test, uRNA-D, showed more sensi-tive or specific than any individual gene. The sensitivity of uRNA-D was higher than urine cytology across all stages and grades of BTCC as uRNA-D detected 90% of stage T1 cancers (with 85% specificity) compared with 40% by cytology (Table 2). This performance difference would be slightly attenuated by the higher specificity of cytology, which, although not available for these series, was typically 95%. With this caution
Table 4. Sensitivity of detection of BTCC at 85% specificity by stage and grade in the presence of samples from patients with urinary tract infections
BTCC presentation n Mean percentage (95% confidence interval)
IGF-1 hTERT BLCA-4 HOXA13 uRNA-D
Stage Ta 31 48 (45-49) 65 (62-66) 92 (90-94) 40 (38-40) 67 (65-68)
Stage T1 15 65 (64-67) 90 (90-90) 90 (90-90) 40 (36-40) 89 (86-89)
Stage T2~T4 26 80 (80-80) 100 (100-100) 80 (80-80) 100 (100-100) 100 (100-100)
Grade 1 32 62 (60-64) 80 (79-83) 97 (95-97) 49(47-50) 67 (66-69)
Grade 2 24 68 (65-69) 88 (85-88) 93 (89-93) 44 (44-44) 61 (61-61)
Grade 3 16 77 (75-80) 93 (90-93) 80 (78-82) 46 (44-46) 94 (90-94)
The mean sensitivities and 95% confidence intervals determined by LDA and cross-validation are shown. All 83 non-BTCC samples, including the 30 infection samples, were included in the analysis. BTCC: bladder transitional cell carcinoma; hTERT: human telomerase reverse transcriptase; BLCA-4: bladder cancer specific nuclear matrix protein 4; HOXA13: homeobox A13.
Fig. 5. Validation of microarray analysis by Western blotting.ß-actin as loading control. IGF-1, hTERT, BLCA-4 and HOXA13 expression levels showed that the protein levels were consistently overexpressed in BTCC tissues, and unde-tected (or overexpressed just a little) in normal tissues.1, 3: normal tissues. 2, 4: BTCC tissues.
KD 1 2 3 4
127– –hTERT
98– –HOXA13
37– –BLCA-4
15– –IGF-1
in mind, comparison of the data presented here with those published suggested that uRNA-D might have better perform-ance than the UroVysion fluorescence in situ hybridization (FISH) assay in the detection of primary TCC at equivalent specificities: uRNA-D detected 60 % and 92% of primary Ta and primary T1 tumours, respectively, compared with the
59% and 73% detected by the FISH assay.23-25 Compared
with the UroVysion FISH assay, uRNA-D had comparable performance across grades. Because the characteristics of TCC patients and controls were different in a variety of studies, the reported results would be only used as references in the screening of TCC patients with these markers.
The presence of blood or inflammatory cell contamina-tion is one of the limitacontamina-tions in the clinical applicacontamina-tion of many bladder cancer screening tests including urine
cytol-ogy, BTA-Stat, and NMP22.26,27 To explore the feasibility of
urine sample as a source of tumour cells for the determination of gene expression signature, HOXA13-BLCA-4 (uRNA-S) was used. Given the known inaccuracy in discriminating
BTCC of stage Ta from those of stage T1 with clinical utility,28
the actual accuracy of uRNA-S for the prediction of stages may exceed that which was observed here. The prediction of stage or grade at the time of initial screening may enable patients with suspected BTCC to receive urgent cystoscopy. Though the results presented here are required to be fur-ther validated in future studies, particularly in patients with hematuria and other urological conditions, our findings have value in the clinical application.
Conclusion
In conclusion, the present study analyzed the differentially expressed genes in urine exfoliated urothelial cells with SSH and cDNA microarray which provided a new and comprehen-sive expression profile of BTCC. It presented us a RNA-based test in the diagnosis and initial characterization of bladder cancer with urine. Because of the flexibility and scalability of cDNA microarray detection platforms, the detection may be extended to determine additional transcripts which may enhance the test performance and provide more information.
*The First Affiliated Hospital of Lanzhou University, Lanzhou, China; †School of Life Science, Lanzhou
University, Lanzhou, 730000, China; ±Department of Urology, People’s Hospital of Gansu Province,
Lanzhou 730000, China
Acknowledgements: This work was supported by a grant from National Torch Plan projects of China (No. 2007GH540021). We are grateful to all staff of Department of Urology, People’ s Hospital of Gansu Province, for their work in patient data collection and manuscript preparation, and we also greatly appreciate Dr. Qianglin Duan, a skilled English proofreader from Tongji Hospital of Tongji University, for English usage and paper revision.
Competing interests: None declared.
This paper has been peer-reviewed.
References
1. Jemal A, Siegel R, Ward E, et al. Cancer statistics, 2008. CA Cancer J Clin 2008;58:71-96. 2. Saad A, Hanbury DC, McNicholas TA, et al. The early detection and diagnosis of bladder cancer: A critical
review of the options. Eur Urol 2001;39:619-33.
3. Sanchez-Carbayo M, Socci ND, Lozano J, et al. Defining molecular profiles of poor outcome in patients with invasive bladder cancer using oligonucleotide microarrays. J Clin Oncol 2006;24:778-89. 4. Van Le TS, Miller R, Barder T, et al. Highly specific urine-based marker of bladder cancer. Urology
2005;66:1256-60.
5. Sauter G, Algaba F, Amin M, et al. WHO Classification of Tumour of urinary system and male genital organs. Lyon: IARCC Press; 2004.
6. Sobin DH, Witteking CH. TNM Classification of Malignant Tumour. New York, NY: Wiley-Liss; 2002:199-202. 7. Varanasi NL, Baskaran I, Alangaden GJ, et al. Novel effect of voriconazole on conidiation of Aspergillus
species. Int J Antimicrob Agents 2004;23:72-9.
8. GenBank Overview. http://www.ncbi.nlm.nih.gov/genbank/. Accessed January 4, 2011. 9. Wall SJ, Edwards DR. Quantitative reverse transcription-polymerase chain reaction (RT-PCR): a comparison
of primer-dropping, competitive, and real-time RT-PCRs. Anal Biochem 2002;300:269-73. 10. Schmittgen TD, Livak KJ. Analyzing real-time PCR data by the comparative C (T) method. Nat Protoc
2008;3:1101-8.
11. Bubner B, Baldwin IT. Use of real-time PCR for determining copy number and zygosity in transgenic plants.
Plant Cell Rep 2004;23:263-71.
12. R package for statistical computing. http://www.r-project.org/. Accessed January 4, 2011. 13. Wild PJ, Herr A, Wissmann C, et al, Gene expression profiling of progressive papillary noninvasive
carcin-omas of the urinary bladder. Clin Cancer Res 2005;11:4415-29.
14. Blaveri E, Simko JP, Korkola JE, et al, Bladder cancer outcome and subtype classification by gene expres-sion. Clin Cancer Res 2005;11:4044-55.
15. Dyrskjøt L, Zieger K, Kruhøffer M, et al. A molecular signature in superficial bladder carcinoma predicts clinical outcome. Clin Cancer Res 2005;11:4029-36.
16. Dyrskjøt L, Thykjaer T, Kruhøffer M, et al. Identifying distinct classes of bladder carcinoma using microarrays.
Nat Genet 2003;33:90-6.
17. Sanchez-Carbayo M, Socci ND, Lozano J, et al. Defining molecular profiles of poor outcome in patients with invasive bladder cancer using oligonucleotide microarrays. J Clin Oncol 2006;24:778-89. 18. Serel TA, Turan T, Soyupek S, et al. Urine and serum free IGF-1 levels in patients with bladder cancer: a
brief report. Urol Res 2003;31:297-9.
19. Xie XY, Yang X, Zhang JH, et al. Analysis of hTERT expression in exfoliated cells from patients with bladder transitional cell carcinomas using SYBR green real-time fluorescence quantitative PCR. Ann Clin Biochem 2007;44:523-8.
20. Scott V, Morgan EA, Stadler HS. Genitourinary functions of Hoxa13 and Hoxd13. J Biochem
2005;137:671-6.
21. Van Le TS, Myers J, Konety BR, et al. Functional characterization of the bladder cancer marker: BLCA-4.
Clin Cancer Res 2004;10:1384-91.
22. Tan SH, Bartsch D, Schwarz E, et al. Nuclear matrix proteins reflect cell type of origin in cultured human cells. Proc Nacl Acad Sci USA 1998;85:121-5.
23. Bayani J, Squire JA. Application and interpretation of FISH in biomarker studies. Cancer Letters
2007;249:97-109.
24. Kipp BR, Tanasescu M, Else TA, et al. Quantitative fluorescence in situ hybridization and its ability to predict bladder cancer recurrence and progression to muscle-invasive bladder cancer. J Mol Diagn
2009;11:148-54.
25. Bubendorf L, Grilli B, Sauter G, et al. Multiprobe FISH for Enhanced Detection of Bladder Cancer in Voided Urine Specimens and Bladder Washings. Am J Clin Pathol 2001;116:79-86.
26. Serretta V, Lo Presti D, Vasile P, et al. Urinary NMP22 for the detection of recurrence after transurethral resection of transitional cell carcinoma of the bladder: experience on 137 patients. Urology 1998;52:793-6. 27. Thomas L, Leyh H, Marberger M, et al. Multicenter trial of the quantitative BTA TRAK assay in the detection
of bladder cancer. Clin Chem 1999;45:472-7.
28. Maruniak NA, Takezawa K, Murphy WM. Accurate pathological staging of urothelial neoplasms requires better cystoscopic sampling. J Urol 2002;167:2404-7.