R E S E A R C H
Open Access
Kernel PCA feature extraction and the SVM
classification algorithm for multiple-status,
through-wall, human being detection
Wei Wang
*, Min Zhang, Dan Wang and Yu Jiang
Abstract
Ultra-wideband (UWB) radar with strong anti-jamming performance and high-range resolution can be used to separate multiple human targets in a complex environment. In recent years, through-wall human being detection with UWB radar has become relatively sophisticated. In this paper, the method of kernel principal component analysis (KPCA) feature extraction and the support vector machine (SVM) classification algorithm are applied to identify and classify the multiple statuses of through-wall human being detection. This method makes full use of the KPCA of powerful, nonlinear feature extraction and SVMs, which can solve the problem of multiple-status detection and nonlinear pattern recognition. The experimental data that come from KPCA feature extraction are used as input to the SVM classification algorithm, some of which are used to train the model and the others to test the model. Experimental results showed that KPCA feature extraction and the SVM classification algorithm effectively distinguished four statuses of through-wall human being detection and achieved the desired results.
Keywords:Kernel principal component analysis, Support vector machines, Feature extraction, Classification
1 Introduction
Ultra-wideband (UWB) radar can emit pulses of very short duration to penetrate walls, bulkheads, and other obstacles. The UWB radar pulse has the advantages of high accuracy, strong penetrating ability, high resolving power, good anti-stealth ability, and low power consump-tion. Hence, it has great potential in radar detection, imaging, precise positioning and target recognition. In the fight against terrorism, disaster relief, public security dur-ing riotdur-ing and urban street fightdur-ing and other fields, it has a significant application. It operates mainly through the acquisition and analysis of the echo signal to carry in-formation to detect objects hidden in penetrating media, such as clay walls, dielectric plates, concrete, etc. The UWB signal can realize ranging accuracy in the order of centimeters, can identify and distinguish different target types, can overcome the absorbing effect of narrowband radar, can suppress clutter echo effects in complex back-grounds, and can provide non-intrusive detection. There-fore, the technology has broad and important application
prospects as the best choice for all-round human being detection. The focus of this paper is on using P410 UWB radar for multiple-status, through-wall, human being de-tection [1].
UWB radar has good penetration ability and is not susceptible to weather, temperature, humidity or other physical factors. Therefore, in recent years, its appli-cation regarding through-wall detection has increas-ingly attracted the interest of scholars. In reference [2], this paper mainly introduces the normalized dif-ference square matrix method, and the redif-ference moving average method with the Discrete Fourier Transform (DFT) as the detection techniques for the periodic respiratory motion of the human target. The results of experiments to detect objects behind gyp-sum walls and concrete walls have been separately proved for human target detection. In reference [3], this paper mainly introduces the through-wall human being detection model based on UWB radar, deducing the wavelet packet transform of the target criterion, and designing the procedure for through-wall human being detection with statistical process control. The experimental data are collected for both stationary * Correspondence:[email protected]
Tianjin Key Laboratory of Wireless Mobile Communications and Power Transmission, Tianjin Normal University, Tianjin 300387, China
and moving status of human beings behind a brick wall. In reference [4], this paper mainly introduces an efficient method of TOA (time of arrival) estimation using UWB through-wall radar to detect and track moving targets behind a wall based on the TWRI (through-wall radar imaging) algorithm. The proc-essed result of the experimental data obtained from the UWB through-wall radar shows its detection and tracking effects on moving targets. In reference [5], this paper mainly introduces residual subspace ana-lysis, addressing the anomaly detection problem in large-scale data-mining applications, and suggests a framework using compressed sensing (CS) theory. The experimental results were based on the bench-mark PETS 2007 and 83 GB of real footage from three public train stations. The results of this paper proposed a method that is scalable and, importantly,
its performance is comparable to conventional
methods for anomaly detection when the complete data are available. Reference [6] processes fuzzy pat-tern recognition and the genetic algorithm to identify the multiple-status human being behind a brick wall, and recognizes the principle of maximum degree of membership function to establish target prediction function by fuzzy pattern recognition. The results show fuzzy pattern recognition performance for the multi-status human being behind the wall. Reference [7], mainly describes a complete UWB signaling tom-ography system for high-contrast or large-object rec-ognition, applied to breast cancer screening. This article focuses on the implementation of a two-degree, free-imaging set to deal with asymmetric ob-jects with lifelike breast “ghosts.” In reference [8], a radar sensor network (RSN) was used to arrive at a unified analytical framework that takes all factors into account and allows the uncertainty derivation of probability detection and location. The experimental results allow the system designer to have a clear un-derstanding of the impact of each system parameter and the trade-off between performance and complex-ity. In reference [9], Yarovoy has examined the detec-tion and posidetec-tioning of human beings in complex environments with UWB radar and it has been shown that the range of a person varies by up to 0.6 cm be-cause of their breathing movements, and novel mo-tion or breathing detecmo-tion has been presented on the basis of the measurements from radar return spatial variations. The experimental results of human being radar return have been analyzed in the frequency band of 1 to 2 GHz. In reference [10], this paper de-scribes a complex process based on the M-sequence
UWB radar estimation method for behind-wall
moving-target tracking, and introduces the phase-task,
solution signal processing method. Experimental
results were based on the scenario of tracking a sin-gle moving object through a concrete wall, and the UWB radar signal is used to deal with the
perform-ance of the demonstration trajectory estimation
method.
In recent years, multiple-status, through-wall human detection being has attracted wide attention and been applied to many fields such as national economy, space technology, and national defense. The kernel principal component analysis (KPCA) method can deal with the nonlinear relationship between variables as a multi-variable statistical process monitoring effective algorithm using this method to establish a multiple-status fault de-tection model. The experimental results are based on three case studies: (1) a two-dimensional toy example, (2) a realistic simulation usually used as a benchmark example, known as the Tennessee Eastman Process, and (3) real data from a methanol plant [11]. Reference [12] shows that reducing the impact of channels and hand-sets on system performance is one of the major issues that improve the accuracy of the most state-of-the-art speaker recognition algorithms. By adapting the model between the different channel conditions to explore the SVM framework-specific techniques to obtain com-pletely nonlinear channel compensation, the observed changes in the particular type of marker channel are less sensitive to the system. In [13], Solomonoff proposed the SVM method to adjust the model to improve the ac-curacy of the speaker recognition algorithm and reduce the impact of the channel and the mobile phone on the system performance, and discussed SVM framework-specific technology to obtain complete nonlinear chan-nel compensation. The experimental results are based on systems that are less sensitive to the particular type of marker channel changes observed during training. In [14], this paper mainly discusses the road detection algo-rithm of the front-view single camera using the road probability distribution model (RPDM) and the online learning method. The combination of the dynamic RPDM and the fuzzy support vector machine (FSVM) makes the algorithm self-supervising and optimizes learning from the previous results.
are shown in Section 4. In Section 5 are the Discussion and our Conclusions.
2 Theory
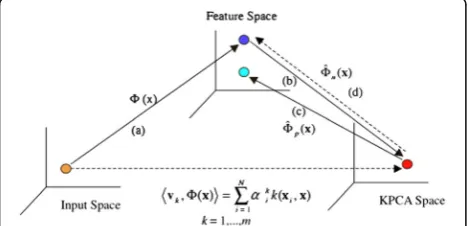
2.1 KPCA nonlinear feature extraction theory [15, 16]
Principal component analysis (PCA) is a linear dimen-sionality reduction and feature extraction method for high-dimensional data. It maps the input data from the original high-dimensional space to the characteristic subspace, extracts the main feature vector of the input data, and achieves the purpose of analyzing the original data with the main component. In general, PCA can only be effectively performed on a set of observations that are best described by second-order correlations and vary linearly, or the observations are generated by a Gaussian distribution. It is well known, however, that the variations of the actual data are nonlinear and highly non-Gaussian, and that the majority of the data cannot be described by second-order correlations. Therefore, when PCA is employed, the performance is very poor. In this paper, KPCA is a nonlinear PCA method based on kernel functions which intrinsically constructs a
nonlin-ear mapping from the input space to the feature spaceF
by a nonlinear transformation Φ, and performs linear
PCA inF. Between two input examples, x and y, in the
original space, one can avoid performing the nonlinear mappings and computing both the dot products in the feature space by using a kernel function of form:
k xð ;yÞ ¼Φð Þ⋅x Φð Þ⋅y
The conceptual framework of the KPCA method is shown schematically in Fig. 1.
There are many forms of kernel functions. According to Mercer’s theorem of functional analysis, if the kernel function is a continuous kernel of a positive integral op-erator, there exists a map,Φ, into a dot product space,F, such that the formula holds. As long as the requirement on the kernel function satisfies Mercer’s theorem and se-lects the fitting kernel function, it can achieve a good
dimensionality reduction effect. Below are some typical kernel functions, such as:
Polynomial kernelk xð ;yÞ ¼hx;yid;
Sigmoid kernelk xð ;yÞ ¼ tanh β0hx;yi þβ1
;
Radial basis kernelk x;y ¼ exp kx−yk
2
c
! ;
where d, β0, β1, and c are specified a priori by the user. The polynominal kernel and radial basis kernel always sat-isfy Mercer’s theorem, whereas the sigmoid kernel satisfies it only for certain values of β0and β1. Due to the good performance of the radial basis function, in practical appli-cation the radial basis function is generally chosen as the kernel function of KPCA; so, in this paper, we use the radial basis kernel as the KPCA kernel function.
Giving a set of input data (with zero mean)X(x1,⋯,xN ∈RmthatNis the number of samples,mis the dimension of the measurement variables) through PCA and KPCA al-gorithm calculating their covariance matrix, the covariance of PCA can be expressed by formula (1) and the covariance of KPCA can be expressed by formula (2) in a linear feature spaceFinstead of the nonlinear input space:
C¼ 1 Nxix
T i ¼
1 NXX
Tand ð1Þ
CF ¼ 1
N
XN
j¼1
Φjð Þx Φjð Þx T; ð2Þ
where it is assumed thatPNk¼1Φð Þ ¼xk 0, and theΦ(·) is a nonlinear mapping function that projects the input vectors from the input space toF. Note that the dimen-sionality of the feature space can be arbitrarily large or possibly infinite. To calculate the covariance matrix, one has to solve the eigenvalue problem in the feature space:
λv¼CFv; ð3Þ
where eigenvaluesλ≥0 and eigenvectorv∈F, the
eigen-vector v for any λ ≠ 0 can be linearly represented by
Φ(xi):
v¼X
N
i¼1
a ið ÞΦð Þxi ð4Þ
Eq. (2) can be converted into the kernel eigenvalue problem:
Nλa¼Ka; ð5Þ
where an N ∗ N matrix K is a kernel matrix, K =kij =
(Φ(xi) · Φ(xj)) = k(xi, xj), andα is the feature vector of the kernel matrix. When reconstruct input data from feature space, we use the fellow Eq. (5):
yk¼hvk;Φð Þxi ¼
XN
i¼1
akihΦð Þxi ;Φð Þx i ð6Þ
Before applying the KPCA algorithm, we assume that the data have been standardized, but in the actual appli-cation, without knowing the specific form ofΦ, the data are not standardized. This can be done by substituting the kernel matrixKwith:
b
K¼K−1NK−K1Nþ1NK1N; ð7Þ
where 1N¼ N1 NN
2.2 SVM classification algorithm theory [17–19]
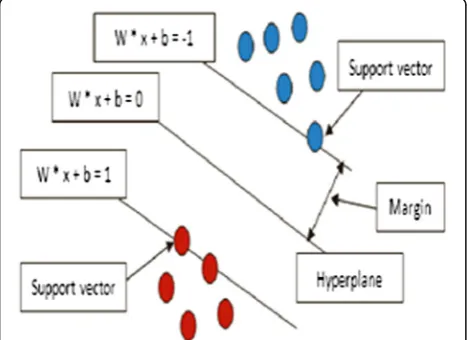
Support vector machines (SVMs) are a supervised, ma-chine learning method for classification, pattern recogni-tion, regression analysis, and other learning tasks based on statistical learning theory (SLT). In this method, sup-port vectors are used to represent decision boundaries; then, one maps the linearly indivisible data of the low-dimensional input space into a high-low-dimensional feature space to make it linearly separable; this it is based on the structural risk minimization theory and then constructs an optimal separating hyperplane in this space. The basic idea for SVMs is show in Fig. 2.
Given a training set ofNdata points (yj,xj) ,j= 1 , 2 , 3 ,…,Nwherexj∈Rnis the input pattern andyj∈{1,−1} is the output pattern. The SVM method approach aims at constructing a classifier of the form:
y xð Þ ¼ sign X
N
j¼1
ajyjΨ x;xj
þb
" #
; ð8Þ
where sign (·) is a symbolic function used to classify, αj
represents positive real constants and b is a real
con-stant. For Ψ(·, ·) one typically has the following choices: Ψðx;xkÞ ¼xTkx (linear SVM) and Ψ(x, xk) is a kernel
function similar to KPCA. Here, we also select the radial basis kernel as the SVM kernel function and use the nonlinear SVM in this paper.
The classifier is constructed as follows. One assumes that:
ωTφ x i
ð Þ þb≥1;if yi¼ þ1; ð9Þ
ωTφ x i
ð Þ þb≤−1;if yi¼−1; ð10Þ
which is equivalent to:
yj ωTφ xj þb
≥1;j¼1;2;3;…;N; ð11Þ
whereφ(·) is a nonlinear function which maps the input
space into a higher-dimensional feature space. But, in order to have the possibility to violate formula (10), the function is not clearly constructed. We introduce the variables ξj to solve the following primal optimization
problem and to obtain the separating hyperplane in the higher-dimensional space:
min ω;ξj
1 2ω
TωþCXN j¼i
ξj; ð12Þ
subject to
yj ωTφð Þ þxi b
≥1−ξj ð13Þ
ξ≥0;j¼1;2;…;N
3 Algorithm and implementation
In order to better understand the feature extraction al-gorithm of this paper, we give the training steps of the network as follows:
Algorithm 1Kernel Principal Component Analysis algorithm
Input: training set data, testing set data
Output:feature exaction data
1: standardize the input sample data to generate samples matrixX
2: select the radial basis function, select the appropriatecvalue and calculate the matrixK,according to equation (6) to obtain the matrixK
3: find the eigenvector and eigenvalues ofKaccording to equation (4), and select the eigenvectors corresponding to the largest eigenvalues.
4: calculate the projection of selected sample data according to equation (5), as input data for supporting vector machine recognition, classification for multiple statuses detection of through wall human being.
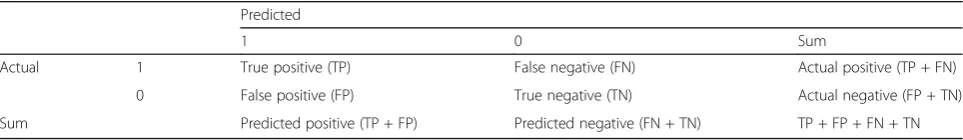
In this paper, we used the ROC (receiver operating char-acteristic) curve to estimate the performance of the classifi-cation algorithm more comprehensively. The ROC curve has the advantages of high credibility, accurate description of the target, and of not being affected by the data environ-ment. It is based on a series of two different classification methods (cutoff or decision threshold). In the ROC curve, the FPR (false positive rate) is used as the abscissa and the
TPR (true positive rate) is used as the ordinate. Compared with the traditional evaluation methods, the performance of the ROC curve analysis method is better and there are no excessive restrictions. Therefore, the ROC curve analysis method is applicable to a wider range. The evaluation index of the ROC is shown in the following [20] (Table 1):
TP is the positive sample which is predicted to be true by the model, FN is the positive sample which is predicted to be false by the model, FP is the false sample which is predicted to be true by the model, and TN is the false sample which is predicted to be false by the model. The calculation formulas of FPR and TPR are as follows:
FPR¼ FP
TNþFP;TPR¼ TP
TPþFN: ð14Þ
4 Experimental process and results
In this experimental, the UWB radar module is the P410 from the Time Domain Company. The P410 equipment development board is composed of a FPGA, a DSP, a network port, a UWB transceiver, a fan and many other components and is connected to the computer by net mouth using the UDP protocol to set the signal pulse length, frequency, and other parameters. The center fre-quency of the P410 UWB radar is 4.3 GHz. The wall material is a 23.5-cm thick brick. The P410 UWB radar is placed at a distance of 20 cm from the brick wall and the distance between the UWB radar and the ground is half of the brick wall. In this experimental environment, there are four statuses for through-wall human being de-tection. The first is nobody behind the brick wall, the second is two persons walking 1 m away from the brick wall, the third is three persons breathing normally 2 m away from the brick wall, and the last is two persons breathing rapidly 1 m away from the brick wall. The data in the four statuses consist of 500 groups of pulses and pulse sampling points set at 1000.
Based on the computer of P42.5GHZ,512M RAM and matlab R2009a simulation experiment, we selected the 300 groups of data from the four kinds of states through the feature extraction as the training set, the rest for the testing set. In order to compare the effects of feature extraction, the feature extraction method of this paper is compared with the PCA feature extraction method regarding the clas-sification result. Additionally, the experiments were
performed on the same training and testing data using the two feature extraction algorithms combined with SVMs. Through the theoretical knowledge in Section 2, we know that the KPCA method has the same mathematical and statistical properties as the linear PCA in the feature space, such as lack of correlation of the principal components; the principal component can represent the maximum variance of the sample data; the sample is reconstructed with the least squares error; in addition, it can extract more sample information than the linear PCA. Under the premise of the same classification performance, KPCA requires fewer principal elements than PCA, and it does not need to solve the nonlinear optimization problem, only the eigenvalue decomposition of the matrix, compared with other nonlin-ear feature extraction methods.
In the simulation results, the eigenvalues by descend-ing order of PCA and KPCA are shown in the followdescend-ing: Fig. 3 shows the matrix eigenvalues of PCA and Fig. 4 the matrix eigenvalues of KPCA. In this picture, the horizontal axis represents the number of sample eigen-values, and the vertical axis represents the eigenvalues. Compared with the two graphs, we can see that the KPCA tends to zero at the 300th eigenvalue, but the PCA starts to tend to zero at the 500th eigenvalue. If the variance contribution rate that the sum of the selected eigenvalues divided by the sum of all the eigenvalues reaches 90%, the PCA needs the first 100 eigenvalue rep-resentations, that is the 1000-dimensional column vector can be compressed into a vector of only 100-dimension. However, the KPCA only needs the first 70 eigenvalues to make the contribution rate of 90%. In other words, the 1000-dimensional column vector can be compressed into a vector of only 70-dimension. Under the same clas-sification performance, the KPCA requires fewer princi-pal elements and lower mean square error, and the effect of reducing the dimension is more obvious.
In this paper, the data by feature extraction of the training set is input into the SVMs for the training model. After the model training is finished, the test set data are input to the trained model for testing, and the experimental results are showed in Table 2. In Table 2, nine indicators are listed, and the feature extraction per-formance of the two algorithms is compared by each in-dicator. The accuracy of the KPCA algorithm is significantly higher than that of the PCA algorithm. The kappa statistics are an important indicator of the degree
Table 1The evaluation index of receiver operating characteristic (ROC)
Predicted
1 0 Sum
Actual 1 True positive (TP) False negative (FN) Actual positive (TP + FN)
0 False positive (FP) True negative (TN) Actual negative (FP + TN)
of consistency in the evaluation. If the kappa value is greater than 0.75, the consistency is good, indicating consistency between 0.75 and 0.4; less than 0.4 indicates poor consistency. From the table, we can see that the kappa value of the KPCA algorithm is greater than 0.75, the consistency is better, and the kappa value of PCA al-gorithm is less than 0.75 consistency. The mean absolute error and root mean squared error are used to measure the difference between the predicted value of the classi-fier and the actual result and the smaller the value the better the classification performance; so, it is apparent that the KPCA is superior to PCA. When the absolute error cannot reflect the error of the true size, the relative absolute error and root relative squared error can reflect the size of the error by the proportion of the error to the true value. Additionally, the smaller the relative ab-solute error is, the better the classification performance of the feature extraction algorithm is. To sum up, the KPCA and SVM combination algorithms are better than those of PCA and SVMs in comparison with each index of the two algorithms.
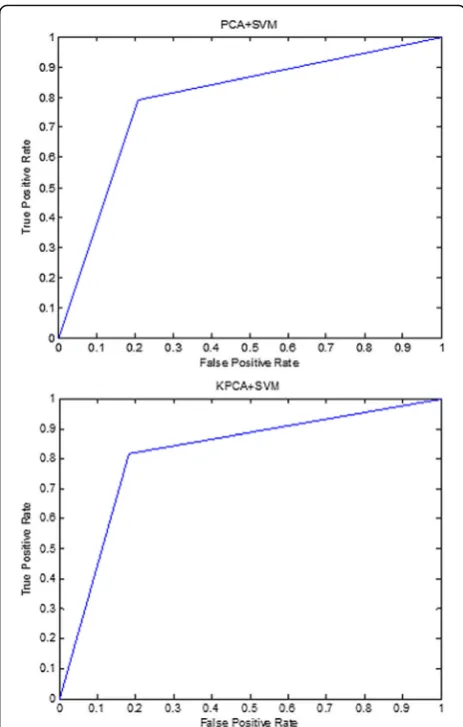
This paper also used the ROC curve to analyze the ex-perimental results. The ROC curve is closer to the upper left corner, it represents the algorithm having higher ac-curacy. As shown in Fig. 5, the ROC curve of through-wall human being detection by the two algorithms, using
Fig. 5Receiver operating characteristic (ROC) of through-wall human being detection
Table 2Experimental results compared with PCA + SVM, KPCA + SVM
Classification algorithm parameters PCA + SVM KPCA + SVM
Correctly classified instances 633 79.125% 654 81.75%
Incorrectly classified instances 167 20.875 146 18.25%
Kappa statistic 0.7217 0.7567
Mean absolute error 0.2827 0.2794
Root mean squared error 0.3604 0.3558
Relative absolute error 75.3889% 74.5%
Root relative squared error 83.2388% 82.1584%
Total number of instances 800 800
KPCAkernel principal component analysis,PCAprincipal component analysis,
SVMsupport vector machine
Fig. 4Matrix eigenvalues of kernel principal component analysis (KPCA)
the KPCA algorithm, is significantly better than that of the PCA algorithm. The ROC curve of through-wall human being detection is shown as follows:
5 Conclusion
We have presented a framework for through-wall human being detection under four statuses with P410 UWB radar using the SVM classification algorithm. In the aforementioned classification algorithm, we needed to extract the feature of the data to reduce the dimension and the time complexity. Compared to other feature extraction methods, KPCA has the following main advantages: (1) nonlinear data is effectively dealt with, (2) no nonlinear optimization is involved, (3) the calcu-lations in KPCA are as simple as in standard PCA, and (4) the number of PCs need not be specified prior to modeling. So, in this paper, the combination of KPCA and SVMs with this method combines the advantages of KPCA component analysis and SVMs in the application of pattern recognition, so the practical application can be better than the performance of the two methods alone. Experimental results show that the algorithm can effectively distinguish between there being no person be-hind the brick wall, two persons walking 1 m away from the brick wall, three persons breathing normally 2 m away from the brick wall, and two persons breathing rapidly 1 m away from the brick wall which has import-ant theoretical significance and practical application value. Compared with the traditional PCA method, the simulation results show that the proposed method has better stability and reliability, can improve the recogni-tion rate effectively, and can effectively optimize the extraction of the radar target’s principal feature, acceler-ate the identification of its speed, improve the recogni-tion performance of the target, and it also has good promoting ability. Further research work is being fo-cused on a small sample of multiple-status, human being detection and aims to improve recognition rate with different kernel functions.
Acknowledgements
This paper is supported by Natural Youth Science Foundation of China (61501326,61401310), and Natural Science Foundation of China (61271411). It also supported by Tianjin Research Program of Application Foundation and Advanced Technology (15JCZDJC31500), and Tianjin Science Foundation (16JCYBJC16500).
Authors’contributions
WW after the wall of human detection research, to participate in the idea of the article. MZ conducts human detection test data to measure and draft manuscripts. DW participates in data simulation. YJ participated in the design of the study and conducted a statistical analysis. All authors read and approved the final manuscript.
Competing interests
The authors declare that they have no competing interests.
Publisher’s note
Springer Nature remains neutral with regard to jurisdictional claims in published maps and institutional affiliations.
Received: 12 July 2017 Accepted: 17 August 2017
References
1. B. Zhang, W. Wang, Through-wall detection of human being with compressed UWB radar data. EURASIP J. Wireless Comm. & Networking.
2013(1), 1–7 (2013)
2. A. Kumar, Q. Liang, Z. Li, B. Zhang, Experimental study of through-wall human being detection using ultra-wideband (UWB) radar. Globecom Workshops, 1455–1459 (2012)
3. W. Wang, B. Zhang, J. Mu, Through wall detection of human being based on SPC and wavelet packet transform by UWB radar, proceeding of IEEE International Conference on Communications, pp. 869–878 (2013) 4. S. WU, G. Fang, Detection and tracking of moving target wall using UWB
through-wall radar, proceeding of IEEE on intelligent system design and engineering application (ISDEA), Changsha,605–608 (2010)
5. P. Duc-Son, V. Svetha, M. Lazarescu, S. Budhaditya. Anomaly detection in large-scale data stream networks. J. Data Mining and Knowledge Discovery. doi:10.1007/s10618-012-0297-3,2014:145-189
6. W. Wang, D. Wang, Through-wall multi-status target identification in smart and autonomous systems with UWB radar. IEEE Internet of Things Journal.. 10.1109/JIOT.2017.2695644,2017:86-89
7. M. Guardiola, S. Capdevila, S. Blanch, J. Romeu, UWB high-contrast robust tomographic imaging for medical applications, Electromag. in Adv. Appl. :560–563 (2009) 8. S. Bartoletti, A. Conti, A. Giorgetti, Analysis of UWB radar sensor networks.
IEEE International Conference on Communications, 1–6 (2010)
9. A.G. Yarovoy, L.P. Ligthart, J. Matuzas, B. Levitas, UWB radar for human being detection. IEEE Aerosp. Electron. Syst. Mag.21(11), 22–26 (2006)
10. D. Kocur, J. Rovnakova, M. Svecova, Through wall tracking of moving targets by M-sequence UWB radar. Stud. Comput. Intell.243, 349–364 (2009) 11. M. Maestri, M. Cassanello, G. Horowitz,Kernel PCA Performance in Processes
with Multiple Operation Modes, Special Issue-Wcce8, pp. 56–60 (2009) 12. K.I. Kim, K. Jung, H.J. Kim,Face Recognition Using Kernel Principal Component
Analysis.IEEE Signal Processing Letters9(2), 251–263 (2002)
13. A. Solomonoff, C. Quillen, W. Campbell, Channel compensation for SVM speaker recognition, MIT Lincoln Laboratory Lexington, MA, USA, 248:250–560 (2002)
14. S. Zhou, K. Iagnemma,Self-Supervised Learning Method for Unstructured Road Detection Using Fuzzy Support Vector Machines, Supported by the National Natural Science Foundation of China and the Robotic Mobility Group in Massachusetts Institute of Technology, at Boston, MA, USA, pp. 134–152 (2010) 15. L. Jong-Min, Y. ChangKyoo, S.W. Choi, P.A. Vanrolleghem, I.-B. Lee, Nonlinear
process monitoring using kernel principal component analysis. Chem. Eng. Sci.
1, 223–234 (2004)
16. B. Scholkopf, S. Alexander, M. Klaus-Robert, Nonlinear component analysis as a kernel eigenvalue problem. Neural Comput. 10 (5)1, 1299–1399 (1998) 17. W. Wang, Z. Chen, Throat polyp detection based on compressed big data
of voice with support vector machine algorithm. EURASIP J. on Adv. in Sig. Proc.2014, 1 (2014)
18. J.A.K. Suykens, J. Vandewalle, Least squares support vector machine classifiers. Neural Proc. Lett.9, 293–300 (1999)
19. C. Chang, C. Lin,LIBSVM: A Library for Support Vector Machines.National Taiwan University.. doi:10.1145/1961189.1961199,2011:127-130 20. M. O’Connell, J.L. Szalma, ROC-Estimator Software and ROC Analysis,