Area Extraction of beads in Membrane filter using
Image Segmentation Techniques
Neeti Taneja1, Sudha Goyal 2
1
M.E student , Computer Science Engineering Department Chitkara University,Punjab,India
2Associate Professor, Computer Science Engineering Department, Chitkara University,Punjab,India
Abstract – This paper describes the methodology adopted to analyze the quality of Membrane filter. The quality of Membrane filter is estimated by the uniformity of polymer beads which constitute the Membrane filter. More the uniformity ,better would be the quality of the filter .The microscopic image of membrane filter is taken. The image is filtered to remove noise and gone through various segmentation techniques to extract the object out of the image (which is the polymer beads in this case) .Then the circumference or the area of the beads is calculated in order to estimate the uniformity.
Keywords – Membrane Filter, Global Thresholding, Edge detection, Circular Hough transform
I. INTRODUCTION
Membrane filter is made up of thin layers of polymers and other advanced synthetic materials. Their thickness varies from 100 to 300 micro-meters. The porosity in a standard filter is approximately 70 to 90 percent.
In membrane filtration, a solute is passed through a semi-permeable membrane. The permeability of membrane is determined by the size of the pores in it, and will act as a barrier to particles which are larger than pore size, while the rest of the solute can pass freely through the membrane. The result is the clean filtered solution on one side while impurities on the other.
Fig. 1 Membrane filter
The size of the pores should be uniform in good [6] quality filter. Analyzing and checking the uniformity of polymer beads in the filter is the main job. Since the beads are very small ,their size cannot be determined with a naked eye Thus a microscope has to be used for judging its shape and size. The objective is to take the image of filter, removes noise from the image, segment it and further process it so as to check the uniformity. Clogging can occur in membrane as pores get filled up slowly with trapped
particles so the system must provide facilities for easy cleaning and maintainence to keep it in proper working condition.
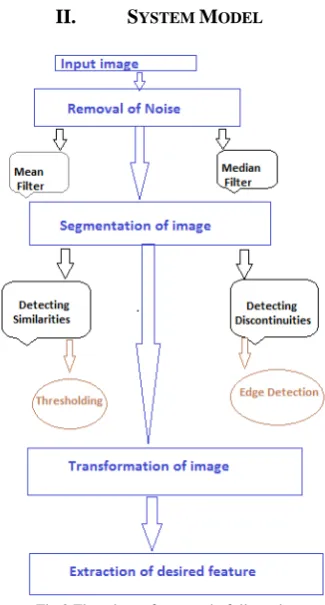
II. SYSTEM MODEL
Fig.2 Flowchart of approach followed
A. Removal of Noise
The input microscopic image may be noisy due to low lighting conditions, etc. There is a need to smooth out the image so as to make it suitable for further analysis. The pre processing includes removal of any type of noise in the image by using various kinds of filters such as Mean filter, Median filter ,etc.
Noise Removal by Linear filtering: In mean filtering since each pixel is set to the average [8]of the pixels in its neighborhood, local variations caused by noise are reduced.
Noise Removal by Median Filtering: In median filtering,
B. Segmentation of Image
Segmentation partitions an image into distinct regions containing each pixel with similar attributes. To be meaningful and useful for image analysis and interpretation, the regions should strongly relate to depicted objects or features of interest .Image Segmentation techniques are divided into two broad categories:
1) Detecting Similarities: Determination of pixels in an image having same intensity[2] values. e.g Thresholding.
2) Detecting Discontinuities: Detemination of pixels in an image having abrupt changes in intensity values. e.g Edge detection.
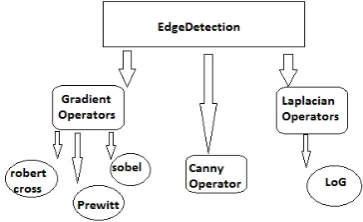
Fig. 3 Various Image segmentation Techniques
1) Thresholding:
Thresholding operation convert a multilevel image into a binary image i.e., it choose a proper threshold T, to divide image pixels into several regions and separate objects from background. In the thresholding[1] process, individual pixels of image are labeled as “object” pixel if their value is greater than some threshold value (assuming an object to be brighter than the background) and “background” pixels otherwise.
a)Global Thresholding
In Global thresholding, a single threshold value is used for the whole image. It is successful in highly controlled [3] environments, where control of the illumination is feasible. b) Local Thresholding
In this approach, each pixel in an image is assigned a threshold value so as to detect whether it is a background or object pixel.
2) Edge Detection:
Edge detection is a fundamental step in computer vision. Edge detection [4] is the process of identifying and locating sharp discontinuities in an image. Discontinuities are abrupt changes in pixel intensity. Broadly edge detection methods are grouped into two categories:
a)Gradient based Edge detection
The gradient method looks for the maximum and minimum in the first derivative of the image to detect the edges.
b) Laplacian based Edge detection
The Laplacian method detects edges by searching for zero crossings in the second derivative of the image.
A pixel in an image is considered an edge location [5] if the value of the gradient exceeds some threshold.
Fig. 4 Various Edge detection operators
Various Edge detectors: Sobel Operator
The operator consists of a pair of 3×3 convolution kernels and is used for detecting horizontal and vertical edges.
The gradient magnitude is given by:
The angle of orientation of the edge is given by:
Robert’s cross operator
The operator consists of a pair of 2×2 convolution kernels and is used for detecting diagonal edges.
The angle of orientation of the edge is given by:
Prewitt’s operator
Prewitt operator is used for detecting vertical and horizontal edges in images.
.
The selection of suitable operator involves the consideration of variables[5] such as Noise environment, Edge orientation and Edge structure. Though Prewitt operator is simpler to implement but the fact that masks of Sobel operator is preferred over the prewitt operator because it performs better image smoothening .
Laplacian of Gaussian (LoG ) Operator
The Laplacian of an image highlights regions of rapid intensity change. The image is first smoothed with a Gaussian Smoothing filter in order to reduce noise from it and finally laplacian operator is applied to it.
The Laplacian L(x,y) of an image with pixel intensity values I(x,y) is given by:
Canny Operator
a) Low error rate: Edges that occur in images are not missed and there is no response to false edges. b) Localization: In this edge points are well
localized.
c) No multiple responses to a single edge. The algorithm consists of following steps:
1) Firstly the input image is smoothed by the canny detector using Gaussian Filter to remove noise from it.
2) Secondly the gradient of image is computed for highlighting regions of high spatial derivatives. By doing so it tracks along these regions and suppresses any pixel that is not at the maximum. 3) Thirdly the gradient of image is reduced using
hysteresis. Hysteresis will track along the remaining pixels that are not suppressed.
4) Finally hysteresis utilizes two thresholds. If the magnitude is below the first threshold T1 it is set to zero i.e a non-edge and if magnitude is above the second threshold T2 it is considered an edge. And if magnitude is between the two thresholds then it is set to zero until there is a path from this pixel to a pixel with a gradient above T2.
C. Transformation of image
This step involves image synthesis by merging the pixels to find the boundaries of region of interest. Watershed algorithm is used primarily for the required transformation in order to extract the desired feature .
Watershed Algorithm
It regards the gradient magnitude image[7] as a landscape where the intensity values correspond to the elevation. Areas where a raindrop would drain to the same minimum are denoted as catchment basins, and the lines separating adjacent catchment basins are called watersheds.
Steps involved:
• Remove some of the weakest edges( e.g. due to noise)
• Compute the gradient map of original image.
• Compute the maximum value (MAX) of gradient map.
• Select the appropriate drowning threshold of watershed method: DT=MAX* l/n.
• For each pixel, we consider its 8-neighbor. If the value of current pixel and its neighbor is smaller DT, we merge current pixel with its neighbor.
• Merge the smaller regions. D. Extraction of desired feature
This step involves the use of Circular Hough transform for calculating the circumference of the bead in the filter. Circular Hough transform
Hough transform(HT) is a feature extraction technique used in image analysis and computer vision. CHT is used for detecting circular objects in an image. It transforms a set of edge points in image space into a set of accumulated points in parameter space. The array elements which contain the highest number of votes [6] indicates the presence of the shape.
Circle detection using Hough transform
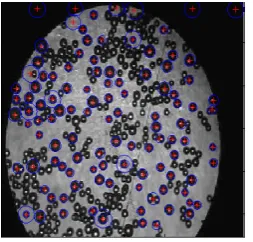
From circumference radius can be obtained and finally area of the polymer beads can easily be evaluated.
Using the area we can estimate the uniformity of the beads, thus analyzing the quality of the membrane filter.
III. SIMULATION RESULTS
The input image of Membrane filter which is of type PNG and dimensions 208 x 201 pixels is taken. Since the image is scanned so it may contain unwanted perturbations or artifacts also called noise. Therefore first the image is pre processed i.e noise is removed by using various filters such as Mean filter ,Median filter, etc. The input noisy image is shown in fig. 4.
Fig. 4 Input Noisy Image of Membrane filter
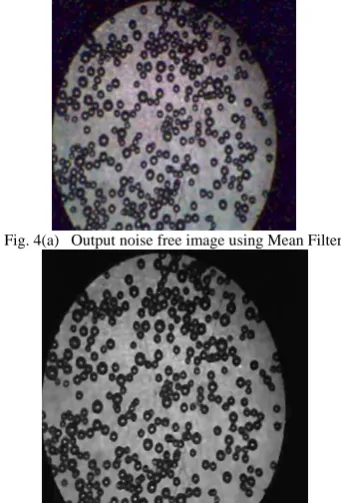
The output noise free image from both the filters is shown in fig. 4(a) and 4(b) respectively.
Fig. 4(a) Output noise free image using Mean Filter
It is clear from the visual comparison that Median filter performs better noise suppression than the Mean filter. After noise removal the image becomes suitable for segmentation.As an image is made up of pixels. Thresholding technique separates object(similar intensity value) pixels from background. It is shown in fig 5.
Fig. 5 Segmentation using thresholding
Edge detection technique locates sharp discontinuities (change in intensity value) in an image. It involves convolution of image with a filter. Output image using various edge detectors i.e Sobel, Prewitt and Robert cross ,LoG and Canny is shown in fig. 6(a),6(b) and 6(c) respectively.
Fig. 6(a) Edge detection using sobel operator
Fig. 6(b) Edge detection using Prewitt Operator
Fig. 6(c) Edge detection using Robert Cross Operator
Fig. 6(d) Edge detection using LoG Operator
Fig. 6(e) Edge detection using Canny Operator
It is clear from the visual comparison that Canny Operator gives the best results.
Watershed algorithm transforms the input image by merging pixels to obtain boundaries of the regions of interest in the membrane filter.
Fig 7 output image using Watershed
Circumference and radius are evaluated using CHT as shown below:
Fig. 8 Output image using Circular Hough transform
IV CONCLUSION
REFERENCES
[1] Bradley, D. Roth, G., “Adaptive Thresholding Using Integral Image,” Journal of Graphics Tools, vol 12, Issue.2 pp. 13-21. June 2007
[2] Rajeshwar Dass, Priyanka ,Swapna Devi,“Image segmentation techniques” IJECT,vol 3,Issue 1, pp. 66-70,Jan-March 2012 . [3] Nayer M. Wanas, Dina A. Said, Nadia H. Hegazy and Nevin M.
Darwish, “A study of local and global thresholding techniques in text categorization”, AusDM’06 Proceedings of the fifth Australian Conference on Data Mining and analystics , vol. 61, pp. 91-101,2006.
[4] Rafael C. Gonzalez, Richard Eugene Woods,”Digital image Processing”, 2002 by Prentice-Hall Inc.
[5] Raman Maini and Dr.. Himanshu Aggarwal, “Study and Comparison of Various Image Edge Detection
Techniques”,International Journal of Image Processing(IJIP) Vol. 3,Issue 1,pp. 1-12 ,200
[6] Aditya Sharma, Poonam G. Kohli, Divneet S.Kapoor and Amit Kumar Kohli, “Automatic Qualitative Analysis of Membrane Filter using Feature Extraction Techniques” IJCEM International Journal of Computational Engineering and Management ,vol. 13 ,pp. 70-77,July 2011.
[7] M. Sezgin and B. Sankur, “Survey over image thresholding techniques and quantitative performance evaluation,” Journal of Electronic Imaging 13(1), pp. 146–165, 2004.
[8] http://www.mathworks.in/help/images/noise-removal.html [9] Ioannou, D., W. Duda and F. Laine, “Circle recognition through a
2D Hough Transform and radius histogramming, IEEE Trans. on Image and Vision Computing,” vol. 17, July pp. 15-26, 1999.