Improving Seasonal Prediction of East Asian Summer Rainfall:
Experiments with NESM3.0
Young-Min Yang1,2, Bin Wang *1,2, Juan Li 1
1 Key Laboratory of Meteorological Disaster of Ministry of Education and Earth
System Modeling Center, Nanjing University of Information Science and Technology,
Nanjing, China
2 Department of Atmospheric Sciences and International Pacific Research Center,
University of Hawaii, Honolulu, Hawaii 96822, USA
Abstract
It has been an outstanding challenge for global climate models to simulate and
predict East Asia (EA) summer monsoon (EASM) rainfall. This study evaluates the
dynamical hindcast skills with the newly developed Nanjing University of
Information Science and Technology Earth System Model version 3.0 (NESM3.0). To
improve the poor prediction of an earlier version of NESM3.0, we have modified
convective parameterization schemes to suppress excessive deep convection and
enhance insufficient shallow and stratiform clouds. The new version of NESM3.0
with modified parameterizations (MOD hereafter) yields significantly improved
rainfall prediction in the northern and southern China but not over the Yangtze
River Valley. The improved prediction is primarily attributed to the improvements
in the predicted climatological summer mean rainfall and circulations, seasonal
march of the subtropical rain belt, Nino 3.4 SST anomaly, and the rainfall anomalies
associated with the development and decay of El Nino events. However, the MOD
still has notable biases in the predicted leading mode of interannual variability of
precipitation. The leading mode captures the dry (wet) anomalies over the South
China Sea (northern EA) but misplaced precipitation anomalies over the Yangtze
indices very well, but the bias in the circulation-rainfall connection caused predicted
rainfall errors. The results here suggest that over EA land regions, the skillful rainfall
prediction relies on not only model’s capability in predicting better summer mean
and seasonal march of rainfall and ENSO teleconnection with EASM, but also
accurate prediction of the leading modes of interannual variability.
Key words: East Asian summer monsoon, Seasonal prediction, dynamic prediction,
summer rainfall prediction, NESM3.0, ENSO teleconnection
1.
Introduction
Seasonal prediction of the land monsoon precipitation has been an outstanding
challenge since 1886 when Indian monsoon rainfall prediction started (Webster
2006). Over the East Asia (EA) and western North Pacific (WNP) region, the
atmospheric general circulation models have notorious problems in simulation of
the climatological monsoon trough and subtropical high as well as the subtropical
frontal rain belt (Kang et al. 2002). A particular challenge is that the vigorous
monsoon-ocean interaction must be considered in the dynamic simulation and
Seasonal predictions using coupled climate models have been progressively
improved by continuous efforts to improve initializations, model physical
parameterizations and horizontal and vertical resolutions (Yang et al. 2008;
Tompkins et al. 2017). Previous studies have shown considerable prediction skills
for prediction of the EASM index. However, prediction of summer precipitation
using coupled climate models remains at a very low-level of skills, particularly over
the EA land region. Striking deficiencies are observed over the South China Sea and
WNP region, where considerable model biases exist in both the amplitude and phase
of the annual cycle; in addition, its interannual variability is underestimated (Lee et
al. 2010).
To improve rainfall prediction over EA, multi-model ensemble (MME)
predictions have been conducted (Wang et al 2009, Lee et al. 2015). Based on
evaluation of the MME seasonal hindcasts performed by 14 climate models that
participate in the Climate Prediction and its Application to Society (CliPAS) project
and 6 models from the DEMETER project, Wang et al. (2009) concluded that forecast
of monsoon precipitation remains a major challenge and the seasonal rainfall
added downscaling methods to CilPAS prediction data in order to enhance
prediction skill but there is no considerable improvement.
Recently, the third version of the Nanjing University of Information Science and
Technology (NUIST) Earth System Model (NESM3.0 for short hereafter) has been
developed to provide a numerical model for earth system studies, to project future
climate changes and to simulate past climate changes, as well to conduct
subseasonal-to-seasonal prediction. A historical experiment of the NESM3.0 based
on coupled model intercomparison project phase (CMIP) 6 protocol was conducted.
The results showed that the NESM3.0 generally well reproduces the mean state of
rainfall, EASM onset date, the leading mode of interannual variability,
monsoon-ENSO relationship during mature phase and western Pacific subtropical high
(WPSH)-EA rainfall teleconnection over EA.
This study documents the seasonal prediction skills of the NESM3.0 over EA
and elaborates and discusses how the significant prediction kill was achieved and
what are the possible causes for the deficiencies. Section 2 introduces the NESM3.0
and presents data and initialization methods. In section 3, we discuss how the
temporal and spatial structures of the large-scale dynamic systems. The last section
presents a summary.
2. Model, data and initialization
2.1. The NESM3.0 Model
The newly developed NESM3.0 is a fully coupled climate system and earth
system model. The ocean component of the NESM3.0 is Ocean PArallelise (OPA),
which is the ocean part of the Nucleus for European Modelling of the Ocean (NEMO)
v3.4. The sea ice model in the NESM3.0 is CICE v4.1, which is originally developed
at the Los Alamos National Laboratory. The atmosphere and land components of
the NESM v3.0 are the ECHAM v6.3 atmospheric model and the associated land
surface model—the Jena Scheme for Atmosphere Biosphere Coupling in Hamburg
(JSBACH). The four model components are coupled through the
Ocean-Atmosphere-Sea-Ice-Soil Model Coupling Toolkit version 3.0 (OASIS3-MCT_3.0),
which is a fully parallelized tool to synchronize, interpolate and exchange the
coupling fields among the atmospheric, oceanic and sea ice component models. The
resolution of the atmospheric model is T63 horizontally (about 200 km) and 47 levels
vertically with 0.01 hPa as the model top. The land surface model has the same
of 1°latitude and longitude grid with the meridional resolution being refined to 1/3°
over the equatorial region, and it has 46 vertical layers with the first 15 layers at the
top 100 meters. The sea ice model resolution is about 1° latitude by longitude with
four sea ice layers and one snow layer on the top of the ice surface. The details of the
NESM3.0 is referred to Cao et al. (2018) and Yang and Wang (2018).
The ECHAM v6.3 and JSBACH model are originally developed at the Max
Planck Institute (Stevens et al. 2017). The convective parameterization is based on
the mass-flux framework developed by Tiedtke (1989) and further modified by
Nordeng (1994) (TDK, hereafter). The stratiform cloud scheme contains prognostic
equations for the vapor, liquid, and ice phase of water, a cloud microphysical
scheme, and a diagnostic cloud cover scheme. The JSBASH land surface model
simulates the fluxes of energy, momentum, moisture, and tracer gases between the
land surface and the atmosphere.
2.2 Major improvement of the early version of the model
The early developmental version of NESM3.0 reproduces reasonably well
global energy balance, climatology and major modes of climate variability but it has
biases in the climatology over EA and WNP. The model overproduces heavy rain
The model also underproduces major subtropical rainfall over China, Japan and
Korea. The northward flow over the eastern China shifted westward and was
weaker than the observation. Observed studies revealed that shallow (20-30%) and
stratiform (60-80%) clouds occur frequently than deep cloud (20-30%) during
summer season (Wen et al. 2016) and the contribution of stratiform rainfall to total
precipitation amount is about 40-50% (Yang and Smith, 2008). However, over EA
and WNP convective precipitation accounts for over 90% of the total precipitation
in the model. This suggests that the excessive precipitation in the model may be
mainly attributed to excessive deep convection, particularly in summer; hence it is
critical to suppress deep convection and enhance shallow and stratiform clouds for
improvement of simulated rainfall over EA.
Given the problems of the early version, we need to improve the model’s
capacity in simulating realistic EA-WNP summer monsoon while keeping global
energy and water balance unaffected. For this purpose, we implemented four
modified parameterizations to the NESM3.0. First, a boundary layer
depth-dependent convective inhibition (INH) was added to the convective scheme to
suppress deep convection (Yang and Wang 2018). The INH suppresses deep clouds
when the boundary layer depth is relatively shallow, which can reduce the
overestimates precipitation. Second, we added a bottom-heavy diffusivity in the
shallow convection scheme (SHC) (Yang and Wang 2018). In the earlier version of
the NESM3.0, it is found that vertical mixing between the lower troposphere and the
top of BL is insufficient. The modified shallow convective scheme is effective to
enhance shallow convection in the lower troposphere. Third, we changed the
conversion rate from convective cloud water to rain. This changes increased
moisture supply to stratiform clouds meanwhile reduced the amount of convective
precipitation. When the conversion rate decreases, less convective cloud water
converts to rainfall and thus convective precipitation decreases. The remaining
cloud water in the updraft is detrained to the ambient air, which leads to enhanced
stratiform cloud. Fourth, the entrainment rates in deep and shallow clouds have
been adjusted. An increasing entrainment rate tends to suppress deep convection.
When the convective plume rises up, a large entrainment rate decreases the
buoyancy of updraft quickly by enhancing mixing with relatively dry and cold
environmental air; th…us cloud development tends to be suppressed. In addition,
we tuned cloud cover scheme and cloud microphysics to reduce biases in global
energy balance (e.g. SST, short/long wave radiation at the top of Atmosphere). Note
that the modified parameterizations do not appreciably change global precipitation
For clarity, the prediction with the earlier version of the model (without the
modified parameterizations) is called the ‘CTL’ and the prediction using the model
with the modified parameterizationsis called the ‘MOD’. A parallel suits of 30-year
hindcast experiments was carried out in order to identify and understand the
impacts of the model modifications.
2.3 The data and initialization
The National Centers for Environmental Prediction-Department of Energy
(NCEP-DOE) Reanalysis II data (Kanamitsu et al. 2002) are used to represent
observed winds and geopotential heights. The observed precipitation data are
derived from the Global Precipitation Climatology Project (GPCP) daily data (Adler
et al. 2003). For monthly mean sea surface temperature (SST), we used the National
Oceanic and Atmospheric Administration Extended Reconstructed SST (ERSST)
version 4 data (Huang et al. 2016).
The initialization method used for CLT and MOD is exactly the same, which is
a simple three-dimensional nudging method (Kang et al. 2014). The ocean
temperature and salinity derived from the European Center for Medium-Range
Weather Forecast (ECMWF) ocean reanalysis and ocean heat content datasets
were nudged into the ocean model at all vertical layers with a specific relaxation
time-scale of 3 days. It is noted that prediction results are not sensitive to the
specified relaxation time-scale. No nudging processes were applied to the
atmosphere, land and sea ice model components.
The coupled model was integrated with the nudging process over a 22-year
spin-up period (1958-1979). The entire retrospective prediction period lasts 30 years
starting from January 1st 1980 to December 31st 2009. The targeted seasons are boreal
summer and winter with a 1- month lead time. The boreal summer (winter)
prediction starts from 1st May (1st November). Each prediction contains four
ensemble members. The lagged-averaged forecast (LAF) are employed for
providing different initial perturbations for the ensemble members. The initial
conditions for the four ensemble members were produced by 1-day time lagged
ensemble method during the nudging process from 27th to 30th April for the 1st May
boreal summer prediction. An increase in the ensemble size with the LAF method
does not contribute to the skill improvement of the prediction (e.g. Kang et al. 2014).
For simplicity, temporal correlation coefficient (TCC) is used to evaluate skills
of the ensemble mean prediction. The TCC was obtained by calculating the
variables during the 30 years of period (1980-2009). We have conducted two hindcast
experiments with the CTL and MOD. In addition to the rainfall prediction, we also
evaluated the predicted large-scale dynamic structure of EASM, including mean
climatology, annual cycle, and major modes of interannual variability, as well as
monsoon-ENSO relationship and circulation-rainfall teleconnection.
3. Performances on predicted EASM rainfall
Figure 1 presents the prediction skills of boreal summer mean precipitation over
EA for the 30-year period (1980-2009) derived from the CTL and MOD. Wang et al.
(2009) showed that while the MME prediction has considerable prediction skill score
(more than 0.5) over the WNP, the prediction skills over the EA land regions are
very low (< 0.2), suggesting that many climate models have no meaningful
prediction skills over the continental EA. The CTL prediction shows low skills (< 0.2)
over the EA except over the Yangtze River Valley (YRV) and Korea. The TCCs
averaged over the EA domain (100-140ºE, 5-50ºN) are merely 0.04. This is mainly
attributed to the negative skill over the eastern China Sea, southeastern China, SCS
and Philippine Sea. The MOD prediction, in contrast, shows useful TCC scores
ranging from 0.3 to 0.7 over the Yew River Valley and Korean peninsula,
SCS. It is difficult to predict land monsoon rainfall due to complicate land surface
conditions and the atmosphere-land interaction processes. For land EA, the CTL
shows very low skill with a TCC of 0.03 but the MOD simulates much higher
prediction skill score with a TCC of 0.37. Comparison of the CTL and MOD confirms
that the MOD improves seasonal prediction considerably over EA. However, low
skills are found over the YRV, Taiwan and eastern SCS. The possible reasons for the
deficiency will be discussed in the next section.
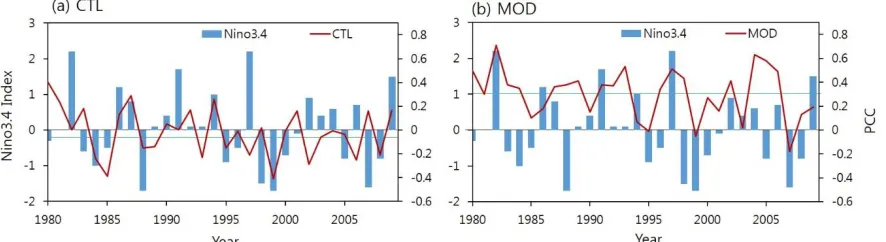
Figure 2 shows year-to-year variations of the rainfall prediction skills measured
by the Pattern Correlation Coefficient (PCC) between the observed and predicted
JJA precipitation anomalies over the EASM domain. The Nino3.4 index was also
shown in the figure to compare with the prediction skills. The CTL shows large
amplitude fluctuation from year to year with moderate PCC score (~0.3) in 1980,
1987 and 1994 and negative PCCs for 17 years. The 30-year averaged PCC score is
negative (-0.06). In the MOD, during high skill years (1982, 1993, 1997, 2004, 2005
and 2006), the PCC scores reaches about 0.6. The lowest negative PCC occurred in
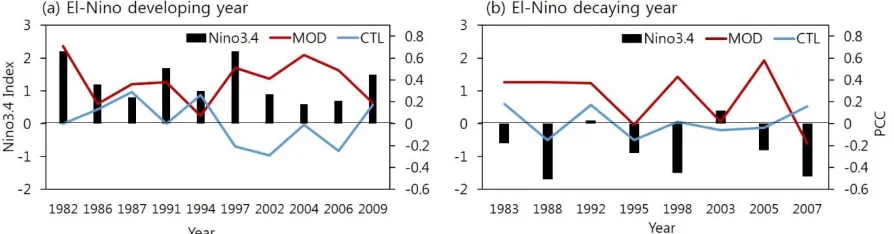
2007. We compared the PCC scores during the El-Nino developing and decaying
years, respectively (Figure 3). The CTL has pretty lower or negative skill during
moderate skill during most of the El-Nino developing and decaying years,
suggesting that the improved prediction skill in the MOD may be related with ENSO
simulation and its teleconnection with EASM. The details will be discussed in the
section 4.3.
4. Evaluation of predicted climatology and major modes of variability
To find out the reasons for the useful skills and deficiencies of the models’
predictions, we try to analyze and identify the key factors that may influence the
EASM prediction. These factors include predicted climatological mean states, the
major modes of interannual variability, predicted Pacific SST anomalies and
ENSO-EASM teleconnection, as well as the predicted WPSH and associated rainfall
anomalies.
4.1 Climatology
Lee et al. (2010) demonstrated that the skill for individual coupled models in
predicting seasonal precipitation anomalies is positively correlated with its
performances on prediction of the annual mean and annual cycle of precipitation.
For this reason, we examine the JJA large-scale climatological circulations and
southwest monsoonal flows prevail from Arabian Sea through India and south Asia
to Southern China, while southeasterlies blow from the Philippine Sea across East
China Sea to Japan. In the CTL, the southwesterlies from Arabian Sea are simulated
well but strong westerlies erroneously extend into the Philippine Sea and the
northward flow over eastern China is weaker than the observation. The MOD well
produces southwesterlies from the Arabian Sea and the southeasterlies from the
western Pacific; but the northward flow over eastern China remains weak. This may
induce insufficient northward moisture transport and weak subtropical
precipitation. Over EA, the observed major subtropical rainfall is seen over China,
Japan, Korea and surrounding seas (Meiyu, Changma and Baiu), which are
associated with the quasi-stationary EA subtropical front. Also, there are heavy rain
belt over the tropical monsoon trough extending from India via northern SCS to the
Philippine Sea. The CTL underproduces the heavy rain belt over India and
substantially overproduces heavy rain from the Bay of Bengal to western Pacific;
meanwhile, the major subtropical rainfall is weaker than the observation (Fig. 4b).
The MOD improves considerably the observed patterns of the tropical rain belt
except that the heavy rainfall over the eastern Bay of Bengal shifts equatorward. The
magnitude of rainfall over subtropical region is increased but still weaker than
Philippine Sea and excessively strong monsoon trough over the Philippine Sea, but
the MOD largely overcomes this deficiency. Yet, the MOD still underestimates the
southerly flow over the eastern China Sea and associated subtropical frontal rainfall.
It is well known that the strength and location of the WPSH and westerly jet are
vitally important for the EA rainfall distribution and its seasonal migration (Zhou
and Yu 2005, Zhou et al. 2009, Wang et al. 2013). The observed WPSH (outlined by
the isopleth of 5870 m) is over the subtropical Pacific along with strong westerly jet
being located along 40N and tropical easterly jet around 10N. In the CTL, the
WPSH is weak and the westerly jet is stronger and broader than the observation. In
the MOD, the horizontal pattern of the 500 hPa geopotential height is improved (Fig.
4c). The magnitude of WPSH is comparable with observation except its location is
slightly shifted eastward. The observed westerly jet is well represented in the MOD
although its magnitude is slightly greater than observation. The results here suggest
that the MOD has a potential for better EASM prediction by improved large-scale
climatology compared to the CTL.
For skillful prediction of EASM rainfall, it is of preeminent importance to
accurately simulate the seasonal transition from the dry to rainy seasons and
Figure 5 shows a latitude-time diagram of the observation and predicted pentad
mean rainfall from the CTL and MOD, averaged between 110E and 130E. Before
mid-May, there are two major observed rainfall belts: 1) zonal band over 15S-5N
and 2) subtropical band over EA (20N-35N). The later reflects spring rainy season
over southern China. In mid-late May, the two rainfall belts merge together near 10
-25N over the SCS. Around mid-June, the rainfall belt originally located at South
China continuously moves northward up to 40N and remains there until August.
The CTL predicts the transition of rainfall reasonably well, but tropical rain belt is
overproduced while the summer subtropical rain is significantly weaker than the
observation. A more severe problem is that the CTL failed to predict northward
propagation of rain belt from 25N to 40N. On the other hand, the MOD prediction
reproduces not only better tropical rainfall that was overproduced in the CTL, but
also better East Asian subtropical monsoon rainfall over north of 20ºN, although the
northward migration of the subtropical rain belt remains insufficient during August.
This improvement made in MOD is expected to have a positive influence on the
rainfall anomaly prediction over the northern EA.
ENSO has been recognized as the dominant source of predictability of EASM,
which strongly affects EASM during both the ENSO developing and decaying
summers (Fu et al. 1980, Huang and Wu 1989; Wang et al. 2017). Reliable seasonal
forecast should rely on realistic prediction of ENSO and the EA rainfall and
circulation system associated with it.
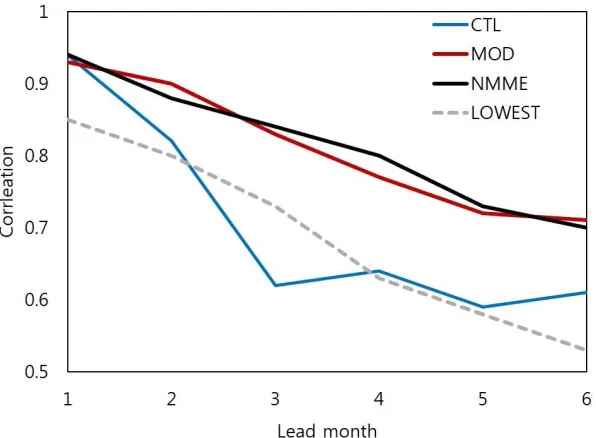
Figure 6 displays TCC skill of the models for Nino 3.4 SST anomalies as a
function of forecast lead time. The North American Multi-model ensemble (NMME;
Kirtman et al. 2014) was also shown in the figure to compare with the prediction
skills. The TCC score of the CTL is 0.80 for boreal summer (averaged over the lead
time of 1-3 months) but drops to 0.6 at 6-month lead. The summer mean skill score
is much lower than the NMME and it is similar with the skill of the lowest dynamic
model in the NMME members. The TCC score of the MOD is 0.87 for boreal summer
and reaches 0.72 for 6-month lead. The TCC score of the MOD almost the same as
the NMME skill, suggesting that the MOD has considerably improved ENSO
prediction skill.
It is well known that EASM responds to ENSO differently in the developing
summer and decaying summer. To this end, we examine the observed and model
decaying summer, separately. The El Nino developing summer includes 1982, 1986,
1987, 1991, 1994, 1997, 2002, 2004, 2006 and 2009. The El Nino decaying summers are
1983, 1988, 1992, 1995, 1998, 2003, 2005, and 2007. Fig. 7 shows composite EASM
precipitation and circulation anomalies derived from observation and predicted by
the CTL and MOD. During El Nino developing summer, the observed summer
rainfall deceases over the central and northern EA but increases over the southern
EA, in accordance with the cyclonic anomalies over the southern EA and the
anticyclonic anomalies over the northern China. The CTL captures the dry
anomalies over the Yellow Sea to west of Korea and Yangtze River Valley but failed
to simulate the wet anomalies over the southern EA. Corresponding westerlies over
the SCS and Philippine Sea is simulated in the CTL but anomalous easterlies shift to
Korea. The anticyclonic anomalies over the northern China ae not simulated in the
CTL. The MOD well captures dry anomalies over the central and northern EA and
wet anomalies over the southern EA and WP as well as the cyclonic anomalies over
southern EA and anticyclonic anomalies over northern China. However, the
magnitudes of the circulation and rainfall anomalies are too strong. There is also a
During El Nino decaying summer, observation displays dry rainfall anomalies
over the SCS and Philippine Sea and wet anomalies over Meiyu front, which
correspond to an anticyclonic anomaly in the SCS and Philippine Sea. The CTL failed
to capture both the dry anomalies over South EA (except over the Philippine Sea)
and the wet anomalies over central China (Meiyu front) and Korea. The
corresponding anticyclonic anomalies in the SCS and Philippine Sea is simulated in
the CTL with a weak magnitude. The MOD simulates more realistic dry anomalies
over the SCS and the wet anomalies north of 25ºN but with strong dry biases over
the northern East China. The anticyclonic anomalies in the MOD resemble the
observed counterparts. Generally, the MOD well reproduces rainfall anomalies
related with ENSO over the southern and northern EA, where its prediction skill
tends to be higher than other regions. Similarly, the CTL has better rainfall
anomalies around Korea, where the prediction skill is relatively high. The results
suggest that a better EASM-ENSO relationship may contributes to the improvement
of rainfall prediction skill.
4.3 Major modes of interannual variability of EASM
Besides climatology, it is important to see the model’s capability in predicting
modes of interannual variability may improve EASM prediction. To depict the major
modes of variability, Wang (1992) suggested multivariate EOF analysis (MV-EOF)
by analyzing a set of meteorological and oceanographic fields. The leading MV-EOF
mode can be a good indicator for estimating variability of EASM that has special
structures in both precipitation and circulation systems.
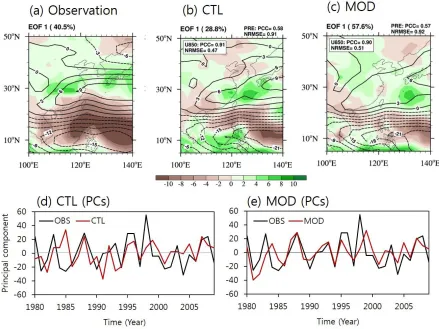
Figure 8 (upper panels) shows the first MV-EOF mode of the JJA precipitation
and 850hPa zonal winds anomalies from the observation and predicted by the
models. The observation displays dry rainfall anomalies over the SCS and Philippine
Sea and wet anomalies over Meiyu front region, which correspond to an anticyclonic
anomaly in the SCS and Philippine Sea and a cyclonic anomaly located to the east of
Korea with a relatively weak magnitude. The CTL captures dry anomalies over the
Philippine Sea but there is strong wet bias over the southern SCS. The CTL also
poorly produces the wet anomaly along the subtropical frontal zone from the
southern to west Japan. The MOD has an overall similar performance and
deficiencies as in the CTL. The WP anticyclonic anomalies are weak and the cyclonic
anomaly northeast of Korea is missed in both the CTL and MOD. The rainfall
totally missed, which is partially responsible for the low skills over the YRV in the
MOD prediction.
The interannual variation of the corresponding principal component of the first
mode is shown in Fig. 8d and e. The observed PCs generally have higher (lower)
value at El-Nino decaying (developing) year. The PCs of CTL are weakly correlated
with the observed PCs (CC: 0.28), while the PCs from the MOD and observation are
significantly correlated but the CC (0.55) is not very high.
4.4 Prediction of EASM circulation index and associated rainfall anomaly
pattern
Previous studies have shown that the models have better ability to predict the
circulation anomalies over the WNP-EA region, although precipitation anomalies
are poorly predicted (Fan et al. 2012). Here we examine whether this is the case for
the CTL and MOD or not. The variation of the WNP-EASM circulation system is
well depicted by the meridional zonal wind shear (vorticity) index defined by
850hPa zonal wind averaged over (22.5–32.5oN, 110–140oE) minus that over (5–15oN,
90–130oE) proposed by Wang and Fan (1999). This WF index captures variations of
zone (Wang et al. 2008). The strength and location of the WPSH is one of dominant
factor for EA rainfall (Zhou et al. 2009b; Wang et al. 2013) and it represents well the
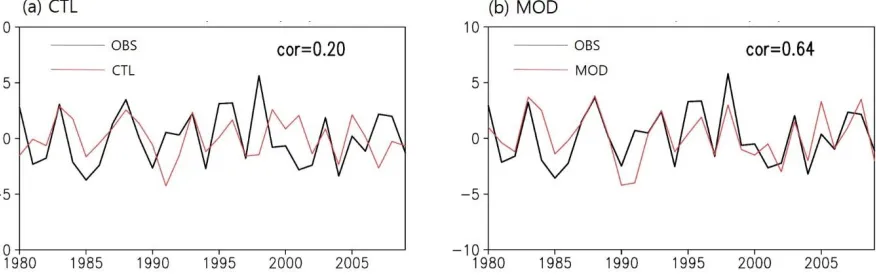
leading mode of EASM variations (Wang et al. 2008). Figure 9 shows prediction skill
score for the WF index. The observation displays that positive (negative) WF index
tends to be related with El-Nino decaying (developing) year. The CTL performs
poorly in capturing the year-to-year variability with a temporal correlation
coefficient (TCC) score of 0.20. The MOD simulates the interannual variability of WF
index reasonably well with a TCC of 0.64. This is consistent with the improved MOD
performance in predicting the EASM-ENSO relationship (Fig. 7).
The improved prediction for zonal wind can further enhance WPSH-rainfall
relationship. Figure 10 shows regressed JJA rainfall and circulation anomalies on the
WFI from observation and the models. Observation shows dry anomalies over the
Philippine Sea and northern SCS and wet anomaly along EA subtropical front over
the YRV, South Korea and Japan in association with enhanced WPSH. The CTL fails
to capture wet anomalies over central and northern EA including Korea and Japan
and dry anomalies over SCS. Overall, the CTL simulates rainfall anomalies poorly
with a PCC of 0.57 and a normalized root mean square error (NRMSE) of 0.92. The
and a reduced NRMSE of 0.76. The results suggest that better prediction of the
circulation index tends to reproduce better rainfall prediction, which is consistent
with previous studies (Wang and Fan 1999; Zhang et al. 2003; Li et al. 2012).
5. Conclusion and discussion
This study assessed the seasonal prediction skill of the Nanjing University of
Information Science and Technology Earth System Model (NESM3.0) for East Asia
Summer Monsoon (EASM). The earlier version of NESM3.0 has poor performance
in seasonal prediction of EASM. In order to improve the model prediction, the
convective parameterization schemes are modified to suppress excessive deep
convection and enhance insufficient shallow and stratiform clouds over the tropics
(Section 2.2). The new version of NESM3.0 with modified parameterizations (MOD)
yields markedly improved rainfall prediction in large areas of EA land regions
except over the Yangtze River Valley (YRV) (Fig. 1). The diagnostic analysis based
on large-scale dynamic structure were carried out to find key processes responsible
for better prediction and remaining deficiencies. It is found that the improved
prediction is primarily attributed to the improvements in the MOD predicted (i)
climatological summer mean rainfall especially over the WP monsoon trough and
over EA (Fig. 5), the ENSO prediction (Fig. 6) and the EA rainfall anomalies
associated with the development and decay of El Nino events (Fig. 7). However, the
MOD still has notable biases in the predicted leading mode of interannual variability
of precipitation. The leading mode captures the dry (wet) anomalies over the South
China Sea (northern EA) but misplaced precipitation anomalies over the Yangtze
River Valley and along the subtropical front in general (Fig. 8). The model can
capture the interannual variation of the circulation indices very well (Fig. 9), but the
bias in the circulation-rainfall connection caused predicted rainfall errors. The
results here suggest that over EA land regions, the skillful rainfall prediction relies
on not only model’s capability in predicting better summer mean and seasonal
march of rainfall and ENSO teleconnection with EASM, but also accurate prediction
of the leading modes of interannual variability, especially the anomalous western
Pacific subtropical high (WPSH) and its connections with the EA rainfall. The results
here also suggest that the model with better dynamics structure may reproduce
better prediction of precipitation over EA. This issue will be studied in the further
study.
This study focused on large-scale dynamic structure to reveal which processes
thermodynamic, moisture, land surface feedback, etc.) may all contribute to
prediction skill of rainfall over EA. These invite future studies. It would be
worthwhile to estimate impacts of each large-scale dynamic features on improved
prediction and clearly identify how they contributed to the improvements. But this
requires a large set of multi-model ensemble hindcast data. This is another topic for
future study. While we have assessed the impacts of the modified parameterizations
as a whole on EASM prediction, explanation for how each modified
parameterization affects seasonal prediction skill remains difficult. Since many
modifications in the physical processes were employed in the model, additional
experiments need to be conducted to identify the effects of each modification.
Although notable improvement has been made in the model, there remains
large room for further improvement. Previous studies suggested that deficit of cloud
physics or convective parameterization in the models results in low prediction skill
(Lee et al., 2010; Seo et al., 2015). The introduction of stochastic parameters in the
major physical processes (e.g. convective parameterization, cloud microphysics) can
be one of solution to improve parameterization because it is difficult to find accurate
Ensemble Kalman filter) may increase predictability. These will be the subjects of
further study.
Acknowledgements
This work is supported by National Natural Science Foundation of China
(Grant No. 41420104002) and the National Key Research and Development Program
of China (Grant No. 2016YFA0600401) as well as the National Science Foundation
(Climate Dynamics Division) Award No. AGS-1540783. This is Publication No.
XXXX of the SOEST, Publication No. YYYY of IPRC, and Publication No. ZZ of the
Earth System Modeling Center (ESMC).
Reference
Adler, R. F., and Coauthors, 2003: The Version-2 Global Precipitation Climatology
Project (GPCP) Monthly Precipitation Analysis (1979–Present). J
Hydrometeorol, 4, 1147-1167.
Cao, J.; Wang, B.; Yang, Y.-M.; Ma, L.; Li, J.; Sun, B.; Bao, Y.; He, J.; Zhou, X. The nuist
earth system model (nesm) version 3: Description and preliminary
evaluation. Geosci. Model Dev. Discuss. (accepted) 2018, 1.
Tropics and Midlatitudes during Northern Winter. Part I: Contrasts between
Active and Inactive Periods. Mon Weather Rev, 110, 933-946.
Chang, C. P., 2004: East Asian Monsoon. World Scientific.
Chen, W., G. Hans-F, and R. Huang, 2000: The interannual variability of East Asian
Winter Monsoon and its relation to the summer monsoon. Adv Atmos Sci, 17,
48-60.
Craig, A., S. Valcke, and L. Coquart, 2017: Development and performance of a new
version of the OASIS coupler, OASIS3-MCT_3.0. Geosci. Model Dev., 10,
3297-3308.
Dao, S.-Y., and L.-S. Chen, 1957: The Structure of General Circulation over Continent
of Asia in Summer. Journal of the Meteorological Society of Japan. Ser. II, 35A,
215-229.
Fan,K.,Y.Liu, andH.Chen,2012:Improving the prediction of the East Asian
summer monsoon: New approaches.Wea. Forecasting,27,1017–1030,
doi:https://doi.org/10.1175/WAF-D-11-00092.1
Gong, H., L. Wang, W. Chen, R. Wu, K. Wei, and X. Cui, 2013: The Climatology and
Interannual Variability of the East Asian Winter Monsoon in CMIP5 Models.
J Clim, 27, 1659-1678.
Huang, B., and Coauthors, 2015: Further Exploring and Quantifying Uncertainties
for Extended Reconstructed Sea Surface Temperature (ERSST) Version 4 (v4).
J Clim, 29, 3119-3142.
Huang, R., and Y. Wu, 1989: The influence of ENSO on the summer climate change
in China and its mechanism. Adv Atmos Sci, 6, 21-32.
Huang, R., J. Chen, and G. Huang, 2007: Characteristics and variations of the East
Atmos Sci, 24, 993-1023.
Hunke, E. C., and W. H. Lipscomb, 2010: CICE: The Los Alamos Sea Ice Model
Documentation and Software User’s Manual Version 4.1. LA-CC-06-012. T-3
Fluid Dynamics Group.
Jhun, J.-G., and E.-J. Lee, 2004: A New East Asian Winter Monsoon Index and
Associated Characteristics of the Winter Monsoon. J Clim, 17, 711-726.
Jiang, D., and Z. Tian, 2013: East Asian monsoon change for the 21st century: Results
of CMIP3 and CMIP5 models. Chinese Sci Bull, 58, 1427-1435.
Kanamitsu, M., W. Ebisuzaki, J. Woollen, S.-K. Yang, J. J. Hnilo, M. Fiorino, and G.
L. Potter, 2002: NCEP–DOE AMIP-II Reanalysis (R-2). B Am Meteorol Soc, 83,
1631-1643.
Kang, I. S., and Coauthors, 2002: Intercomparison of the climatological variations of
Asian summer monsoon precipitation simulated by 10 GCMs. Clim Dyn, 19,
383-395.
Kang,I. S., and Co-authors, 2014: Examination of multi-perturbation methods for
ensemble prediction of the MJO during boreal summer.Clim Dyn,42,2627–
2637.
Lau, K.-M., and M.-T. Li, 1984: The Monsoon of East Asia and its Global
Associations—A Survey. B Am Meteorol Soc, 65, 114-125.
Lee, D. Y. and co-authors, 2015:Enhancement of seasonal prediction of East Asian
summer rainfall related to western tropical Pacific convection. Clim. Dyn.45,
1025–1042.
Lee, J.-Y., and B. Wang, 2014: Future change of global monsoon in the CMIP5. Clim
Dyn, 42, 101-119.
to models performance on mean state and annual cycle?Climate Dyn., 35,
267-283, doi: 10.1007/s00382-010-0857-4.
Li, C. Y., 1990: Interaction between anomalous winter monsoon in East Asia and El
Nino events. Adv Atmos Sci, 7, 36-46.
Li, Q., F. Wei, and D. Li, 2011: Interdecadal variation of East Asian summer monsoon
and drought/flood distribution over eastern China in the last 159 years.
Journal of Geographical Sciences, 21, 579-593.
Lu, R., and Y. Fu, 2009: Intensification of East Asian Summer Rainfall Interannual
Variability in the Twenty-First Century Simulated by 12 CMIP3 Coupled
Models. J Clim, 23, 3316-3331.
Madec, G., 2008: NEMO ocean engine. Note du Pole de modélisation, Institut
Pierre-Simon Laplace (IPSL), NO 27, ISSN No 1288-1619.
Man, W., T. Zhou, and J. H. Jungclaus, 2012: Simulation of the East Asian Summer
Monsoon during the Last Millennium with the MPI Earth System Model. J
Clim, 25, 7852-7866.
Meehl, G. A., and Coauthors, 2007: THE WCRP CMIP3 Multimodel Dataset: A New
Era in Climate Change Research. B Am Meteorol Soc, 88, 1383-1394.
Nordeng, T. E. (1994). Extended versions of the convective parametrization scheme
at ECMWF and their impact on the mean and transient activity of the model
in the tropics, European Centre for Medium-Range Weather Forecasts.
Rayner, N. A., and Coauthors, 2003: Global analyses of sea surface temperature, sea
ice, and night marine air temperature since the late nineteenth century. J
Geophys Res, 108, 4407.
Seo, K.-H., J. Ok, J.-H. Son, and D.-H. Cha, 2013: Assessing Future Changes in the
7662-7675.
Song, F., and T. Zhou, 2013: Interannual Variability of East Asian Summer Monsoon
Simulated by CMIP3 and CMIP5 AGCMs: Skill Dependence on Indian
Ocean–Western Pacific Anticyclone Teleconnection. J Clim, 27, 1679-1697.
Sperber, K. R., and Coauthors, 2013: The Asian summer monsoon: an
intercomparison of CMIP5 vs. CMIP3 simulations of the late 20th century.
Clim Dyn, 41, 2711-2744.
Stevens, B., and Coauthors, 2017: The Atmospheric Component of the MPI-M Earth
System Model: ECHAM6. Journal of Advances in Modeling Earth Systems.
Taylor, K. E., R. J. Stouffer, and G. A. Meehl, 2011: An Overview of CMIP5 and the
Experiment Design. B Am Meteorol Soc, 93, 485-498.
Tiedtke, M. (1989). "A comprehensive mass flux scheme for cumulus
parameterization in large-scale models." Monthly Weather Review 117(8):
1779-1800.
Tompkins, A. M., Ortiz De Zarate, M. I., Saurral, R. I., Vera, C., Saulo, C., Merryfield,
W. J., Sigmond, M., Lee, W. S., Baehr, J., Braun, A., Butler, A., Deque, M.,
Doblas-Reyes, F. J., Gordon, M., Scaife, A. A., Imada, Y., Ishii, M., Ose, T.,
Kirtman, B., Ku- mar, A., Muller, W. A., Pirani, A., Stockdale, T., Rixen, M.,
and Yasuda, T.: The Climate-System Historical Forecast Project: Pro- viding
Open Access to Seasonal Forecast Ensembles from Cen- ters around the
Globe, B. Am. Meteorol. Soc., 98, 2293–2302,
Wang, B., 1992: The vertical structure and development of the ENSO anomaly mode
during 1979-1989. J Atmos Sci, 49, 698-712.
Wang, B., and Z. Fan, 1999: Choice of South Asian Summer Monsoon Indices. B Am
Meteorol Soc, 80, 629-638.
Wang, B., Y. Zhang, and M. Lu, 2004: Definition of South China Sea Monsoon Onset
and Commencement of the East Asia Summer Monsoon. J Clim, 17, 699-710.
Wang, B., Q. Ding, X. Fu, I.-S. Kang, K. Jin, J. Shukla, and F. Doblas-Reyes,
2005: Fundamental challenge in simulation and prediction of summer
monsoon rainfall. Geophys. Res. Lett., Vol. 32, No. 15, L15711, doi:
10.1029/2005GL022734 12.
Wang, B., 2006: The Asian Monsoon. Springer-Praxis.
Wang, B., Z. Wu, J. Li, J. Liu, C. P. Chang, Y. Ding, and G. Wu, 2008: How to measure
the strength of the East Asian summer monsoon. J Clim, 21, 4449-4463.
Wang, B., Lee, J.-Y., Kang, I.-S., Shukla, J., Park, C. K., Kumar, A., Schemm, J., Cocke,
S., Kug, J. S., Luo, J. J., Zhou, T., Wang, B., Fu, X., Yun, W. T., Alves, O., Jin,
E. K., Kinter, J., Kirt- man, B., Krishnamurti, T., Lau, N. C., Lau, W., Liu, P.,
Pegion, P., Rosati, T., Schubert, S., Stern, W., Suarez, M., and Yam- agata, T.:
Advance and prospectus of seasonal prediction: as- sessment of the
APCC/CliPAS 14-model ensemble retrospective seasonal prediction (1980–
2004), Clim. Dynam., 33, 93–117, https://doi.org/10.1007/s00382-008-0460-0,
2009.
Wang, B., Z. Wu, C. P. Chang, J. Liu, J. Li, and T. Zhou, 2010: Another look at
interannual-to-interdecadal variations of the East Asian winter monsoon:
Wang, B., B. Xiang, and J.-Y. Lee, 2013: Subtropical High predictability establishes a
promising way for monsoon and tropical storm predictions. Proc Natl Acad
Sci, 110, 2718-2722.
Wang, B., J. Li, and Q. He, 2017: Variable and robust East Asian monsoon rainfall
response to El Niño over the past 60 years (1957–2016). Adv Atmos Sci, 34,
1235-1248.
Wang, L., R. Huang, L. Gu, W. Chen, and L. Kang, 2009b: Interdecadal Variations of
the East Asian Winter Monsoon and Their Association with Quasi-Stationary
Planetary Wave Activity. J Clim, 22, 4860-4872.
Webster, P. J., V. O. Magaña, T. N. Palmer, J. Shukla, R. A. Tomas, M. Yanai, and T.
Yasunari, 1998: Monsoons: Processes, predictability, and the prospects for
prediction. J. Geophys. Res., 103, 14451-14510.
Wei, K., T. Xu, Z. Du, H. Gong, and B. Xie, 2014: How well do the current
state-of-the-art CMIP5 models characterise the climatology of the East Asian winter
monsoon? Clim Dyn, 43, 1241-1255.
Wen, M., S. Yang, A. Kumar, and P. Zhang, 2009: An Analysis of the Large-Scale
Climate Anomalies Associated with the Snowstorms Affecting China in
January 2008. Mon Weather Rev, 137, 1111-1131.
Wen, L., K. Zhao, G. Zhang, B. Zhou, S. Liu, X. Chen, and M. Xue, 2016: Statistical
characteristics of raindrop size distributions observed in east China during
the Asian summer monsoon season from the 2D-video disdrometer and
Yang, Y-M. and B. Wang, 2018: Improving MJO simulation by enhancing the
interaction between boundary layer convergence and lower tropospheric
heating, Clim Dyn, Accepted.
Yang, S. & Smith, E. A. Convective-stratiform precipitation variability at seasonal
scale from 8 yr of trmm observations: implications for multiple modes of
diurnal variability. J. Clim. 21, 4087–4114 (2008) .
Yang, S., Zhang, Z. Q., Kousky, V. E., Higgins, R. W., Yoo, S. H., Liang, J. Y., and
Fan, Y.: Simulations and seasonal prediction of the Asian summer monsoon
in the NCEP Climate Forecast System, J. Climate, 21, 3755–3775,
https://doi.org/10.1175/2008jcli1961.1, 2008.
Xie, P., and P. A. Arkin, 1997: Global Precipitation: A 17-Year Monthly Analysis
Based on Gauge Observations, Satellite Estimates, and Numerical Model
Outputs. B Am Meteorol Soc, 78, 2539-2558.
Zhang, Y., K. R. Sperber, and J. S. Boyle, 1997: Climatology and Interannual Variation
of the East Asian Winter Monsoon: Results from the 1979–95 NCEP/NCAR
Reanalysis. Mon Weather Rev, 125, 2605-2619.
Zhou, T., and Z. Li, 2002: Simulation of the east asian summer monsoon using a
variable resolution atmospheric GCM. Clim Dyn, 19, 167-180.
Zhou, T., and Coauthors, 2009a: Why the Western Pacific Subtropical High Has
Extended Westward since the Late 1970s. J Clim, 22, 2199-2215.
Zhou, T.-J., and R.-C. Yu, 2005: Atmospheric water vapor transport associated with
typical anomalous summer rainfall patterns in China. J Geophys Res: Atmos,
110, n/a-n/a.
Synoptic-Scale Controls of Persistent Low Temperature and Icy Weather over Southern
China in January 2008. Mon Weather Rev, 137, 3978-3991.
Zhu, Z., J. He, and L. Qi, 2012: Seasonal transition of East Asian subtropical monsoon
and its possible mechanism. J Trop Meteorol, 18, 305-311.
Zhu, Z., T. Li, and J. He, 2014: Out-of-Phase Relationship between Boreal Spring and
Summer Decadal Rainfall Changes in Southern China. J Clim, 27, 1083-1099.
Zhu, Z., and T. Li, 2017: Empirical prediction of the onset dates of South China Sea
summer monsoon. Clim Dyn, 48, 1633-1645.
Figure captions
FIG.1 Temporal correlation coefficient of JJA mean precipitation from (a) CTL and (b) MOD over EA during 1980-2009. The green and black contour represent a coefficient of 0.5 and 0.3, respectively.
FIG. 2 Year-to-year variations of the precipitation prediction skill (red line) measured by PCC between observation and predicted JJA rainfall from (a) CTL and (b) MOD during 1980-2009. PCCs were calculated over the EASM domain (5-40ºN, 100-140ºE). The blue bars represent observed DJF Nino3.4 SST Index
FIG. 3 Same as Fig. 2 except for El-Nino (a) developing and b) decaying years.
FIG. 5 Annual cycle climatology (1980-2009) for pentad mean precipitation
averaged between 110˚E and 130˚E from (a) observation, (b) CTL and (c) MOD. The
blue horizontal line shows 20°N.
FIG. 6 TCC skill of the JJA Nino 3.4 SST index from CTL (blue), MOD(red), NMME (black) and lowest dynamic models (gray dashed) from NMME project as a
function of lead month. The forecast starts from May 1st.
Fig. 7 Composite maps of JJA rainfall (shading) and 850 hPa winds (vector) anomalies from (a) observation (b) CTL and (c) MOD during El-Nino developing (upper panels) and decaying year (lower panels).
Fig. 8 Spatial patterns of first MV-EOF modes of JJA mean precipitation (shadings) and 850-hPa zonal wind (contour) from (a) observation, (b) CTL and (c) MOD during 30 years (1980-2009). Lower panels represent corresponding principal components from (d) CTL and (e) MOD.
Fig. 9 Year-to-year variations of the WF index from (a) CTL and (b) MOD. The WF index is defined by zonal wind at 850hPa over (22.5–32.5ºN, 110–140ºE) minus (5–
15N, 90–130E). The black line represents observed WF.
FIG. 5 Annual cycle climatology (1980-2009) for pentad mean precipitation
averaged between 110˚E and 130˚E from (a) observation, (b) CTL and (c) MOD. The
FIG. 6 TCC skill of the JJA Nino 3.4 SST index from CTL (blue), MOD(red), NMME (black) and lowest dynamic models (gray dashed) from NMME project as a
Fig. 9 Year-to-year variations of the WF index from (a) CTL and (b) MOD. The WF index is defined by zonal wind at 850hPa over (22.5–32.5ºN, 110–140ºE) minus (5–