P R O C E E D I N G S
Open Access
Genetic Analysis Workshop 18 single-nucleotide
variant prioritization based on protein impact,
sequence conservation, and gene annotation
Thomas Nalpathamkalam
1,2, Andriy Derkach
3, Andrew D Paterson
2,4, Daniele Merico
1,2*From
Genetic Analysis Workshop 18
Stevenson, WA, USA. 13-17 October 2012
Abstract
Grouping variants based on gene mapping can augment the power of rare variant association tests. Weighting or sorting variants based on their expected functional impact can provide additional benefit. We defined groups of prioritized variants based on systematic annotation of Genetic Analysis Workshop 18 (GAW18) single-nucleotide variants; we focused on variants detected by whole genome sequencing, specifically on the high-quality subset presented in the genotype files. First, we divided variants between coding and noncoding. Coding variants are fewer than 1% of the total and are more likely to have a biological effect than noncoding variants. Coding variants were further stratified into protein changing and protein damaging groups based on the effect on protein amino acid sequence. In particular, missense variants predicted to be damaging, splice-site alterations, and stop gains were assigned to the protein damaging category. Impact of noncoding variants is more difficult to predict. We decided to rely uniquely on conservation: we combined (a) the mammalian phastCons Conserved Element and (b) the PhyloP score, which identify conserved intervals and the single-nucleotide position, respectively. This reduced the noncoding variants to a number comparable to coding variants. Finally, using gene structure definition from the widely used RefSeq database, we mapped variants to genes to support association tests that require collapsing rare variants to genes. Companion GAW18 papers used these variant priority groups and gene mapping; one of these paper specifically found evidence of stronger association signal for protein damaging variants.
Background
Next generation sequencing (NGS) technology, especially the application of whole genome sequencing (WGS), poses a major challenge in terms of the number of var-iants to be analyzed [1,2]. Grouping varvar-iants based on gene mapping can augment the power of rare variant association tests [2]. In addition, association studies, as well as other applications such as the search for Mende-lian disease genes [1] or the interpretation of individual genomes for personalized medicine [3], can benefit from variant prioritization methods.
We prioritized Genetic Analysis Workshop 18 (GAW18) single-nucleotide variants based on criteria
previously described in the literature [1,2] and publicly available bioinformatics resources.
First, we divided variants into coding and noncoding. Coding variants are fewer than 1% of the total and are more likely than noncoding variants to have a biological effect because they can produce a change in the protein sequence. Noncoding variants are more abundant and are more difficult to assess for functional relevance; however, many genome-wide association studies’signals have been found in noncoding regions, likely in correspondence of regulatory sequences [4]. For this reason, we decided to keep the two types of variants separate, and we decided to comparatively evaluate the detection of association signals for coding and noncoding variants. Both coding and non-coding variants were stratified in two progressively more stringent groups. For coding variants, the groups were protein changing and protein damaging; for noncoding * Correspondence: [email protected]
1
The Centre for Applied Genomics, The Hospital for Sick Children, 101 College Street, M5G 1L7 Toronto, ON, Canada
Full list of author information is available at the end of the article
variants, the groups were medium conservation and high conservation. Whereas coding variants were stratified based on the type of change introduced in the protein sequence, noncoding variants were stratified using evolu-tionary conservation of genomic DNA sequence as a proxy of functional relevance. Finally, variants were mapped to genes based on the overlap with their tran-script. Intergenic variants were mapped to the closest gene, and ad-hoc rules were applied to minimize the num-ber of variants mapping to multiple genes.
The Methods section describes in detail the tools and rules used to generate primary annotation, sort variants into priority groups, and map them to genes. The Results section describes in detail the number of variants found for each group and the rationale for the specific settings used for priority group definitions; we also briefly sum-marize results from a companion paper [5] showing the presence of association signals for prioritized variants. The Discussion section takes a critical look at the priori-tization strategy adopted in this work in the context of recent literature on variant prioritization, making a few recommendations for future improvements.
Methods
Variant coordinates and alleles
GAW18 single-nucleotide variants were extracted from genotype files (.geno.csv), corresponding to 464 sequenced individuals; variants were provided for odd chromosomes. We identified reference and alternate alleles by consider-ing the nucleotide at correspondconsider-ing positions in the human genome reference sequence. Multi-allelic variants were considered bi-allelic, by considering only the two most frequent alleles; although not ideal, this substantially simplifies the annotation pipeline. We used the human genome reference sequence hg19 GRCh37.
Extraction of variant annotation from databases
Annovar [6] was used to (a) map variants to gene exons and coding sequence on the basis of the RefSeq database (based on hg19) and (b) classify variants as synonymous (i.e., not expected to alter the protein sequence), missense (i.e., amino acid changing), stop-loss, stop-gain, or expected splicing alterations (defined as presence of alter-nate alleles in the +/- 2-bp interval around intron/exon boundaries). In the presence of overlapping genomic regions (e.g., 3′ untranslated region (3′ UTR) of gene A overlapping with coding exon of gene B), Annovar fol-lows predefined annotation precedence (e.g., coding exon has precedence over 3′ UTR); the precedence rules used by Annovar are logically consistent with our variant prioritization strategy, which assigns higher priority to coding variants disrupting the protein sequence. Anno-var’s gene mapping was parsed to minimize the number of variants mapping to multiple genes: (a) we removed 68
read-through transcripts (i.e., transcripts that span two genes), which may represent artifacts or have dubious functional relevance, and (b) for intergenic regions, we reported only the closest genes and we removed all genes at a distance greater than 200 kbp.
To further classify missense variants, we used two widely used predictors, SIFT [7] and Polyphen [8], and combined their scores using CONDEL [9], a tool for optimized consensus definition; in particular, SIFT version 2.1.0 and Polyphen version 4.0.3 predictions were generated for all possible variant positions. To define noncoding variant conservation groups, we used placental mammals phastConsElements [10] and PhyloP [11] scores obtained from UCSC (based on hg19 coordinates).
Definition of variant priority groups
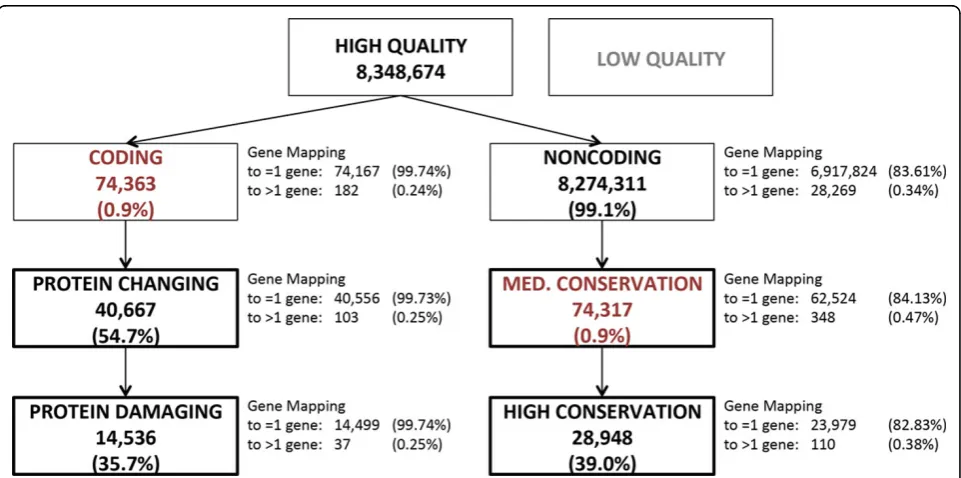
We categorized variants into two mutually exclusive groups, coding and noncoding. For coding variants, we defined three groups based on expected impact on protein sequence: coding, protein changing, and protein damaging groups. Correspondingly, for noncoding variants, we defined three groups based on conservation: noncoding, noncoding medium conservation, and noncoding high conservation. The groups were defined as follows.
Variants categorized by Annovar as“splicing”or“ exo-nic”were assigned to the“coding”group; all other variants (categorized by Annovar as“ncRNA”,“UTR3”,“UTR5”, “intronic”,“upstream”,“downstream”,“intergenic”) were assigned to the noncoding category. In addition, coding variants categorized by Annovar as“splicing”or“exonic, nonsynonymous”,“exonic, stop-gain”and“exonic, stop-loss”were also assigned to the“protein changing” sub-group of“coding”. Finally,“splicing”,“exonic, missense” variants predicted“deleterious”by CONDEL (a subset of “exonic, nonsynonymous”variants) and “exonic, stop-gain”variants were assigned to the“protein damaging” subgroup of“protein changing”.
Noncoding variants with mammalian phastCons Con-served Element score greater than 0 and mammalian PhyloP greater than 1 were assigned to the noncoding
subgroup “medium conservation”. The noncoding
var-iants satisfying more stringent cutoffs on conservation (phastCons >400; PhyloP >1.5) were assigned to the “high conservation” subgroup.
Results
Variant prioritization strategy
were first sorted into two mutually exclusive groups (Figure 1), coding (74,363; 0.9%) and noncoding (8,274,311; 99.1%).
Gene mappings
Gene mappings were parsed to remove mapping to read-through genes, which represent transcripts spanning two genes. Whereas some read-throughs are present in physio-logical conditions, but their functional role is dubious, other read-throughs are potential annotation artifacts. Read-throughs introduce extra redundancy when collap-sing variants to genes, which we deemed unnecessary. After removing read-throughs, most of the coding variants (99.74%) mapped only to one gene. Gene mappings of intergenic variants were further processed by selecting only the closest gene and removing genes at a distance greater than 200 kbp; these rules could be regarded as simplistic, yet they help minimizing overlaps when collap-sing rare variants by gene. This resulted in 83.6% of all noncoding variants mapping to one gene and only 0.34% mapping to more than one gene.
Coding variant prioritization
Coding variants are a small minority, and they are more likely than noncoding variants to have a biological effect because they can produce a change in the protein sequence. In addition, there is a (at least partial) consen-sus on how to prioritize coding variants based on their
protein sequence impact. Coding variants were defined as mapping to protein-coding exons as well as their splice sites; UTRs are not part of protein-coding exons and therefore were excluded. All other variants were assigned to the noncoding group regardless of their type (thus including UTRs and introns of protein-coding genes, ncRNA genes, promoters, and intergenic regions). Coding variants were labeled as protein changing (40,667; 54.7% of coding variants) if they altered splicing or if they changed at least one amino acid of the gene’s protein sequence(s) (corresponding to the missense, stop-gain, and stop-loss categories). Protein changing variants were further labeled as protein damaging (14,536; 19.5%) if they altered splicing, if they intro-duced a stop codon, or if they prointro-duced an amino acid change deemed damaging by CONDEL [9], a missense variant impact consensus predictor that was used to integrate SIFT [7] and Polyphen [8] predictions. CONDEL weights predictions from these tools using a data set of 20,000 missense variants, both deleterious and neutral, and thus we deemed it superior to a simple consensus rule.
Noncoding variant prioritization
To stratify noncoding variants, we used evolutionary conservation. In fact, for variants mapping to annotated noncoding RNAs or regulatory sequences (e.g., promo-ters, methylation sites), there is no established consensus
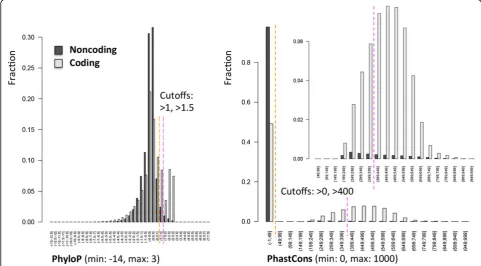
on how to predict the functional disruption. In addition, many noncoding variants map to functionally relevant regions that have not yet been annotated [1]. At least some of the functionally relevant noncoding loci are likely to be constrained evolutionarily, and this method does depend on known annotations of functional ele-ments. We defined two conservation priority groups based on two widely used conservation scores, mamma-lian phastCons Conserved Element [10] and PhyloP [11]. PhastCons score is based on a hidden Markov model that estimates the probability that each nucleo-tide belongs to a conserved element based on multiple alignment of genome sequences (placental mammal sequences in our case); PhastCons is sensitive to runs of conserved sites and is therefore effective at picking out conserved elements. By contrast, PhyloP separately mea-sures conservation at individual positions, ignoring the conservation of neighboring positions. Variants with phastCons greater than 0 and PhyloP greater than 1 were assigned to the medium conservation group (74,317; 0.9% of all noncoding variants); variants with phastCons greater than 400 and PhyloP greater than 1.5 were assigned to the high conservation group (28,948; 39.0% of medium conservation noncoding variants). Well-characterized functional ncRNA elements (e.g., microRNAs) typically have phastCons greater than 400. We also verified that 54.5% of the coding variants reside
within a phastCons greater than 0 genomic region, but only 2.4% of noncoding variants satisfied the same requirement (Figure 2), providing further support for the selected phastCons thresholds. The PhyloP cutoff was fine tuned to obtain a number of prioritized non-coding variant comparable to non-coding variants.
Assessment of association for different priority groups The GAW18 paper [5] assessed different gene-collapsed rare variant association test for 103 unrelated individuals with NGS data and real hypertension phenotype data, only for chromosome 3. None of the genes was signifi-cant after Bonferroni multiple test correction; however, quantile-quantile plots, investigating the discrepancy between realp-values and uniformly distributed p-values expected under the null hypothesis of no association, displayed an excess of nominally significantp-values for the protein damaging group compared with all coding variants. No signal was found for noncoding variants.
Discussion
We defined a simple yet robust variant prioritization scheme using publicly available bioinformatics tools and resources. We first divided variants into coding and noncoding. Coding variants have a more straightforward mapping to genes and are capable of directly altering protein function. Nonetheless, at least some of the
noncoding variants are expected to have a biologically relevant effect on functional noncoding RNA or protein-coding gene regulation. For both protein-coding and nonprotein-coding variants, we defined a more inclusive and more stringent set of prioritized variants (coding: protein changing, protein damaging; noncoding: medium conservation and high conservation). We also provided gene mapping to support the grouping of variants by gene for association testing. These variant annotations were used in other GAW18 proceeding papers [5,12]; one paper [5] specifi-cally found the presence of stronger association signals for protein damaging variants.
Several recent studies have investigated variants expected to alter protein function. In the following section, we summarize their findings and discuss their relevance for variant prioritization in association studies.
A study taking advantage of the large NHLBI-ESP exome variant database [13] has shown abundant rare and deleterious genetic variants, many of which arose recently in human evolutionary history because of accel-erated population growth. Splice site alterations, stop-gain, and missense predicted-damaging variants were all shown to be on average more recent than synonymous variants, and a similar pattern was found for noncoding variants in conserved compared with nonconserved positions. This validates our overall strategy.
A survey of common loss-of-function (LOF) variants (including stop-gain and splice variants categorized as pro-tein damaging in this study) [14] revealed several sources of error to be reckoned: sequencing or mapping errors (25.0%), annotation or reference sequence errors (26.8%), and variants unlikely to be genuine LOF events because of combined effects of other variants (11.1%). Excluding sequencing errors, which have been minimized in the GAW18 data set by additional quality filtering, these find-ings suggest that a more sophisticated annotation pipeline may be required to avoid false positive LOF variant anno-tation. This includes time-consuming manual inspection of all LOF variants, which was not practicable for this study, as well as more nuanced filters, such as considering the percentage of disrupted coding sequence and the presence of variant combinations that could cancel out the LOF in combination (only partially practicable in this study because in/del variants were not available).
We are not aware of specific works setting community-accepted standards for noncoding variants. Future work in this field will be extremely relevant to variant prioritization.
Conclusions
We defined a simple yet robust variant prioritization scheme using publicly available bioinformatics tools and resources. We also provided gene mapping to support
the grouping of variants by gene for association testing. Association signal was specifically found for coding var-iants predicted to be deleterious for protein function.
Competing interests
The authors declare that they have no competing interests.
Authors’contributions
DM and ADP designed the. TN and DM performed the data analysis. DM and ADP drafted the manuscript. TN and AD helped revise the manuscript. All authors read and approved the final manuscript.
Acknowledgements
We wish to acknowledge other members of TCAG Informatics Facility and Professor Stephen W. Scherer’s academic research group for valuable discussions on variant annotation; we would like to particularly thank Professor Stephen W. Scherer, Dr. Christian Marshall, and Dr. Ryan Yuen (affiliations for SWS, CM, and RY: Hospital for Sick Children, Program in Genetics and Genome Biology, and The Centre for Applied Genomics; SWS and CM: University of Toronto, McLaughlin Centre). The GAW18 WGS data were provided by the T2D-GENES (Type 2 Diabetes Genetic Exploration by Next-generation sequencing in Ethnic Samples) Consortium, which is supported by National Institutes of Health (NIH) grants U01 DK085524, U01 DK085584, U01 DK085501, U01 DK085526, and U01 DK085545. The other genetic and phenotypic data for GAW18 were provided by the San Antonio Family Heart Study and San Antonio Family Diabetes/Gallbladder Study, which are supported by NIH grants P01 HL045222, R01 DK047482, and R01 DK053889. The GAW is supported by NIH grant R01 GM031575.
This article has been published as part ofBMC ProceedingsVolume 8 Supplement 1, 2014: Genetic Analysis Workshop 18. The full contents of the supplement are available online at http://www.biomedcentral.com/bmcproc/ supplements/8/S1. Publication charges for this supplement were funded by the Texas Biomedical Research Institute.
Authors’details 1
The Centre for Applied Genomics, The Hospital for Sick Children, 101 College Street, M5G 1L7 Toronto, ON, Canada.2Program in Genetics and
Genome Biology, The Hospital for Sick Children, 101 College Street, M5G 1L7 Toronto, ON, Canada.3Department of Statistics, University of Toronto, 100 St.
George St., M5S 3G3 Toronto, ON, Canada.4Division of Biostatistics, Dalla Lana School of Public Health, 155 College Street, University of Toronto, M5T 3M7 Toronto, ON, Canada.
Published: 17 June 2014
References
1. Cooper GM, Shendure J:Needles in stacks of needles: finding
disease-causal variants in a wealth of genomic data.Nat Rev Genet2011,
12:628-640.
2. Bansal V, Libiger O, Torkamani A, Schork NJ:Statistical analysis strategies for association studies involving rare variants.Nat Rev Genet2010,
11:773-785.
3. Ball MP, Thakuria JV, Zaranek AW, Clegg T, Rosenbaum AM, Wu X, Angrist M, Bhak J, Bobe J, Callow MJ,et al:A public resource facilitating clinical use of genomes.Proc Natl Acad Sci U S A2012,109:11920-11927. 4. Maurano MT, Humbert R, Rynes E, Thurman RE, Haugen E, Wang H,
Reynolds AP, Sandstrom R, Qu H, Brody J,et al:Systematic localization of common disease-associated variation in regulatory DNA.Science2012,
337:1190-1195.
5. Derkach A, Lawless JF, Merico D, Paterson AD,et al:Evaluation of association tests and gene annotations for analyzing rare variants using GAW18 data.BMC Proc2014,8(suppl 2):S9.
6. Wang K, Li M, Hakonarson H:ANNOVAR: functional annotation of genetic variants from high-throughput sequencing data.Nucleic Acids Res2010,
38:e164.
7. Kumar P, Henikoff S, Ng PC:Predicting the effects of coding
non-synonymous variants on protein function using the SIFT algorithm.
8. Adzhubei IA, Schmidt S, Peshkin L, Ramensky VE, Gerasimova A, Bork P, Kondrashov AS, Sunyaev SR:A method and server for predicting damaging missense mutations.Nat Methods2010,7:248-249. 9. González-Pérez A, López-Bigas N:Improving the assessment of the
outcome of nonsynonymous SNVs with a consensus deleteriousness score, Condel.Am J Hum Genet2011,88:440-449.
10. Siepel A, Bejerano G, Pedersen JS, Hinrichs AS,et al:Evolutionarily conserved elements in vertebrate, insect, worm, and yeast genomes.
Genome Res2005,15(8):1034-1050.
11. Pollard KS, Hubisz MJ, Rosenbloom KR, Siepel A:Detection of nonneutral substitution rates on mammalian phylogenies.Genome Res2010,
20:110-121.
12. Espin-Garcia O, Shen X, Qui X, Brhane Y,et al:Genetic association analysis for common variants in the GAW18 Data: a Dirichlet regression approach.BMC Proc2014,8(suppl 2):S70.
13. Fu W, O’Connor TD, Jun G, Kang HM, Abecasis G, Leal SM, Gabriel S, Rieder MJ, Altshuler D, Shendure J,et al:Analysis of 6,515 exomes reveals the recent origin of most human protein-coding variants.Nature2013,
493:216-220.
14. MacArthur DG, Balasubramanian S, Frankish A, Huang N, Morris J, Walter K, Jostins L, Habegger L, Pickrell JK, Montgomery SB,et al:A systematic survey of loss-of-function variants in human protein-coding genes.
Science2012,335:823-828. doi:10.1186/1753-6561-8-S1-S11
Cite this article as:Nalpathamkalamet al.:Genetic Analysis Workshop 18 single-nucleotide variant prioritization based on protein impact, sequence conservation, and gene annotation.BMC Proceedings2014
8(Suppl 1):S11.
Submit your next manuscript to BioMed Central and take full advantage of:
• Convenient online submission
• Thorough peer review
• No space constraints or color figure charges
• Immediate publication on acceptance
• Inclusion in PubMed, CAS, Scopus and Google Scholar
• Research which is freely available for redistribution