2017 3rd International Conference on Artificial Intelligence and Industrial Engineering (AIIE 2017) ISBN: 978-1-60595-520-9
Design and Implementation of Port Security System Based on WebGIS
Chen PAN
*, Shuai ZHAO
and Bo CHENG
State Key Laboratory of Networking and Switching Technology, Beijing University of Posts and Telecommunications, Beijing, China.
*Corresponding author
Keywords: Port security, Integrated visualization, Intelligent alarm, WebGIS, IoT.
Abstract. With the rapid development of the IoT (Internet of things) technology, people could monitor port areas with multi-source heterogeneous devices. However, in the most of the current IoT systems used for monitoring and alarming, the sensing devices are working independently and the collected raw data can’t provide people with effective information to make quick decisions. To attack this challenge, we propose a security system combined the IoT with GIS (geographic information system). The system presents the port situation in an intuitive way based on WebGIS and analyses the raw data to issue event alarm intelligently based on the actual demand.
Introduction
Nowadays, area security changes from "human defense" to "technical defense". Taking advantage of the IoT technology to monitor objects provides people with great convenience and high efficiency. However, in most of IoT systems, the sensing devices are working separately, which restricts the real-time and intelligent advantage. Therefore, a mature security system faces to two challenges: a) Find an intuitive presentation way to present multi-source data from heterogeneous devices. b) Combined with the actual security demand, extract information from data to help situation awareness. For the presentation way, due to the wide variety and large number of security devices, if we just use page list to show information, it’s not friendly for users to search and operate, and what’s more, the devices and alarm events are both based on geographical position, it’s hard to describe it with text-only information. Therefore, map is the preferred way to present the security system, which will make the data more intuitive, clear and accurate.
For the situation awareness, considering that the raw data collected from different sensors is multi-dimensional, data processing and data fusion is necessary. We should mask the sensor details and focus on showing the information of target dimension, which guards are concerned about. In addition to, it will be helpful that the system automatically discerns the alarm events, because compared with showing the target data, the way that machine take on more computing work save manpower and increase accuracy.
Based on the above analysis, in this paper, we propose a port security system combined IoT and GIS. The system is a Web application based on MVC architecture and Java EE SSH (Struts-Spring-Hibernate) framework and adopt SuperMap as a WebGIS development framework.
Related Work
GIS Architecture
GIS system architecture is changing from C/S (client/server) architecture to B/S (browser/server) architecture [1]. Compared with stand-alone version of the GIS system, online edition is more widely used. Meanwhile, displaying the GIS system in browser mode is conducive to the exchange and sharing of information.
First, on the database side, we need to load the underlying map, referring to the tile format stored in the pyramid underlying data. Besides, it is necessary to associate with the relational database contains the targets and devices information. Second, on the server side, the iServer publish the map service and the Apache server complete business logic association. Third, in the Presentation layer, we need html5, css3 and JavaScript to support and we use SuperMap iClient for JavaScript 9D to redevelopment the map. iClient is a cloud GIS network client development platform. It is integrated leading open source library, visual library and the core code to Apache2 protocol. Through this, the product can be quickly achieved the beautiful, smooth map presentation and spatial analysis on the browser and mobile side. [3]
AJAX and WebGIS
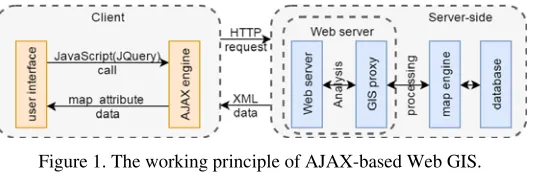
WebGIS is a geographic information system running on the Internet. Its core is to embed the HTTP standard application system in GIS, and realize the spatial information management and distribution in Internet environment. The basic principle of WebGIS is that the user accesses the Web page through the browser, sends the map operation request to the Web server. The Web server parses the command through the GIS agent and communicates with the map server. But in this way, when updating the web pages, the client submit the form and the server return the data, and each return will refresh the entire page, resulting in the user waiting for too long time. What’s more, frequent refresh will also result in data transmission redundancy, and increase server-side pressure. This problem has been restricting the application and development of WebGIS.
[image:2.612.176.443.360.448.2]In recent years, the rise of AJAX (Asynchronous JavaScript and XML) provides a good solution to this problem. The working principle of AJAX-based WebGIS is shown in Figure 1.
Figure 1. The working principle of AJAX-based Web GIS.
It establishes the middle layer between the client and server with AJAX engine and uses JavaScript’s XMLHttp Request object to communicate with server directly to avoid overloading the page. AJAX-based WebGIS has the following advantages: a) Users can request for partial page that they are concerned to get faster response. b) Reduce the communication data between the client and server to reduce server-side pressure. c) It is based on the standardization and is widely supported technology, so the client doesn’t need to install any plug-ins.
Architecture of Port Security System
System Architecture
The IoT architecture can be divided into three layers: a) The sensing layer is composed of various sensors, so it is the source of object identification and collected information. b) The network layer that consists of various networks is the center of IoT and it is responsible for transmitting and processing the information obtained by the sensing layer. c) The Application layer is the interface of IoT to users, so it is combined with industry needs to achieve the intelligent application of things. In this paper, the port security system focused on expanding the application layer. The overall structure is shown in Figure 2.
resource access platform is the lowest level component of IoT software system. It is responsible for processing and analyzing the sensor device data initially. c) The publish/subscribe system is the center of the system that connects other components. It receives the latest devices data published from the uniform resource access platform and update the subscription data for the database and data processing/fusion system. d) The database layer consist of the business relational database and the GIS database. Business database use MySQL’s memory storage to store recent data for system calls. Once over a certain time, the data will be transferred to the hard disk. GIS data is made by SuperMap iDesktop and published as REST or WTMS service by SuperMap iServer. e) In the data processing/fusion system, the raw data is analyzed by both real-time processing and batch processing according to the specific business needs. f) The situation awareness system establishes the business logic of the security system, obtains the data, exchanges the information among the user to complete the corresponding business process.
Figure 2. Port Security System Architecture.
Structure of Situation Awareness System
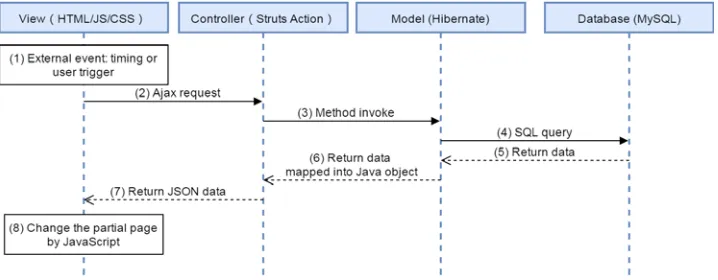
The situation awareness system integrates Java Web SSH framework. In the persistence layer, the model is presented according to the business requirements and the model-related data tables are analyzed to compile the Hibernate mapping file and persistence class. In DAO layer, according to the persistent operation, the corresponding method is determined to compile DAO interface and implement the class. Then in business layer, we write the business logic as service method interface to call Hibernate DAO. Finally in the Web layer, we write Struts Action method to deal with the interaction between pages and business, use JSP pages or HTML pages to render the web pages, and achieve page interaction. Spring is the framework for managing struts and hibernate.
[image:3.612.128.487.579.719.2]In this paper, the SSH framework integrated on Web server-side is achieved by MVC (Model–view–controller) separation model. MVC is a software architectural pattern. It divides a given application into three interconnected parts. This is done to separate internal representations of information from the ways information is presented to, and accepted from, the user [5]. Data upload flow chart of situation awareness system is shown in Figure 3.
Function Design
[image:4.612.182.430.310.442.2]In the design of situation awareness system that interacts with user directly in port security system, the basic principle is as follow: product design is for user perception, the goal is to clear the desired function, characteristics and user expectations, rather than completely dependent on the technical architecture. On the other side, the technical architecture is for lower cost, extensibility and compatibility while meeting the user perception. According to this principle and considering that the port security system users have no technical background, it is necessary to provide simple and reliable function interaction. The function modules of the situation awareness system divided by business logic are listed in Figure 4. The modules mainly contain map operations, real-time monitoring of targets (no concern for underlying detection details), intelligent alerts (based on personalized alarm event settings), and device management modules. The features and the difficulties of realizing the function modules and their sub-modules will be specified in the following sections.
Figure 4. Situation Awareness System - Function Structure.
Implementation of Port Security System
Geographic Information Module
Geographic information module mainly deals with GIS-related functions, including three parts: map display, map operation and map selection. Map display includes the call of map service and the vector graphics display. The basic operations of map include zoom in, zoom out, free zoom, open and close eagle eye, map calculation and layer management. Map selection involves the management of different map resources. Use iDesktop to make different formats of different sources of data source into a standard map and meet different specific scene requirements by switching the electronic map and sea chart. Switch the area by top tab and set the corresponding map center and zoom level.
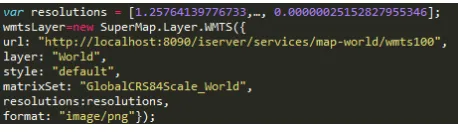
Figure 5. Code of initializing the WMTS.
[image:4.612.192.421.618.684.2]iClient provides Layer.WMTS interface to docking with WMTS services, obtaining tile maps, and mapping as well as rendering the map tiles on the Web side. Layer.WMTS object sets URL, matrixSet, layer, style, format, resolutions properties to dock with the WMTS service. These attributes can be obtained from the WMTS service capabilities file. The process of docking with WMTS service published by SuperMap iServer is as follow: (1) Get the WMTS service capabilities file through GetCapabilities request. (2) Parse the file. (3) Initialize the WMTS layer. The code is as Figure 5.
Target RTA (Real Time Analyzer) Module
Conduct a comprehensive analysis for the target information that detected by different means and design a common information display way. Shield detection means and provide high-level target presentation. The information is divided into text information, picture information and video information. Use tabular form to display the text information, while switch multi-layer to show picture and video information through the SuperMap iClient layer control.
Intelligent Alarm Module
According to the actual needs, the port area can be further divided into zones with different risk levels. In order to achieve personalized management, we set intelligent alarm module and divide it into two sub-modules: protected zone management and alarm event management.
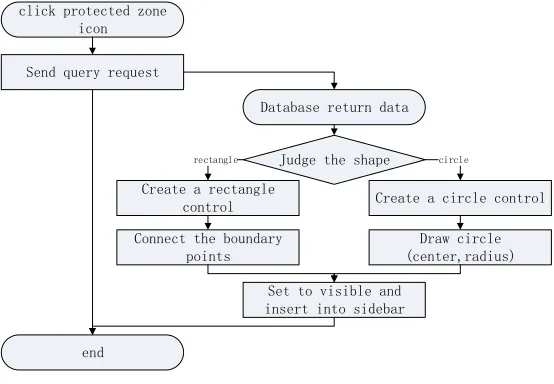
Protected zone management sub-module: Integrated distance, location and other factors, the protected zone can be set to three alarm levels: 1-against the strike zone, 2-the core protected zone and 3-the monitoring zone. This function are achieved by draw control. Users can create a rectangle or circle protected zone and look up or delete the existing zones. Take displaying protected zone for an example and the flow chart is as Figure 6.
click protected zone icon
end Send query request
Database return data
Set to visible and insert into sidebar
Judge the shape
Create a rectangle
control Create a circle control
Connect the boundary points
Draw circle (center,radius)
[image:5.612.168.445.384.576.2]rectangle circle
Figure 6. Flow chart of displaying protected zone.
Device Management Module
As a backend part of the security system, device management module helps user monitor the device information and the communication link. Considering that in the actual scene, the location of a variety of devise is coincident. The concern of the user is the communication status among the devices, so we adopt topology map to show the communication link.
[image:6.612.91.525.227.337.2]In many topology drawing tools, we choose Qunee for HTML5 (hereinafter called Qunee) to draw the network extension map. Qunee is a graphic component product based on HTML5 technology, for drawing clean and smooth network graph, JS component packaging, turn complicated to easy, easily building elegant Internet application and enterprise application, and make the online visualization of data easier[6]. In this paper, we consider each device as a node and each communication link as an edge and use network graph layout. The series of element types are shown in Figure 7.
Figure 7. Series of element types [6]. Figure 8. Screenshot of communication link.
We get real time access to device information, communication on-off status and transmission mode and dynamically display it in the user interface. The color is used for distinguish transmission mode, the flashing effect represents a transmission failure, and the animated effect vividly represents the transmission of data. The screenshot is shown in Figure 8.
Summary
This paper designs and implements the port security system possessed with functions of geographic information module, target RTA module, intelligent alarm module, and device management module. Combined IoT and GIS, the system helps security personnel monitor and aware the situation of port area. The system plays an important role for keeping port security, and also has certain significance to other construction of area security and protection.
Acknowledgement
This work is supported by National Natural Science Foundation of China (Grant No.61501048); The Fundamental Research Funds for the Central Universities (Grant No. 2017RC12); National Natural Science Foundation of China (Grant No.61372115).
References
[1] Kang Yong, Liang Zhi. The Progress of GIS (2011 ~ 2015): The Application and Practice of GIS in Urban and Rural Architectural Heritage Field.
[2] Niu M.J. River water quality monitoring and simulation based on WebGIS-Anhui Yinghe River as an example [J]. IMCCC, 2016(8): 716-720.
[3] Information on https://www.supermap.com/cn/
[4] Wu Yunchao, Wang Wen, Niu Zheng, Song Guojun. Integrating Ajax Approach into WebGIS [5] Trygve Reenskaug, James Coplien. The DCI Architecture: A New Vision of Object-Oriented Programming, 2009.
![Figure 7. Series of element types [6]. Figure 8](https://thumb-us.123doks.com/thumbv2/123dok_us/279839.1028514/6.612.91.525.227.337/figure-series-element-types-figure.webp)
