New PN Even Balanced Sequences
for Spread-Spectrum Systems
J. A. L. In ´acio
Instituto de Engenharia de Sistemas e Computadores (INESC), Rua Alves Redol 9, 1000 Lisboa Codex, Portugal
ENIDH, Avenida Bonneville Franco, Pac¸o D’Arcos, 2780 Oeiras, Portugal Email:[email protected]
J. A. B. Gerald
Instituto de Engenharia de Sistemas e Computadores (INESC), Rua Alves Redol 9, 1000 Lisboa Codex, Portugal Email:[email protected]
Instituto Superior T´ecnico (IST), Universidade T´ecnica de Lisboa, Avenida Rovisco Pais, 1000 Lisboa, Portugal
M. D. Ortigueira
Instituto de Engenharia de Sistemas e Computadores (INESC), Rua Alves Redol 9, 1000 Lisboa Codex, Portugal
UNINOVA, Campus da FCT da UNL, Quinta da Torre, Monte da Caparica, 2825 - 114 Caparica, Portugal Email:[email protected]
Received 30 October 2003; Revised 16 February 2005; Recommended for Publication by Alex Gershman
A new class of pseudonoise even balanced (PN-EB) binary spreading sequences is derived from existing classical odd-length fami-lies of maximum-length sequences, such as those proposed by Gold, by appending or inserting one extra-zero element (chip) to the original sequences. The incentive to generate large families of PN-EB spreading sequences is motivated by analyzing the spreading effect of these sequences from a natural sampling point of view. From this analysis a new definition for PG is established, from which it becomes clear that very high processing gains (PGs) can be achieved in band-limited direct-sequence spread-spectrum (DSSS) applications by using spreading sequences with zero mean, given that certain conditions regarding spectral aliasing are met. To obtain large families of even balanced (i.e., equal number of ones and zeros) sequences, two design criteria are proposed, namely the ranging criterion (RC) and the generating ranging criterion (GRC). PN-EB sequences in the polynomial range 3≤n≤6 are derived using these criteria, and it is shown that they exhibit secondary autocorrelation and cross-correlation peaks comparable to the sequences they are derived from. The methods proposed not only facilitate the generation of large numbers of new PN-EB spreading sequences required for CDMA applications, but simultaneously offer high processing gains and good despreading char-acteristics in multiuser SS scenarios with band-limited noise and interference spectra. Simulation results are presented to confirm the respective claims made.
Keywords and phrases:even balanced spreading sequences, PN sequences, processing gain, direct-sequence spread spectrum.
1. INTRODUCTION
In the first half of the 20th century, spread-spectrum (SS) systems were conceived in order to guarantee privacy and low probability of interception (LPI) in military commu-nications. Later, their applications began to include most of the tactical military communications (as in, e.g., loca-tion and posiloca-tioning monitoring, weapons and missile ar-mament control, electronic warfare, etc.). However, their properties, such as resistance against intentional or
inadver-This is an open access article distributed under the Creative Commons Attribution License, which permits unrestricted use, distribution, and reproduction in any medium, provided the original work is properly cited.
IMT-2000 (UMTS and 3GPP) standards [5]. In CDMA applica-tions, the choice and availability of large families of spread-ing sequences with good correlation properties remains a primary design consideration.
Amongst the well-known forms of SS, such as direct-sequence SS (DSSS), frequency hopping (FH), time hopping (TH), linear FM (chirp), and hybrid methods [4,5,6,7,8], this paper will focus on DSSS communication systems. In DSSS systems employing BPSK modulation, spreading is achieved by multiplying or modulating a low symbol (bit) rate binary information sequence with a pseudonoise (PN) signal generated by means of a shift register running at a con-siderably higher symbol or “chip” rate (1/τchips/s) than the information bit rate (bps). The resulting frequency spread signal occupies a much wider bandwidth than the original BPSK signal. The increase in the output signal-to-noise ratio (SNR), as a result of the spectral spreading process, is known as processing gain (PG). Since the primary objective of the paper is an analysis of the spreading effect achieved by the PN spreading sequences, PSK modulation will henceforth be ne-glected and only a baseband DSSS system will be considered. The outline of the paper is as follows. InSection 2, the spreading process is analyzed in detail. Unlike the classic approach that assumes the spreading signal to be a binary stochastic process (almost true for long period sequences, which is useful when secrecy is required), the interest here is mainly in achieving acceptable performance for the system from a communication theory point of view, namely, to en-sure a high signal-to-noise ratio at the demodulator output. As a consequence, the spreading signal is treated as periodic and an understanding of particular features of the spreading process is investigated within the framework of the sampling theory, in an attempt to gain a better insight into the pro-cess [9]. It is found that the PG is not only a simplistic rela-tion between the chip and bit rates, but also a funcrela-tion of the channel noise and interference. Consequently, inSection 3, a new definition for processing gain (PG) is formulated, and it is shown that the classical definition is a special case of the new one [9]. A close look into the spreading process, as well as the new PG definition reveals that very high PG can be obtained under certain circumstances; one of them is the use of zero-mean spreading sequences. This observa-tion motivated a search for zero-mean spreading sequences. So, Section 4introduces methods to generate new families of pseudonoise even balanced (PN-EB) sequences obtained from existing odd-length maximum-length sequences (so-calledm-sequences) by appending or inserting an extra chip to yield an even length sequence with an equal number of “ones” and “zeros.” However, this modification has to be done in such a way that the new PN-EB sequences retain the good correlation properties of the sequences they are de-rived from. To achieve this goal, two design criteria are in-troduced, namely the ranging criterion (RC) [10] and the generating ranging criterion (GRC) [11]. These criteria are demonstrated to yield large numbers of balanced sequences exhibiting low levels of secondary cross-correlation and “out-of-phase” autocorrelation peaks. Simulation results are pre-sented inSection 5to verify and confirm the correctness of
the proposed RC and GRC criteria. Finally, concluding re-marks are presented inSection 6.
2. CONSIDERING DSSS FROM A NATURAL SAMPLING PERSPECTIVE
Let x(t) be a signal, not necessarily band-limited, with Fourier transform (FT),X(ω). The natural sampling ofx(t) comprises the multiplication ofx(t) by a periodic rectangu-lar pulse sequence,r(t), which is assumed to have unit am-plitude, aTseconds period, and pulse widthτgiven by
r(t)= sented by the Fourier series (FS) with coefficients
rn=Tτ ·sinc
It can be seen that
(i) the number of spectral lines in a given band depends only on the sampling interval,T;
(ii) rnas a function of “n” has infinite lobes;
(iii) the number of spectral lines in the main lobe depends on the duty cycle of the pulses, expressed asτ/T.
Let xs(t) be the natural sampling of x(t) obtained by the product ofx(t) byr(t). Its spectrum is
Xs(ω)=
As this sampling operation is equivalent to a uniform and weighted repetition ofX(ω),xs(t) is a spread-spectrum sig-nal. In the particular case of no aliasing, one can recover a weighted version ofx(t) by means of a lowpass filtering oper-ation. In the general case, with aliasing, there is no possibility of removing the spreading effect (despreading).
Consider, now, a high-order sampling scheme in which x(t) is sampled by several delayed sampling series, as shown inFigure 1.
Before the sampled signals are added, they are multiplied by coefficientsai(i=0, 1,. . .,N−1) that can only take on two values, that is,ai∈ {−1, +1}. IfN=T/τis the number of sampled versions ofx(t), the output sp(t) results in the weighted sum ofNsignalssi(t):
τ
Figure1: Construction of the SS signal from the sampled signals.
only one of theNdelays has a nonzero value. In some partic-ular combinations of weights, the spreading is destroyed (as, e.g., when allai=1 or allai= −1 (i=0,. . .,N−1), which will result in asp(t) signal equal tox(t) or−x(t), resp.). How-ever, in general, the signalsp(t), being a linear combination of SS signals, is an SS signal, too. In fact, it follows from (5) that
whereb(t) is a periodic signal with periodTand Fourier co-efficients given by
bn=rnA(n), (7)
whereA(n)/Nis the DFT of the sequenceak,k=0,. . .,N−1. The existence, or not, of spreading is determined by A(n). In the referred trivial cases where allai = 1 or allai = −1, i=0,. . .,N−1,A(n)= ±Nδ(n)(modN), and so, the coef-ficients corresponding to indicesn=0 are null. Ifaj=aifor at least one pair (i= j), spreading will occur. For nontrivial cases, the SS signalsp(t) can be obtained by multiplyingx(t) by a spreading functionb(t), periodic with periodT. Each period ofb(t) is a linear combination of rectangular pulses of durationτ:
The analysis of (4) and (6) shows thatSp(ω) can be thought of as composed of an infinite number of replicas ofX(ω),
x(t)
Figure2: Ideal DS communication system.
with N replicas at each spectral line, ω = (2πn)/T, n = −∞,. . ., 0,. . ., +∞. Each replica is weighted by a coefficient
bni=airn·e−j(2π/N)in, i=0,. . .,N−1. (9)
The signal sp(t) is called a direct-sequence (DS) spread-spectrum signal. The despreading operation is accomplished by multiplyingsp(t) by a synchronous version of the spread-ing sequence:
sp(t)·b∗(t)=x(t)·b(t)2
=x(t) (10)
if |b(t)|2 = 1. Thus, the despreading process results in all repetitive spectral information terms, X(ω), to be trans-lated back to zero frequency, where they add up to recon-struct x(t). For a given r(t), the spreading sequence term
|A(n)|2 {see (7)}, which is periodic with periodN, deter-mines the smearing of the signal energy over the entire spec-trum.|A(n)|2is the sampled version of the spectrum of the ai’s sequence and also the DFT of the autocorrelation,Ra(n), of theai,i=0,. . .,N−1. An interesting case is the classical
which corresponds to a pseudonoise sequence.
3. THE NEW INTERPRETATION AND DEFINITION OF PROCESSING GAIN
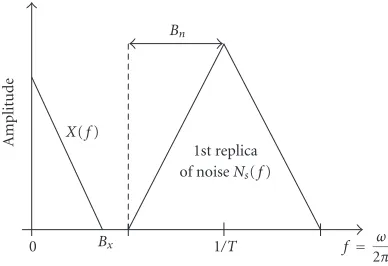
InFigure 2an ideal DS-SS communication system is repre-sented. The only information needed about the modulating signal is its bandwidth, which is needed to fix the bandwidth of the output lowpass filter,Bx. The system output is the sum of the information signalx(t) and a noise signalnf(t), which is a filtered version of the spread noisens(t).
The output signal power does not depend on the per-formed spreading, because, ideally, the original signal must be recovered. However, the output noise power depends on the spreading. In general, the output signal-to-noise ratio with, and without, spreading, will be different. So, it makes sense to define theprocessing gain(PG) as the quotient be-tween the output signal-to-noise ratios, with and without spreading, according to [9]:
PG= Ss/Ns
0 Bx 1/T X(f)
Bn
f = ω
2π 1st replica
of noiseNs(f)
A
m
plitude
Figure3: Reference bandBxand noise bandBn.
OnceSs=S0, it follows that
PG=N0Ns. (13)
The processing gain is the most important feature used in literature to qualify the performance of an SS system. The PG is usually defined as the quotient between the spread signal and signal bandwidths. In the case of a binary sig-nal source, this gain is the quotient between the spread-ing chip rate and the source bit rate [5,6,8]. Later it will be seen how to make this definition compatible with (12). To compute the PG, as defined in (12), it is necessary to analyze the effect of spreading of the noise. Consider first the non-band-limited noise and assume, by simplicity, that n(t) has a constant spectrum, N(ω) = 1; in this case, it follows that Nf(ω) = N(ω) (note that ∞−∞rnA(n) =
1). This result confirms the usual affirmation: “the DS-SS has no effect on the white noise” [13,14,15]. For a non-band-limited and nonflat spectrum, the analysis is more in-volved and complex. A discussion of this case is presented in a later section. However, assuming that the spectrum decreases with the frequency, it is not difficult to see that there will be an energy concentration at the lower frequen-cies and the PG will be near 1. For a band-limited noise, the situation is quite different. Consider any noise signal, n(t), with FTN(ω) and bandwidthBn. After spreading, the FT of the noise ns(t) is a sequence of repetitions of N(ω) located at multiple frequencies of 2π/T. In the reference band, Bx, the total number of replicas decreases with T, and this decreasing stops whenT is less than 1/(Bn+Bx). Below this limit there is only one replica of the original noise signal, located at the zero frequency, as illustrated in Figure 3.
This is the best situation. The ratio between the noise power before and after spreading, inside the basebandBx, is given by
PG= 1
r0A(0)2 = 1
(τ/T)A(0)2. (14)
In the case of a PN spreading sequence,|A(0)| =1, and with T/τ=N, it results in
PG=N2. (15) If T is greater than 1/(Bn+Bx), there is aliasing inside the reference band which will increase the output noise power. In the limit, asTincreases indefinitely, the number of spec-tral lines inside the bandBxincreases and the spectrum be-comes almost continuous. It is like a sliding, into the interval [−Bx,Bx], of 2BxT spectral lines and corresponding repli-cas of the noise with a power (see (2) and (11)) equal to 2(N+ 1)BxT/N2≈2BxT/N =2Bxτ.1So, the PG will be
PG= 1
2Bxτ . (16)
As 1/τ, the chip rate, is equal to twice the spreading sequence bandwidthBs, the PG can be written as
PG=BxBs, (17) which is the classic PG definition [16]. Recall that the best situation occurs whenT≤1/(Bx+Bn), requiring a PG given by (13), which is different from the classic definition in (17). A close look into (14) reveals a way to increase the PG. In an ideal situation, using a spreading signal with a zero-mean value, the PG will be infinite. This may seem rather strange, but not impossible to conceive. There are two ways to achieve this:
(i) using odd balanced sequences by increasing the period with one “zero” chip, in order to make the number of ones and zeros equal;
(ii) using a Manchester pulse shape instead of a rectangu-lar one, at the price of an increase (doubling) of the required information bandwidth. For this reason, this method was not used in this paper.
This means that with a small enough spreading sequence pe-riod (usually used in narrowband applications) that leads to spectral lines far apart and a zero-mean sequence, a band without noise will appear. In the modulating case, this band will originate the lower and upper sidebands. Simulation re-sults are presented in Figures12,13,14, and15ofSection 5.5.
4. GENERATION OF PN-EB SEQUENCES 4.1. Even sequences
The new definition of processing gain points out the ad-vantage of generating families of zero-mean spreading se-quences to maximize the processing gain of a DSSS sys-tem. These spreading sequences should also have good auto-and cross-correlation properties to make them suitable for CDMA applications. Thus, it is required that the proposed family of spreading sequences have very low secondary cor-relation peaks.
TCH-derived
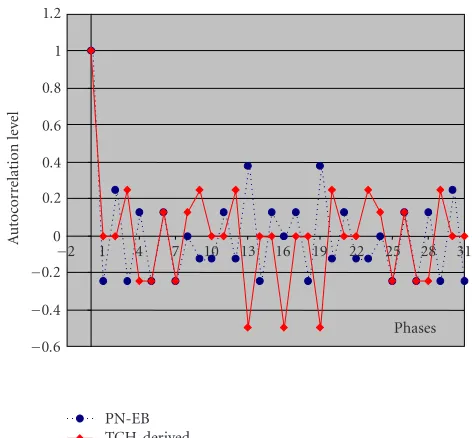
Figure 4: Autocorrelation level of TCH-derived and PN-EB
se-quences.
In a first step, the pseudonoise even balanced (PN-EB) sequences were developed from the Gold sequences [17], by appending one extra-zero to each original Gold sequence. The reason for this choice of the “extra-zero” insertion pro-cess lies in its easy implementation. We will call them PN-EB original sequences. As known [18,19,20], the Gold se-quences are generated from pairs ofm-sequences. It is possi-ble, for each pair ofnth-orderm-sequences, to generate 2n+1 Gold sequences. In order to present the PN-EB sequences, Gold sequences of length 31 (polynomial generator with de-green = 5) were used. In this case there are 396 balanced sequences [18,19,20]. According to their properties, they present three levels of autocorrelation [21,22,23,24].
Another viable alternative is to use the TCH-derived se-quences presented in [25], which also arem-sequences with length 2nand assume low correlation levels.Figure 4shows identical autocorrelation peak values for TCH-derived and PN-EB original sequences.
A comparative analysis of the highest secondary peak level of the autocorrelation function between these two types of even sequences shows that both the processes present sim-ilar levels (seeTable 1).
InTable 1, the number of sequences by levels of the high-est secondary peak of the autocorrelation of the known TCH-derived and PN-EB original sequences are presented.
However, when doing a comparison between TCH-derived and PN-EB sequences (with the same period), the TCH-derived sequences present the disadvantage of existing in a smaller number (for identical values of the autocorre-lation function). The number of available sequences is very important when we want to accommodate a great number of individual users [4,18].
In a second step we studied the advantage that results from adding the extra-zero to the longest run of “0’s” [26] in the worst autocorrelation cases (absolute levels of normalized
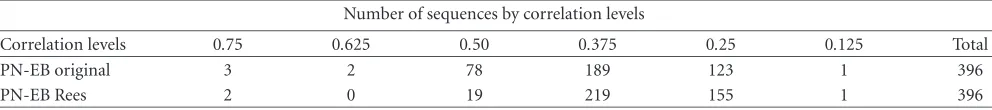
correlation≥ 0.5). This is the Rees criterion [27,28] (note that this criterion was only applied by Rees in the m-sequences case [27]). This procedure led to the results ex-pressed inTable 2, assigned as “PN-EB Rees.” We applied the Rees criterion to the 83 worst cases of secondary autocorre-lation peaks of the PN-EB original sequences, indicated in Table 1(values≥0.5). This procedure led to a significant re-duction in the number of worst cases. Although this new set of PN-EB sequences presents a higher number of sequences with lower correlation levels, 21 sequences still remain with-out improvement.
A study of the Rees criterion [29] leads to the conclusion that when applied to anym-sequence generated by a primi-tive polynomial, it produces a minor change in the secondary autocorrelation levels.
In the case of Gold sequences, it produces an improve-ment on the secondary correlation levels in 62 sequences.
With the main goal of improving the 21 still remaining cases, the two following methods were formulated, as solu-tions for the extra-zero positioning problem: (i) to optimize the positioning process through the analysis of the autocor-relation function; (ii) to apply the Rees criterion, not to the Gold sequences, but to one of the twom-sequences genera-tors, in this case, the primary sequence2[30,31] (the one that is characterized by its characteristic phase [32]).
This led to the formulation of two different approaches to generate the PN-EB sequences as described next.
4.2. The ranging criterion
In the ranging criterion (RC), the extra-zero positioning pro-cess is sequential and it is described by the following sequen-tial steps:
(1) the extra-zero will be inserted at the end of the se-quence period;
(2) in all those sequences that still present a high level of correlation (e.g.,>0.5), the extra-zero will be inserted in the bigger run of 0’s;
(3) for those sequences whose improvement was not reached with the steps (1) and (2), the extra-zero is placed at therunof 0’s, nearest to the [(N+ 1)/2 + 1]th symbol position;
(4) for sequences whose improvement was not obtained with the steps (2) and (3), the extra-zero should be placed at lastrunof 0’s.
The first step results from the most simple and immediate process. However, from the derived sequences, some of them present an undesirable increase of the autocorrelation sec-ondary peak values regarding the original Gold sequences. For these, step (2) (the Rees criterion [27]) is applied for its efficiency and simplicity (the resulting sequences are named PN-EB Rees sequences). Nevertheless, this process may not
2This concept of “primary sequence generator” and “secondary sequence
Table1: Comparison between known TCH-derived and PN-EB original sequences.
Number of sequences by correlation levels
Correlation levels 0.75 0.625 0.50 0.375 0.25 0.125 Total
PN-EB 3 2 78 189 123 1 396
TCH 0 0 22 62 41 3 128
Table2: Improvement of the PN-EB sequences using the Rees criterion to the 83 worst “PN-EB original” sequences.
Number of sequences by correlation levels
Correlation levels 0.75 0.625 0.50 0.375 0.25 0.125 Total
PN-EB original 3 2 78 189 123 1 396
PN-EB Rees 2 0 19 219 155 1 396
Table3: Improvement with the RC and the GRC.
Number of sequences by correlation levels
Correlation levels 0.75 0.625 0.5 0.375 0.25 0.125 Total
PN-EB original 3 2 78 189 123 1 396
PN-EB w/RC 0 0 0 233 162 1 396
PN-EB w/GRC 0 0 0 231 164 1 396
resolve all the undesirable cases. The partial results regarding these two initial steps, for the casen = 5, are presented in Section 5.1.
In order to proceed with the worst cases, the analysis of the autocorrelation function was performed to determine the optimum localization for the extra-zero to reach low values for the secondary peak levels of the autocorrelation function. A detailed analysis is presented in [30].
4.3. The generating ranging criterion
The second criterion considered here uses both the process of positioning the extra-zero in a sequential mode and the primarym-sequence generator to determine the final phase for the extra-zero, thus this criterion was called thegenerators ranging criterion (GRC) [11]. Starting from Gold balanced m-sequences, this criterion is summarized in the following steps:
(1) the extra-zero will be inserted at the end of the se-quence period;
(2) in all those sequences that still present a high level of correlation (e.g.,>0.5), the extra-zero will be inserted in the bigger run of 0’s;
(3) if still there are sequences whose improvement was not reached with steps (1) and (2), then, the extra-zero will be inserted next to the 1st or the 2nd bigger run of 0’s of the primarym-sequence generator.
The development of the generators ranging criterion was based on
(a) the fact that the Rees criterion does not make signifi-cant alterations in the values of the secondary peaks of autocorrelation function;
(b) a simple characterization of the position of the extra-zero symbol.
Remark that, it is implied in the third step that an extra-zero in the same phase position is also inserted in the secondary m-sequence generator.
The option for choosing the position using the primary m-sequence generator relatively to the secondary sequence generator is justified by the simplicity of the Gold criteria rel-atively to the definition of the initial conditions for this shift register generator [30].
The generators ranging criterion is based on procedures that Rees developed form-sequences and are applied here to the Gold sequences. Although the extra-zero will appear in the generated Gold sequence, the localization of the extra-zero symbol will now be chosen by the region of the 1st or the 2nd bigger run of 0’s of the “primary m-sequence generator.”
Note that, in all the considered cases, only five (out of all the three hundred and ninety six) produced better re-sults using the 2nd run of 0’s, regarding the autocorrelation levels.
5. SIMULATION RESULTS
5.1. Autocorrelation levels in PN-EB
Gold (31) PN-EB original
0 5 10 15 20 25 30 35
Phase (chips)
−0.5 0 0.5 1
Au
to
co
rr
el
at
io
n
Figure5: Autocorrelations of a Gold sequence and the correspond-ing PN-EB original.
Rees
PN-EB original
0 5 10 15 20 25 30 35
Phase (chips)
−0.5 0 0.5 1
Au
to
co
rr
el
at
io
n
Figure6: Autocorrelation of the PN-EB original and corresponding PN-EB Rees.
FromTable 3, one can also conclude that the GRC leads to similar results to those of the RC. Remark that, in face of the RC in this example of n = 31, the GRC still allows, in some cases, smaller autocorrelation secondary peak levels.
To characterize the evolution of the autocorrelation val-ues along the different steps of the proposed positioning methodology, in Figures5,6,7, and8the autocorrelations are shown for one of the worst cases inTable 2. The figures illustrate the steps from the originally Gold sequence to the final PN-EB sequence.
PN-EB w/RC PN-EB original
0 5 10 15 20 25 30 35
Phase (chips)
−0.5 0 0.5 1
Au
to
co
rr
el
at
io
n
Figure 7: Autocorrelation of the PN-EB original and the corre-sponding PN-EB with RC.
PN-EB w/GRC PN-EB w/RC PN-EB original
0 5 10 15 20 25 30 35
Phase (chips)
−0.5 0 0.5 1
Au
to
co
rr
el
at
io
n
Figure 8: Autocorrelation of the PN-EB original and the corre-sponding PN-EB with RC and PN-EB with GRC.
InFigure 5one can observe that the result of the extra-zero inserted at the end of the Gold sequence period, generat-ing the PN-EB original sequence, implies a certain degrada-tion of the secondary peak levels of its autocorreladegrada-tion func-tion.
Table4: Improvement with the RC and the GRC.
Number of sequences by correlation levels
Correlation levels 0.5 0.437 0.375 0.312 0.25 0.187 0.125 Total
PN-EB original 2 1 7 20 16 1 2 49
PN-EB w/RC 0 0 0 20 26 1 2 49
PN-EB w/GRC 0 0 0 11 33 3 2 49
However, the Rees method did not correct all the higher peaks. Figure 7 shows that the RC method allows correcting this situation, changing the maximum limit of the correlation secondary peaks to values of 0.375.
Another illustrative example from the 21 worst cases of Table 2can be observed inFigure 8, where the extra-zero was placed at the end of another Gold sequence.
This originated a degradation of some secondary peak levels of the autocorrelation function. Both the RC and the GRC overcame this problem, reducing that value to 0.375.
One conclusion to extract from these figures is that, in contrast with what happens with the primitive sequence whose boundary values of the secondary peaks correlation do not exceed the absolute value of 0.25, the application of the Rees criterion to the Gold sequences is not always successful. However, the application of the RC or the GRC process leads to an improvement of the worst autocorrelation levels, pro-ducing sequences with low secondary peak levels, suitable for most cases of use.
Next, some results are presented that characterize and confirm the good performance of the new PN-EB sequences derived through the RC and GRC criteria.
More significant results can be obtained with the degree n=6 as shown inTable 4.
It is significant to refer that preferred pairs do not exist for this case (forn =5 there is a single preferred pair). So, the secondary peaks of the autocorrelation are not expected to have low levels. All the simulations performed with other pairs of sequences generated by 6th-degree polynomials gave results in agreement with the presented examples.
For sequences generated from polynomials with a degree higher thann =6, there are no studies yet. However, these sequences lead to situations with more “aliasing” tendency, which becomes disadvantageous in the context of this study.
5.2. The PN-EB sequences cross-correlation
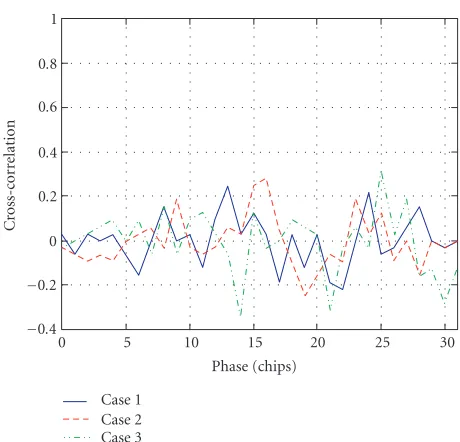
Another important aspect not yet considered is the perfor-mance of the cross-correlation function. All the simulations show that the cross-correlation behaviour for the PN-EB se-quences is similar to that verified with the autocorrelation function out-of-phase, as can be observed in the example il-lustrated inFigure 9.
This result is still similar to that obtained with classic odd sequences. For these, theory predicts the worst values for cross-correlation function to be similar to the autocorre-lation secondary peak levels [33].Figure 9shows the values of the cross-correlation function for three PN-EB pairs.
0 5 10 15 20 25 30
Phase (chips)
−0.4
−0.2 0 0.2 0.4 0.6 0.8 1
C
ross-c
o
rr
elation
Case 1 Case 2 Case 3
Figure 9: Example of three cases of cross-correlation between PN-EB w/GRC sequences.
5.3. Number of available sequences
Comparing the number of PN-EB sequences (and their dis-tribution according to the secondary autocorrelation peak levels) with those obtained using another class of even length sequences (the TCH), the improvement obtained with the proposed sequences is clear (seeFigure 10).
As one can see, besides showing a better distribution of the PN-EB sequences by the values of the secondary peaks of the autocorrelation function, it illustrates the greater number of the PN-EB sequences available. This fact is also important in the case of polynomials of degreen=6. This study con-stitutes an area for exploring.
5.4. Processing gain of PN-EB compared to Gold sequences
TCH-derived PN-EB w/GRC PN-EB w/RC
TCH-derived PN-EB w/GRC
PN-EB w/RC 0.5
0.375 0.25 0.1250
50 100 150 200 250
Correlatio
n levels N
u
mb er of se quenc
es
(a)
TCH-derived PN-EB w/GRC PN-EB w/RC
The sequences
T
o
tal
n
umber
o
f
sequenc
es
0 50 100 150 200 250 300 350 400
(b)
Figure10: Total number of the TCH-derived and the PN-EB
se-quences with length 32.
The odd sequences (difference between the number of zeros and ones equal to 1) had lengths 5, 7, 15, 31, 63, 127, 255, 511, 1023, and 2047, and the even ones had lengths 8, 16, 18, 32, 34, 42, 64, 102, 128, 170, 256, 512, 1024, and 2048. As it can be seen, even for them-sequences (odd) while there is no aliasing, the processing gain still increases withN2and decreases with the aliasing. The used even sequences are bal-anced, so, they present a null mean value theoretically able to lead to an infinite PG. As it can be seen, the gain is very high while there is no aliasing. This fact disappears with the
PN even
m-sequence Manchester
PN-EB
100 101 102 103 104
LengthN 0
20 40 60 80 100 120
Gain
(dB)
Figure11: Comparison of the PG with the PN-EB and classic se-quences versus length of the sequence.
aliasing: the gain decreases to values comparable to those ob-tained with odd sequences. The zero-mean odd sequences are m-sequences(with lengths ranging from 7 to 2047) us-ing Manchester pulses. As it can be seen, without aliasus-ing the gain is very high, as expected. Also, Manchester pulse se-quences present the higher PG when in aliasing conditions.
This can be explained attending to their spectral power density distribution, which is very low near the origin, resulting in low-weighted replicas invading the reference band for the aliasing cases illustrated.
Remark that, essentially, these results concern baseband noise signals. The passband case will be discussed next.
5.5. Spreading sequence PSD analysis: the bandpass-filtered case
The theoretical study of the bandpass noise case is some-how involved. Since a theoretical analysis of the bandpass noise case is quite complex, simulations were carried out to evaluate the performance in the presence of bandpass noise. Recall that at the receiver, despreading is accomplished by multiplying the received channel signal with a local PN spreading sequence and retaining only that part of the recov-ered information signal (and interference) that falls within the data signal bandwidth,Bx. Compared to the original (un-spread) spectrum of the received noise, the despread noise contribution within the signal bandwidthBx will be signif-icantly reduced, resulting in a large PG. To obtain the ac-tual SNR in the information bandBx, the contribution of all band-limited noise replicas (at multiples of the “sampling” or chip frequency) that remain in the information detection band after despreading must be determined.
0 2 4 6 8 10 12 14 16 18 20 Sequence pair number
−5
−4
−3
−2
−1 0 1 2 3 4
M
ax
o
ri
ginal/max
PN-EB
(dB)
Figure12: Twenty examples of Gold sequence spectral maximum
value/PN-EB spectral maximum value.
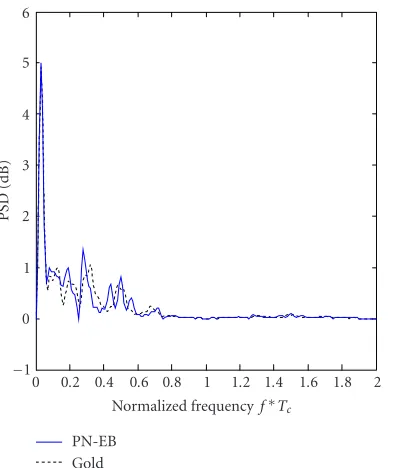
PN-EB Gold
0 0.2 0.4 0.6 0.8 1 1.2 1.4 1.6 1.8 2 Normalized frequencyf∗Tc
−1 0 1 2 3 4 5 6
PSD
(dB)
Figure13: Spectra for pair number 15.
A large difference means a significantly better/worse per-formance of the new PN-EB regarding the original one; on the other hand, a small difference means that, in the worst conditions, the expected performance of the new PN-EB and that of the classic sequence from which it was derived is likely to be the same. Simulation results show that the spectra of the original Gold sequence and that of the PN-EB sequence are not very different, presenting the respective maxima a diff er-ence of a few dBs, as illustrated in the examples ofFigure 12. In Figure 12the difference between the maximum spectral values of the original Gold sequence and that of the corre-sponding PN-EB is shown.
PN-EB Gold
0 0.2 0.4 0.6 0.8 1 1.2 1.4 1.6 1.8 2 Normalized frequency f∗Tc
0 0.5 1 1.5 2 2.5 3 3.5
PSD
(dB)
Figure14: Spectra for pair number 9.
PN-EB Gold
0 0.2 0.4 0.6 0.8 1 1.2 1.4 1.6 1.8 2 Normalized frequency f∗Tc
0 0.5 1 1.5 2 2.5
PSD
(dB)
Figure15: Spectra for pair number 19.
In Figures13,14, and15, one can see spectra of pairs (PN-EB sequence-Gold sequence).Figure 13corresponds to a pair of sequences with a very similar (difference of maxima of 0 dB) spectrum (pair number 15 inFigure 12).
Figure 14corresponds to spectra with difference of max-ima≈ −4.5 dB (pair number 9 inFigure 12) andFigure 15 corresponds to spectra with difference of maxima≈+3.7 dB (pair number 19 inFigure 12).
at the replica frequency), the difference of PG is almost negligible.
6. CONCLUSIONS
In this paper, a new look into the DS spread-spectrum was proposed. A novel definition of processing gain was intro-duced. This allowed concluding that a higher signal-to-noise output ratio can be obtained provided that a zero-mean spreading sequence is used. This led to a search for sequences with such characteristic obtained from pre-existing ones. To achieve this goal a new class of pseudonoise even balanced binary spreading sequences was derived from existing classi-cal odd-length families of maximum-length sequences, such as those proposed by Gold, by appending or inserting one extra-zero symbol to the original sequences. To obtain large families of balanced sequences, two design criteria were pro-posed, namely the ranging criterion (RC) and the generating ranging criterion (GRC). PN-EB sequences in the polyno-mial range order 3≤n≤6 were derived using these criteria. It was shown that they exhibit secondary auto- and cross-correlation peaks comparable to the sequences they are de-rived from.
The most important reasons for the generation of PN-EB sequences are summarized in the following points: (i) their performance is comparable to those with pulses of Manch-ester, without the complexity of the latter; (ii) their corre-lation properties are at least comparable to the Gold ones; (iii) there is the possibility of generating a high number of sequences.
The proposed methods are not only suitable for CDMA applications, but simultaneously offer high processing gains and good despreading characteristics in multiuser SS scenar-ios with band-limited noise and interference spectra. Simula-tion results were presented to confirm the theoretical results.
ACKNOWLEDGMENT
The authors thank the anonymous referees for their valuable suggestions and contributions which increased the paper’s quality.
REFERENCES
[1] R. L. Pickholtz, D. L. Schilling, and L. B. Milstein, “Theory of spread-spectrum communications—a tutorial,”IEEE Trans. Commun., vol. 30, no. 5, pp. 855–884, 1982.
[2] R. C. Dixon,Spread Spectrum Systems with Commercial Appli-cations, John Wiley & Sons, New York, NY, USA, 3rd edition, 1994.
[3] K. Dostert, Powerline Communications, Prentice-Hall, New York, NY, USA, 2001.
[4] N. Pavlidou, A. J. Han Vinck, J. Yazdani, and B. Honary, “Power line communications: state of the art and future trends,”IEEE Commun. Mag., vol. 41, no. 4, pp. 34–40, 2003. [5] O. Sallent, J. Perez-Romero, R. Agusti, and F. Casadevall,
“Pro-visioning multimedia wireless networks for better QoS: RRM strategies for 3G W-CDMA,”IEEE Commun. Mag., vol. 41, no. 2, pp. 100–106, 2003.
[6] G. R. Cooper and C. D. McGillem,Modern Communications and Spread Spectrum, McGraw-Hill, New York, NY, USA, 1986.
[7] R. E. Ziemer and R. L. Peterson,Digital Communications and Spread Spectrum Systems, Macmillan, New York, NY, USA, 1985.
[8] S. G. Glisic,Adaptive WCDMA Theory and Practice, John Wi-ley & Sons, New York, NY, USA, 2003.
[9] M. D. Ortigueira, J. A. B. Gerald, and J. A. L. In´acio, “Higher processing gains with DS spread spectrum,” inActas do XV Simp´osio Brasileiro de Telecomunicac¸˜oes, pp. 207–210, Recife, Brasil, September 1997.
[10] J. A. L. In´acio, J. A. B. Gerald, and M. D. Ortigueira, “New PN even balanced (PN-EB) sequences for high processing gain DS-SS systems,” inProc. 42nd Midwest Symposium on Circuits and Systems (MWSCAS ’99), vol. 2, pp. 891–895, Las Cruces, NM, USA, August 1999.
[11] J. A. L. In´acio, J. A. B. Gerald, and M. D. Ortigueira, “De-sign of new PN even balanced (PN-EB) sequences suitable for high processing gain DS-SS Systems,” inProc. 10th In-ternational Conference on Signal Processing Applications and Technology (ICSPAT ’99), Orlando, Fla, USA, November 1999.
[12] S. W. Golomb, “Structural properties of PN sequences,” in Shift Register Sequences, chapter 4, pp. 86, Aegean Park Press, Laguna Hills, Calif, USA, revised edition, 1982.
[13] R. L. Pickholtz, D. L. Schilling, and L. B. Milstein, “Theory of spread-spectrum communications—a tutorial,”IEEE Trans. Commun., vol. 30, no. 5, pp. 855–884, 1982.
[14] R. E. Ziemer and R. L. Peterson,Digital Communications and Spread Spectrum Systems, chapter 11, pp. 564, Macmillan, New York, NY, USA, 1985.
[15] K. Feher, Wireless Digital Communications-Modulation & Spread Spectrum Applications, chapter 6.4, pp. 302, Prentice-Hall, Upper Saddle River, NJ, USA, 1995.
[16] R. L. Pickholtz, D. L. Schilling, and L. B. Milstein, “Theory of spread-spectrum communications—a tutorial,”IEEE Trans. Commun., vol. 30, no. 5, pp. 855–884, 1982.
[17] R. Gold, “Optimal binary sequences for spread spectrum mul-tiplexing (Corresp.),” IEEE Trans. Inform. Theory, vol. 13, no. 4, pp. 619–621, 1967.
[18] R. C. Dixon, “Gold code sequence generators (see Appendix 7),” inSpread Spectrum Systems with Commercial Applications, chapter 3.4, pp. 87, John Wiley & Sons, New York, NY, USA, 3rd edition, 1994.
[19] D. V. Sarwate and M. B. Pursley, “Crosscorrelation properties of pseudorandom and related sequences,”Proc. IEEE, vol. 68, no. 5, pp. 593–619, 1980,Gold Sequences,chapter IV.B, pp. 605–606.
[20] J. K. Holmes,Coherent Spread Spectrum Systems, chapter 11, pp. 543–563, John Wiley & Sons, New York, NY, USA, 1982. [21] L. R. Welch, “Lower bounds on the maximum cross
correla-tion of signals (Corresp.),”IEEE Trans. Inform. Theory, vol. 20, no. 3, pp. 397–399, 1974.
[22] R. Gold, “Maximal recursive sequences with 3-valued recur-sive cross-correlation functions (Corresp.),”IEEE Trans. In-form. Theory, vol. 14, no. 1, pp. 154–156, 1968.
[23] R. Gold and E. Kopitzke, “Study of correlation properties of binary sequences,” Interim Tech. Rep. 1, vol. 1-4, Magnavox Research Laboratories, Torrance, Calif, USA, 1965.
[24] D. V. Sarwate and M. B. Pursley, “Crosscorrelation properties of pseudorandom and related sequences,”Proc. IEEE, vol. 68, no. 5, pp. 593–619, 1980, ref. [37], [39], and [129].
[25] F. A. B. Cercas,A new family of codes for simple receiver imple-mentation, Ph.D. thesis, Technical University of Lisbon, Insti-tuto Superior T´ecnico, Lisbon, Portugal, March 1996. [26] S. W. Golomb, “Maximum-length sequences,” inShift Register
[27] D. Rees, “Notes on a paper by I. J. Good,”Journal of the London Mathematical Society, vol. 21 (Part 3), pp. 169–172, 1946. [28] I. J. Good, “Normal recurring decimals,”Journal of the London
Mathematical Society, vol. 21 (Part 3), pp. 167–169, 1946. [29] J. A. L. In´acio, F. Cercas, J. A. B. Gerald, and M. D.
Or-tigueira, “Performance analysis of TCH codes and other new PN even balanced (PN-EB) codes suitable for high processing gain with DS-SS systems,” inProc. 2nd Conference on Telecom-munications (ConfTele ’99), pp. 342–346, Sesimbra, Portugal, April 1999.
[30] J. A. L. In´acio,New pseudo random codes for spread spectrum modulation, Ph.D. thesis, IST/UTL, Lisbon, Portugal, 1999. [31] D. V. Sarwate and M. B. Pursley, “Crosscorrelation properties
of pseudorandom and related sequences,”Proc. IEEE, vol. 68, no. 5, pp. 593–619, 1980.
[32] N. Zierler, “Linear recurring sequences,”Journal of the Soci-ety for Industrial and Applied Mathematics, vol. 7, pp. 31–48, 1959.
[33] M. K. Simon, J. K. Omura, R. A. Scholtz, and B. K. Levitt, Spread Spectrum Communications Handbook, McGraw-Hill, New York, NY, USA, 1994.
J. A. L. In´aciowas born in Lisbon in 1942. In 1967, he received the Bachelor degree in electrotechnics and machines from ISEL, Lisbon. In 1977, he received the Electrical Engineering (Telecomunications) degree, in 1990 the Master of Science degree, and in 2001 the Ph.D. degree in electrical engineer-ing and computers, all from Instituto Su-perior T´ecnico (IST), Universidade T´ecnica de Lisboa, Lisbon, Portugal. From 1962 to
1965, he was a Radar Engineer at the Portuguese Air Force Army. In 1966, he joined ITT, Lisbon, as a Production Engineer and in 1967 held the position of Quality Control Engineer at the same company. In 1968 he became Development Engineer with the de-velopment of Telephone 7P. In 1970, he joined Plessey (PAEP), Lis-bon, as Technical Admnistrator Engineer in the R & D Engineering Department and from 1976 to 1977, he was the Design and De-velopment Engineer Manager. From 1978 to 1981, he worked as Technical Manager and Consultant in Lisbon factories. In 1982 he began teaching science, electronics, and telecommunications engi-neering of undergraduate level. In 1985 his teaching activities in-cluded both undergraduate and graduate programs at the ENIDH till now, and in 1990 he gave lectures at IPS, Set ´ubal. Since 1988, he has been a Research Engineer at the Instituto de Engenharia de Sis-temas e Computadores-Investigac¸˜ao e Desenvolvimento (INESC-ID), Lisbon, working on sinal detection systems (radar and sonar), spread-spectrum systems, and power-line communications.
J. A. B. Geraldwas born in Lisbon in 1956. He received the Diploma degree in electri-cal engineering from the Instituto Superior T´ecnico (IST), Universidade T´ecnica de Lis-boa, Lisbon, Portugal, in 1980. In 1992 he received the Ph.D. degree from IST, with a thesis on adaptive recursive structures for data communication systems. Since 1980, he has been with IST in the Electrical En-gineering Department, where he is now
an Assistant Professor. He has been teaching both electronics and telecommunication engineering. From 1980 to 1988 he was
a Research Engineer at Centro de Electr ´onica Aplicada (CEAUTL), Universidade T´ecnica de Lisboa, Lisbon, Portugal, where he worked on digital signal processing, modems, and adaptive systems. Since 1988, he has been a Research Engineer at the Instituto de Engen-haria de Sistemas e Computadores (INESC), Lisbon, presently In-stituto de Engenharia de Sistemas e Computadores-Investigac¸˜ao e Desenvolvimento (INESC-ID), where he is working on signal pro-cessing for modems, and spread-spectrum systems. His research interests include the areas of adaptive filtering, spread-spectrum communications, and power-line communications. Recently he was also involved in a wireless visual system project for cortical neuroprodthesis.
M. D. Ortigueirawas born in Seia, Portu-gal, in 1949. He received the Electrical En-gineer (Telecomunications) degree in 1975, the Ph.D. degree in electrical engineering in 1984, and the title of “Agregado” in elec-trical engineering all from the Instituto Su-perior T´ecnico (IST), Universidade T´ecnica de Lisboa, Lisbon, Portugal. He was an As-sistant Professor of IST till 2001 when he joined the Electrical Engineering