507 | P a g e
Estimation of Saturation Flow Rate at Multi-Lane
Intersection- A Case Study of Hyderabad
Harinder D
1, K. Pandu
2, M. Kumar
31
Ph.D. Research Scholar, Civil Department, National Institute of Technology, Warangal (India)
2
Ph.D. Research Scholar, Civil Department, Osmania University, Hyderabad, (India)
3
Professor, Civil Department, Osmania University, Hyderabad, (India)
ABSTRACT
The urbanization take place faster rate in India, the control the traffic with increasing vehicles is challenging task for traffic engineering. The installation of traffic signals involves the capacity of the signalized junction. It can be estimated in two ways such as allocation of green time and the saturation flow rate. Allocation of green time estimated based on the demand, lane and phase configuration. The effective and safe movement of vehicles at signalized intersection mainly depends on the road network, capacity of intersection, proper design and operation, saturation flow rate of a signalized intersection. The saturation flow rate depends on the locality, traffic intensity and drivers characteristics. The saturation flow rate is the most important parameter to estimate the capacity of a signalized intersection. This study is focused to determine the saturation flow rate for the multi-lane intersection at L.B nagar, Uppal Ring Road, and Tarnaka. The study revealed the maximum flow rate are occurs at particular location during the green time interval per lane at Uppal Ring Roads is higher than the Tarnaka and L.B. nagar, and also concluded the effecting parameter at particular location.
Keywords: Saturation Flow Rate, Multi-Lane Intersection, Speed, Heavy Vehicle, Traffic.
I. INTRODUCTION
The provision of safe and economical transportation while reducing the travel time of the road users an important
and essential role of the traffic engineering. But the increase population and faster urbanization, the movement of
vehicles are reduced at intersection. The many of the intersection are design to poor signals (traffic allow),
insufficient green time, un-satisfied the drivers behavior, the estimated of poor saturation flow rate, traffic design
parameter are influence. The saturation flow rate is defined as the number of vehicles crossing the roads during the
green signal time. The practically not possible to measure the saturation flow rate remained the green time, because
the signal does not usually green more than one minutes. The units of saturation flow rate are vehicle per hour of
green or vehicle per hour of green per lane.
India is developing country, the urbanization are task place along with growing vehicles. The roads traffic of urban
508 | P a g e
segregation. The despite having the lane marking, and lane discipline are not followed in developing country. Tocontrol the traffic at intersection the lane discipline and the queen of the vehicles, the appropriate gap between the
vehicles, lane base traffic and the overtaking during the saturation at intersection are affect the traffic flow at the
intersection. These parameters are significantly effluence the design of signalized intersection and signal plan.
II. LITERATURE REVIEW
The many of the field study are conducted and the traffic data is analyzed, the saturations flow rate of vehicles in
urban are at various intersection are reported. Few of the study were discussed in this paper.
An attempt is made to estimate the base saturation at various intersections, and the factors affecting the saturation
flow at intersection. The study were adopted at three different intersections, the maximum saturation is noted as
2323 vh/h/la. The author concluded that the obtained traffic flow is slightly higher than the HCM manual for the city
of Doha, Qatar [1]. The study is conducted to determine the saturation flow rate under heterogeneous traffic
condition. The saturation flow rate estimated at ground scenario under the mixed traffic condition, the concluded
flow rate compared with the HCM 2010 and IRC:SP:41-1994 [2]. The capacity of signalized intersection was
estimated under two categories, the obtained saturation flow was compared with the actual saturation flow rate
equation (highway capacity manual 2000). The this study conclude that the field saturation flow rate of two
signalized intersection are 1579 and 1470 vphgpl and the operational traffic flow in between 1470 to 1774 vphgpl
[3]. The study is conducted to analyze the saturation flow rate at mixed traffic condition with traffic volume and
speed data. The study was revealed that the certain urban intersection are handling the over saturation flow rate [4].
The study is attempted to estimate the saturation flow rate of three city with the help of t-test. The measured
saturation headway of the city was compared with the HCM. The saturation headway of the city was analyzed with
an empirical-based exponential model with limiting input parameters to estimate the actual saturation flow rate [5].
The field study is performed to know the base saturation flow ate at signalized intersection, the base saturation flow
rate is suggested the 1800 per hour per lane. The study concluded that the lane width, turning radius and effective
left-turn effect on the saturation and suggested the correction factors [6]. This paper presents the parameter affecting
the saturation flow rate at three intersections, and the capacity of traffic at same location. The relations between the
parameters are presented along with discussion.
III. FACTORS AFFECTING SATURATION FLOW RATE AT INTERSECTION
During the data collection the following are the factors are observed at serious of intersection approach to study site.
The finally the data were collected at each intersection. The obtained data form the field enters in to the saturation
flow rate equation. The following are the factors affect the base saturation flow rate at intersection.
1. Right turns,
2. Number of lanes,
509 | P a g e
4. Traffic pressure,5. Heavy vehicles, and
6. Speed limit.
3.1 Data Collection
The data was collected at four intersections to estimate the base saturation flow rate. These intersections were
selected because they offered a wide range of population densities. The selection of suitable study sites was based on
consideration of a range of criteria. The criteria used include: approach configuration, area population, number of
study sites, traffic volume, and intersection geometry. The field study is conducted to estimate the saturation flow
rate at three intersections in summer season of 2013 year. They are intended to:
Ensure that the database contains intersection approaches that are typical to Hyderabad conditions and
Minimize extraneous factors that may influence saturation flow rate but which are beyond the scope of
this research (e.g., pedestrian effects)
1. Intersection 1 (L.B NAGAR)
2. Intersection 2 (NAGOLE)
3. Intersection 3 (UPPAL)
4. Intersection 4 (TARNAKA)
3.2 Approach Configuration
As the table indicates, approaches, with one, two, and three through lanes were sought during the site selection
process. In recognition of this limitation, the study of approach configuration focused on the three through lanes and
did not include the exclusive right-turn lane. In contrast, both the through and the exclusive right-turn lanes were
studied simultaneously during the study of approach configurations 3 and 4.
Table.1Range of approach configurations considered for field study.
No
Approach Configuration
Area Population (1000) Mini AADT,
veh/d/in
<5 5 to 50 50 to 200 200 to 500 >500
1 LB NAGAR NA U U U NA 4000
2 NAGOLE NA U U U NA 3200
3 UPPAL NA NA U U U 4100
510 | P a g e
IV. RESULTS AND DISCUSSION
The following equation for computing the saturation flow rate for a lane group:
Where
S = s a t u r a t i o n flow rate for the subject lane group, expressed as a total for all lanes in the lane group, veh/h;
So = base saturation flow rate per lane, pc/h/ln (i.e., passenger cars/hour/lane);
N = n u m b e r of lanes in lane group;
fw = adjustment factor for lane width;
fHV = adjustment factor for heavy vehicles in traffic stream;
fg = adjustment factor for approach grade;
fp = adjustment factors for existence of a parking lane and parking activity adjustment to lane group;
fbb = adjustment factor for blocking effect of local buses that stop within intersection area;
fa = adjustment factor for area type;
fLU = adjustment factor for lane utilization;
fLT = adjustment factor for left turns in lane group;
fRT = adjustment factor for right turns in lane group;
fLpb = pedestrian adjustment factor for left-turn movements; and
fRpb = pedestrian adjustment factor for right-turn movements.
The default base saturation flow rate offered is 1900 pc/h/ln. For each adjustment factor, the HCM provide a
table of values or an equation that can be used to determine the value of the adjustment factor.
4.1 Effect of Right-Turn Maneuver on Saturation Flow Rate
The effect of right-turn radius on saturation flow rate is reported in several research and engineering reference
documents. The general trend is one of increasing saturation flow rate with right-turn radius. This relationship is
shown in Figure 2.1 in terms of the adjustment factor for right turns ( fRT). For a 20-ft radius, values for the
adjustment factor vary from 0.70 to 0.85.for a 60-ft radius, the adjustment factors vary from 0.85 to 1.00. It
appears to underestimate the effect of radius for sharp radii and overestimate the effect for flat radii. When there are
no right turns in the shared lane, a right-turn adjustment factor of 1.0 is obtained. In contrast, when there are
100 percent right turns in the shared lane, it acts as a defector right-turn lane and an adjustment factor of 0.84 to 0.85
511 | P a g e
4.2 Relation Between Area Type and Saturation Flow Rate
This includes an adjustment factor for “area type” to account for the relative in efficiency of intersection in
business districts, relative to those in either area. It is appropriate for use at intersection in a central business
district; intersection geometry, pedestrian flow, and road side friction are more restrictive. The adjustment factor
recommended for these conditions is 0.90. The relationship between saturation flow rate and area type. The findings
from these efforts are summarized in Table 2.
Table.2 Relationship between area type and saturation flow rate
Reference Adjustment Factors Categorized By Area Type
Central Business
District
Outlying Commercial District Residential Area
HCM 0.90 1.00 1.00
Le et al. NA 1.00 1.03
Zegeer 0.99 1.00 1.01
Agent &
Crabtree
0.97 1.00 1.00
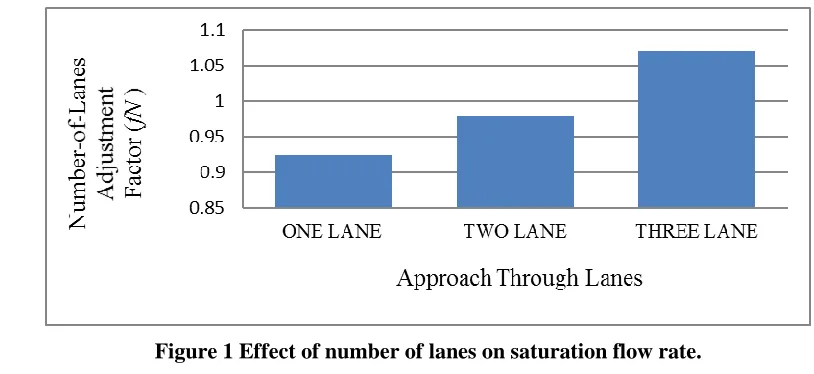
4.3 Effect Of Number of Lanes on Saturation Flow Rate
Examined the effect of number of lanes on saturation flow rate, they studied the through movements on four
approaches to each of 4 intersections. Saturation flow data were measured for each of 2901 signal cycles. They
found that the saturation flow rate of through movements on three-lane approaches was 1910 pc/h/ln. That for
two-lane approaches was 1790 pc/h/ln and that for one-through-two-lane approaches was 1670 pc/h/ln. Figure 1 illustrates
the value of the adjustment factor for number of lanes based on the saturation flow rates reported by McMahon
data. The adjustment factors shown were derived using a base saturation flow rate of 1800 pc/h/ln
512 | P a g e
4.4 Relationship Between Area Population And Saturation Flow Rate
The relationship between area population and saturation flow rate, as recommended by these researchers, is
shown in Figure.2. The shape of the trend line suggests that saturation flow rate is highly sensitive to population in
areas with population less than 100,000. For area populations above 500,000, the effect of population appears to
be negligible.
Figure.2 Relationship between area population and saturation flow rate.
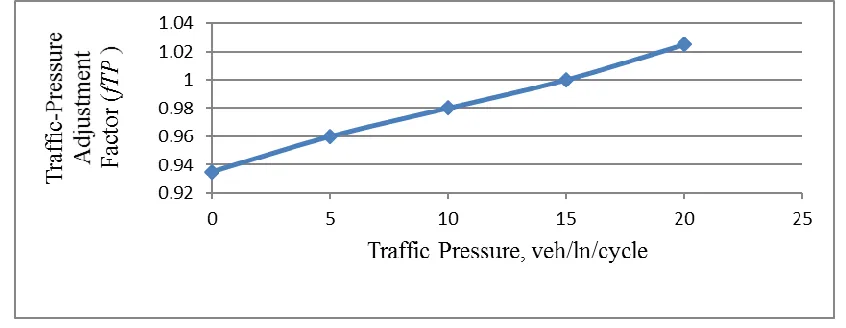
4.5 Effect of Traffic Pressure on Saturation Flow Rate
In a study of saturation flow rate at high-type intersections and interchanges, Bonneson found that the number of
vehicles in queue had an effect on saturation flow rate. In Figure 3, the trend line indicates that intersection
approaches with relatively low volume will have a low saturation flow rate and those with high volume will have a
high saturation flow rate.
513 | P a g e
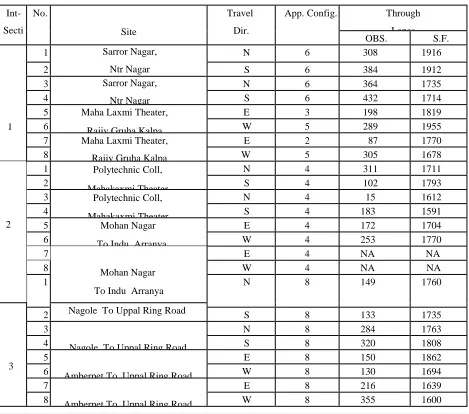
V. SUMMARY
The saturation flow rate measured at each of the 4 sites is summarized in Table 3. This rate was computed using the
discharge times of the fourth and eighth queue positions. The flow rates shown are median values (as opposed to an
average). When the data are not normally distributed, the median is influenced less by extremely small (or large) data
points than is the average value. In this instance, the median flow rates range from 2 percent lower to 6 percent higher
than the average flow rates. On average, the median flow rates are about 2 percent larger than the average rates.
The flow rates listed in Table 3 are categorized by lane use to facilitate some assessment of differences among sites
independent of the effects of right-turning vehicles. Around 7105 vehicles were observed in the through traffic
lanes, and 3055 vehicles were observed in shared through plus right-turn lanes. Only 92 vehicles were observed in
exclusive right-turn lanes.
Table. 3 Saturation flow rate of traffic categorized at intersection and lane use.
Int-Secti on No. Site Travel Dir.
App. Config. Through
Lanes
OBS. S.F.
1
1 Sarror Nagar,
Ntr Nagar
N 6 308 1916
2 S 6 384 1912
3 Sarror Nagar,
Ntr Nagar
N 6 364 1735
4 S 6 432 1714
5 Maha Laxmi Theater,
Rajiv Gruha Kalpa
E 3 198 1819
6 W 5 289 1955
7 Maha Laxmi Theater,
Rajiv Gruha Kalpa
E 2 87 1770
8 W 5 305 1678
2
1 Polytechnic Coll,
Mahakaxmi Theater
N 4 311 1711
2 S 4 102 1793
3 Polytechnic Coll,
Mahakaxmi Theater
N 4 15 1612
4 S 4 183 1591
5 Mohan Nagar
To Indu Arranya
E 4 172 1704
6 W 4 253 1770
7
Mohan Nagar
To Indu Arranya
E 4 NA NA
8 W 4 NA NA
1 N 8 149 1760
3
Nagole To Uppal Ring Road
2 S 8 133 1735
3
Nagole To Uppal Ring Road
N 8 284 1763
4 S 8 320 1808
5
Amberpet To Uppal Ring Road
E 8 150 1862
6 W 8 130 1694
7
Amberpet To Uppal Ring Road
E 8 216 1639
514 | P a g e
The Values of saturation flow rate as low as 1376 veh/h/ln, and as high as 2149 veh/h/ln were observed. The overallmedian saturation flow rate for the through traffic lanes studied is 1735 veh/h/ln.the overall median rate for the
shared through plus right-turn lanes is lower at 1591 veh/h/ln. This trend likely reflects the fact that right-turning
vehicles turn at a lower saturation flow rate.
As noted previously, the lowest saturation flow rate for a through movement was found at Nagole. This flow rate is
1376 veh/h/ln. The reason for this exceptionally low flow rate was explored by evaluating the traffic
characteristics and geometry associated with the site. The saturation flow rate data exhibited wide variability.
However, there was no apparent reason for this variability. Lacking additional information about possible unique
features of these two intersections, and given the large number of observations available for the through
movement at other sites, it was decided that the data from these two sites should not be used in the calibration of the
saturation flow adjustment factors.
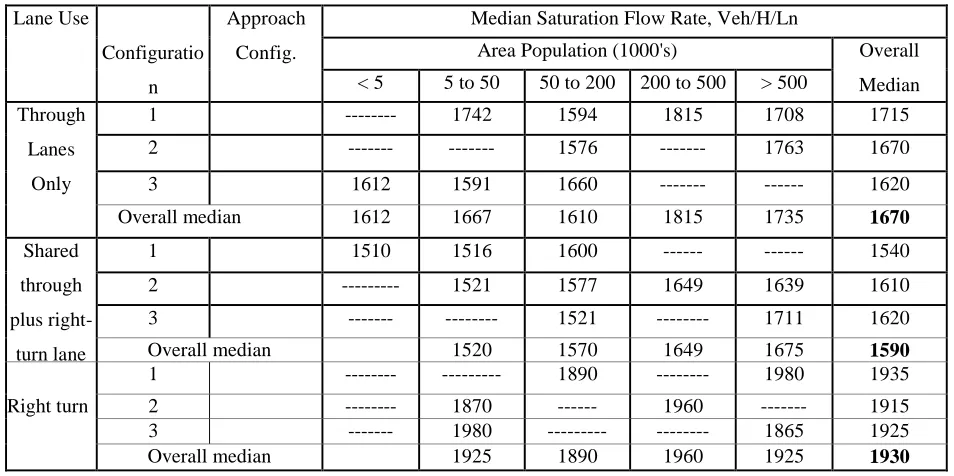
Table 4. Saturation Flow Rate Categorized at intersection by Configuration and Population.
Lane Use C
Configuratio
n
Approach
Config.
Median Saturation Flow Rate, Veh/H/Ln
Area Population (1000's) Overall
Median
< 5 5 to 50 50 to 200 200 to 500 > 500
Through
Lanes
Only
1 --- 1742 1594 1815 1708 1715
2 --- --- 1576 --- 1763 1670
3 1612 1591 1660 --- --- 1620
Overall median 1612 1667 1610 1815 1735 1670
Shared
through
plus
right-turn lane
1 1510 1516 1600 --- --- 1540
2 --- 1521 1577 1649 1639 1610
3 --- --- 1521 --- 1711 1620
Overall median 1520 1570 1649 1675 1590
1 --- --- 1890 --- 1980 1935
Right turn 2 --- 1870 --- 1960 --- 1915
3 --- 1980 --- --- 1865 1925
Overall median 1925 1890 1960 1925 1930
The distribution of median saturation flow rates by approach configuration and population is shown in Table 4.3. The
saturation flow rates in the last column of Table 4.3 that are associated with approach configurations. The weight
median flow rates for each of the three lanes use categories provide some insight as the correlation between
population and saturation flow rate.
VI. CONCLUSION
The field study is conducted to estimate the saturation flow rate at three intersections in summer season of 2013
515 | P a g e
The Saturation flow rate was found to decrease with an increase in right-turn vehicle percentage and
with an increase in heavy-vehicle percentage. A base saturation flow rate of 1950 pc/h/ln was estimated
from the data collected at numerous intersections. This rate is slightly larger than the 1900 pc/h/ln.
These physical elements include roadside development, sidewalks, on-street parking, and street segment
length. This influence of saturation flow rate at intersections on streets having a range of speed limits.
Specifically, lower saturation flow rates were found on lower-speed streets at intersection B as 1730
pc/h/ln.
Saturation flow rate was found to decrease with an increase in right-turn vehicle percentage and with an
increase in heavy-vehicle percentage and obtained the maximum saturation flow rate at intersection C as
1830 pc/h/ln.
REFERENCE
1) Hamad. Khaled ., Hassan Abuhamda., Estimating Base Saturation Flow Rate for Selected Signalized
Intersections in Doha, Qatar, Journal of Traffic and Logistics Engineering Vol. 3, No. 2, December 2015.
2) Gopalakrishnan, Ammu., Dr. Sewa Ram., Dr. Sarkar. P. K., Analysis of Estimating Saturation Flow under
Heterogeneous Traffic Condition as against Conventional Techniques, International Journal for Scientific
Research & Development| Vol. 4, Issue 09, 2016 | ISSN (online): 2321-0613.
3) Richard, mukvaya., Godfrey, Mwesige ., saturation flow rate for throught-traffic at signalized junction in
kampala, second international conference on advance in engineering and technology.
4) Sharukh, M., Dave, H, K., Analysis of Saturation Flow at Signalized Intersection in Urban Area: Surat,
International Journal of Science Technology & Engineering | Volume 2 | Issue 12 | June 2016 ISSN
(online): 2349-784X.
5) Majeed, Abdulai Abdul., Zephaniah, Samwel Oyier., Gaurav Mehta., Steven Jones Field-Based Saturation
Headway Model for Planning Level Applications, International Journal of Traffic and Transportation
Engineering 2014, 3(5): 207-215.
6) Shao, Chang-qiao., Rong, Jian., LIU, Xiao-ming., Study on the Saturation Flow Rate and Its Influence
Factors at Signalized Intersections in China, 6th International Symposium on Highway Capacity and
Quality of Service Stockholm, Sweden June 28 – July 1, 2011.