368 | P a g e
Oxide Layered Nanostructure for Sensing
Application
Jyoti Katyal
Department of Physics, Amity Institute of Applied Science,
Amity University, UP 201331, (India)
ABSTRACT
The localised surface plasmon resonance (LSPR) of metallic nanosphere coated with oxide was studied using
the finite difference time domain (FDTD) method. The refractive index sensitivity of oxide coated metallic
nanoparticle is found to be dependent on thickness of the oxide layer, therefore, the particle size is engineered
to maximize the sensitivity in the required frequency range. The rate of change in RISs factor with particle size is
also dependent on core material and thickness of shell. SPR sensors based on gold nanoparticles exhibit
considerably lower sensitivity as compared to Ag and Al based nano sensor. The order of a RIS factor for 20 nm
particle size is Ag-X>Al-X>Au-X with a value of 87.43nm/RIU>54.20 nm/RIU>43.8 nm/RIU which shows that
Au-X nanostructure shows lowest RIS value whereas, Ag-X shows highest among Au, Ag and Al based
nanostructure with the advantage of spectral peak in UV-visible region.
Keyword -Localized surface plasmon resonance (LSPR), core-shell nanostructure, Refractive index
sensitivity, FDTD simulation.
I. INTRODUCTION
In LSPR-based sensors, metallic particles are illuminated by light and localized surface plasmon is excited in the
particles [1]. Their excitation gives rise to a peak in the extinction spectra. By tracking the wavelength of
maximum absorption or extinction, changes in the local environment of the nanoparticle can be detected.
Sensitivity of the LSPR-based sensors can be defined as a ratio of the change in the wavelength of maximum
extinction peak and the refractive index change that induced the change in peak [2, 3]. Depending on the spatial
distribution of the refractive index change, sensitivity for two important limiting cases can be defined as bulk
refractive index sensitivity, which defines the sensitivity of changes in the refractive index, which occur
homogeneously in the whole medium surrounding the particle and the surface refractive index sensitivity
defined as sensitivity to refractive index changes occurring within a layer at the surface of the particle.
A local change in the environment around the nanoparticle can be created by depositing a thin layer of material
onto the nanoparticle and the surface refractive index sensitivity is expressed as , where denotes
the refractive index of thin layer. The choice of material can be dielectric forming dielectric/metal nanostructure
or metallic forming metal/metal nanostructure. Metallic nanoparticles coated with a dielectric have an advantage
over bare particles that they produce complete photonic band gaps when organized in periodic structures.
Consequently, coating with a transparent dielectric would be an enormous advantage and amorphous silica has
369 | P a g e
material and thickness of shell effect the magnitude of the shift in plasmon peak. In this paper, we studied the
effect of shell material and thickness of the shell on Au, Ag and Al coated metallic nanosphere. The three
chosen metals Al, Ag and Au constitute an excellent model system where the interband activity varies greatly
covering entire UV-NIR region of EM spectrum and shows the following characteristic features (a) for Au
interband transition exist at 2.3 eV (b) in Ag, interband transition exist close to 4eV and (c) in Al it is present
only within narrow energy range around 1.5eV. Out of these three metals, Ag and Al has much higher plasmon
quality factor as compared to Au due to which Al and Ag shows much stronger plasmon fields and extinction
spectra. We have investigated the SPR wavelength sensitivity to the surrounding medium for metal-dielectric
core shell nanostructure by calculating the refractive index sensitivity and figure of merit.
II. THEORETICAL SIMULATION
In this work, we employed FDTD software called Lumerical FDTD solution to carry out FDTD analysis of our
plasmonic nanostructure [6, 7]. We adopt a cubic Yee cell with a side equal to 1nm and a time
stept , bounded by Courant condition. For FDTD calculations involving the nanosphere of diameter D, the grid sizes in x, y and z directions are selected in such a way that the value of E-field intensities
around nanosphere becomes independent of the grid sizes. This process is carried out by initially selecting grid
sizes in x, y and z directions of the order of 1/10th of the size of nanosphere and subsequently reducing the value
of grid spacing until a further reduction in grid spacing had no influence on the calculated results around the
nanosphere. The FDTD software employed in this work allows selection of different grid sizes for the edges of
metallic nanostructures and the bulk media. In our calculations, 0.7 nm grid spacing has been chosen for spacing
around the nanosphere. The material data is obtained from Palik and Johnson & Christy for Ag and Au
nanoparticle, respectively, whereas the material data for Al is wavelength dependent. The material data is
obtained from Palik for wavelength above 200 nm and CRC model has been chosen to study the behaviour of Al
nanoparticle in the wavelength range 200 nm [6].
III. RESULT & DISCUSSION
Fig. 1 shows the size dependent absorption spectra of a coated and bare Au nanosphere. The particle size is
varied from 20 nm to 80 nm and thickness of silica shell is fixed as 1 nm. The effect of the shell layer shows a
red shift in plasmon peak for the coated nanosphere as compared to bare nanosphere. The absorption spectra of
Au-SiO2 with particle size > 50 nm having silica shell as 1 nm are quite similar to that of bare nanosphere
indicating the effect of the thin shell on LSPR is negligible for larger size particle. Usually, gold nanosphere has
a strong absorption maximum around 510 nm in air and with increasing particle size, there is red shift in LSPR
due to electromagnetic retardation in larger particles [7]. However, in many biological applications, especially in
protein, nuclei acid, etc., it is desirable to work in the DUV-UV region of the spectrum, especially 150 nm - 350
nm. Due to interband transition gold nanoparticle does not show plasmonic behaviour over this range, therefore,
alternatively one may need to tune the LSPR depending on the availability of a suitable material. Out of other
370 | P a g e
400
450
500
550
600
0.0
0.1
0.2
0.3
0.4
0.5
0.6
0.7
Q
ab
s
(a
.u
.)
Wavelength (nm)
20 nm 20 +1 nm 30 nm 30 +1 nm 40 nm 40+1 nm 50 nm 50+1 nm 60 nm 60+1 nm 70 nm 70+1 nm 80 nm 80+1 nm
Fig. 1: Size dependent absorption spectra of coated and uncoated Au nanosphere. The particle size is varied
from 20 nm to 80 nm and thickness of the shell is 1 nm.
Fig. 2 compares the shift in plasmon wavelength with the thickness of shell for Au@SiO2, Ag@SiO2 and
Al@SiO2. The magnitude of red shift from one shell thickness to the next thicker one becomes slowly smaller as
the thickness of shell is increased. The shift in LSPR peak position is larger in Al and Ag core as compared to
Au core. For 20 nm particle size Al and Ag core show shift of more than 40 nm, whereas Au shows ~ 22 nm
shift in plasmon wavelength with increasing thickness of shell which shows that the choice of core material was
sensitive in defining the LSPR shift. Al core shows plasmonic peak over DUV-UV region, whereas Ag core
shows plasmon peak over UV-visible region.
1
2
3
4
5
6
7
8
9 10
0
10
20
30
40
50
60
Thickness of Shell (nm)
S
h
if
t
in
p
la
s
m
o
n
w
a
v
e
le
n
g
th
(
n
m
)
371 | P a g e
nm, 30 nm, 40 nm and 50 nm.
IV.EFFECT OF SHELL MATERIAL
The dependence of the plasmon resonance wavelength on the surrounding medium dielectric constant gives the
basis of LSPR based sensors. Sensitivity of LSPR based sensors is defined as a ratio of change in the
wavelength of maximum extinction peak and the refractive index change that induced the change in peak
position. The surface refractive index sensitivity (RISs) is determined for Au, Ag and Al nanosphere for a
variety of size and layer thicknesses. The shell materials are chosen with increasing refractive index as 1.46
(SiO2), 1.77 (Al2O3), 2.5 and 3 so that the effect of different values of the shell refractive index on the SPR
could be analyzed. The particle size is chosen as 20 nm, 30 nm, 40 nm and 50 nm with fixed thickness of shell
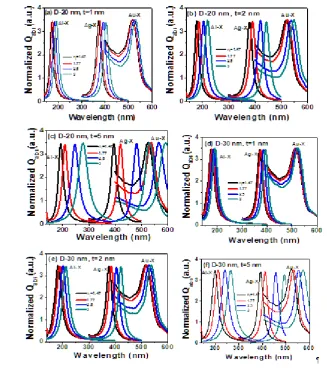
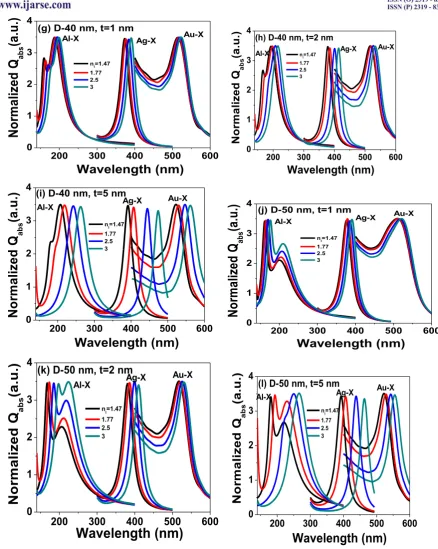
as 1 nm, 2 nm and 5 nm. Fig. 3 shows the calculated absorption spectra for a variety of particle size and layer
thicknesses. A red shift in plasmon resonance wavelength is observed with increasing the refractive index of
shell material which is expected. By tracking the change in wavelength maxima for absorption spectra these
nanostructure can be proposed for sensor application. Therefore, we have evaluated the refractive index
372 | P a g e
200 300 400 500 600
0 1 2 3 4 Au-X Ag-X
N
o
rm
al
iz
ed
Q
ab s(a
.u
.)
Wavelength (nm)
(g) D-40 nm, t=1 nm
n l=1.47 1.77 2.5 3 Al-X
200 300 400 500 600
0 1 2 3 4 Au-X Ag-X
N
o
rm
a
li
ze
d
Q
a b s(a
.u
.)
Wavelength (nm)
(h) D-40 nm, t=2 nm
nl=1.47 1.77 2.5 3 Al-X
200 300 400 500 600
0 1 2 3 4 Au-X Ag-X
N
o
rm
al
iz
ed
Q
ab s(a
.u
.)
Wavelength (nm)
(i) D-40 nm, t=5 nm
nl=1.47
1.77 2.5 3
Al-X
200 300 400 500 600
0 1 2 3 4 Au-X Ag-X
N
or
m
al
iz
ed
Q
ab s(a
.u
.)
Wavelength (nm)
(j) D-50 nm, t=1 nm
nl=1.47 1.77 2.5 3 Al-X
200
300
400
500
600
0
1
2
3
4
Au-X Ag-XN
o
rm
a
li
ze
d
Q
a b s(a
.u
.)
Wavelength (nm)
(k) D-50 nm, t=2 nm
nl=1.47 1.77 2.5 3
Al-X
200 300 400 500 600
0 1 2 3 4 Au-X Ag-X
N
o
rm
a
li
z
e
d
Q
a b s(a
.u
.)
Wavelength (nm)
(l) D-50 nm, t=5 nm
nl=1.47 1.77 2.5 3 Al-X
Fig. 3: Size dependent calculated absorption spectra of coated Au, Ag and Al nanosphere. The particle size and thickness of shell is (a) D-20 nm, t=1 nm, (b) D-20 nm, t=2 nm, (c) D-20 nm, t=5 nm, (d) D-30 nm, t=1 nm, (e) D-30 nm, t=2 nm, (f) D-30 nm, t=5 nm, (g) D-40 nm, t=1 nm, (h) D-40 nm, t=2 nm, (i) D-40 nm, t=5 nm, (j) D-50 nm, t=1 nm, (k) D-50 nm, t=2 nm and (l) D-50 nm, t=5 nm.
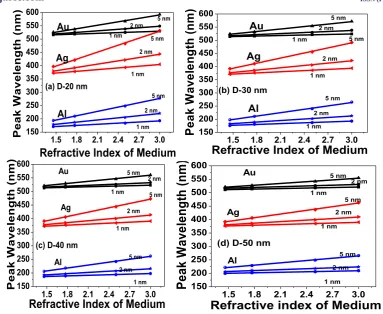
Fig. 4 shows linear shift for dipole resonance mode with particle size varying from 20 nm to 50 nm for oxide
coated Au, Ag and Al nanosphere. The calculated peak wavelength of the dipolar resonance mode with
refractive index was fitted with a linear equation and the regression analysis of yields the
373 | P a g e
1.5 1.8 2.1 2.4 2.7 3.0150 200 250 300 350 400 450 500 550 5 nm 1 nm Au Ag P e a k W a v e le n g th ( n m
Refractive Index of Medium
Al 2 nm
5 nm 2 nm 1 nm 5 nm 2 nm 1 nm
(a) D-20 nm
1.5 1.8 2.1 2.4 2.7 3.0
150 200 250 300 350 400 450 500 550
P
ea
k
W
av
el
en
g
th
(
n
m
(b) D-30 nm
Au Ag Al 2 nm 1 nm 5 nm 5 nm 2 nm 1 nm 5 nm 2 nm 1 nm
Refractive Index of Medium
1.5 1.8 2.1 2.4 2.7 3.0 150 200 250 300 350 400 450 500 550 600 P e a k W a v e le n g th ( n m )
(c) D-40 nm Au 1 nm 2 nm 5 nm 5 nm 2 nm 1 nm Ag
Al 5 nm
2 nm 1 nm
Refractive Index of Medium
1.5 1.8 2.1 2.4 2.7 3.0150 200 250 300 350 400 450 500 550 600
P
ea
k
W
av
el
en
g
th
(
n
m
)
(d) D-50 nm Au 1 nm 2 nm 5 nm 5 nm 2 nm 1 nm Ag
Al 5 nm
2 nm
1 nm
Refractive index of Medium
Fig 4: Shift in peak wavelength with refractive index of medium for coated metallic nanosphere. The
particle size is (a) 20 nm, (b) 30 nm, (c) 40 nm and (d) 50 nm.
Qualitatively, these materials follow similar trend in their behavior but the difference arises in quantitative
result. The rate of change in RISs factor with particle size is dependent on core material and thickness of shell.
SPR sensors based on gold nanoparticles exhibit considerably lower sensitivity as compared to Ag and Al based
nano sensor. With increasing particle size for thin layer, 1 nm, the sensitivity decreases from 8.94 nm/RIU to 6.2
nm/RIU with Au core material, whereas Ag and Al nanoparticle shows sharper decrease, fig. 5. With Ag as core
material the RISs factor decreases from 21.33 nm/RIU to 8.94 nm/RIU and Al shows 14 nm/RIU with 20 nm
particle size which decreases to 6.2 nm/RIU for particle size 50 nm. With slightly thicker shell the rate of
change in sensitivity is different. For 5 nm, the Au shows sensitivity of 43.28 nm/RIU which decreases to 21.89
nm/RIU with increasing particle size. As compared to Au, Ag and Al show 87.43 nm/RIU and 54.20 nm/RIU
RISs factor, respectively, for particle size 20 nm with 5 nm thickness. This factor decreases to 45.54 nm/RIU
and 28.50 nm/RIU with increasing particle size to 50 nm with same thickness for Ag and Al, respectively. It can
be seen that effect is more pronounced for Ag and Al nanoparticle as compared to Au nanoparticle which can be
explained on the basis of difference in real part of dielectric constant. For a fixed thickness of shell layer, the
RISs decreases with increasing particle size which can be explained on the basis of area around the nanosphere
over which the local change in refractive index is taking place. The thin layer thickness of 2 nm spread around
20 nm particle size will cover more area around nanosphere as compared to spread around 50 nm particle size,
therefore, larger size show less shift in plasmon peak which decreases the RISs factor. Dependence of the
surface sensitivity on particle size computed by Mie theory also shows a similar behavior [3]. For very thin
layers thickness of 2 nm, the surface refractive index sensitivity decreases with increasing particle size for
374 | P a g e
for systems including thicker over layer follows the same trend however, the initial decrease for smaller
particles is less pronounced and the sensitivity starts to grow for smaller particles and the growth with the
increasing particle size is faster.
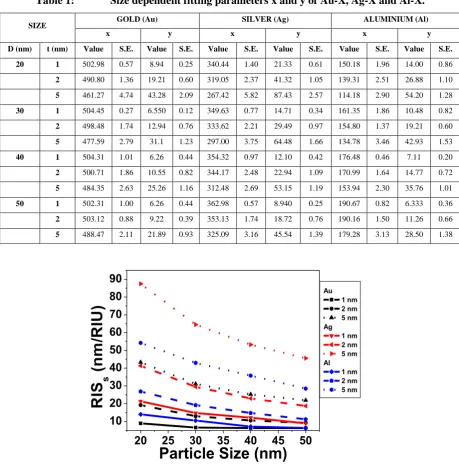
Table 1:
Size dependent fitting parameters x and y of Au-X, Ag-X and Al-X.
SIZE GOLD (Au) SILVER (Ag) ALUMINIUM (Al)
x y x y x y
D (nm) t (nm) Value S.E. Value S.E. Value S.E. Value S.E. Value S.E. Value S.E.
20 1 502.98 0.57 8.94 0.25 340.44 1.40 21.33 0.61 150.18 1.96 14.00 0.86
2 490.80 1.36 19.21 0.60 319.05 2.37 41.32 1.05 139.31 2.51 26.88 1.10
5 461.27 4.74 43.28 2.09 267.42 5.82 87.43 2.57 114.18 2.90 54.20 1.28
30 1 504.45 0.27 6.550 0.12 349.63 0.77 14.71 0.34 161.35 1.86 10.48 0.82
2 498.48 1.74 12.94 0.76 333.62 2.21 29.49 0.97 154.80 1.37 19.21 0.60
5 477.59 2.79 31.1 1.23 297.00 3.75 64.48 1.66 134.78 3.46 42.93 1.53
40 1 504.31 1.01 6.26 0.44 354.32 0.97 12.10 0.42 176.48 0.46 7.11 0.20
2 500.71 1.86 10.55 0.82 344.17 2.48 22.94 1.09 170.99 1.64 14.77 0.72
5 484.35 2.63 25.26 1.16 312.48 2.69 53.15 1.19 153.94 2.30 35.76 1.01
50 1 502.31 1.00 6.26 0.44 362.98 0.57 8.940 0.25 190.67 0.82 6.333 0.36
2 503.12 0.88 9.22 0.39 353.13 1.74 18.72 0.76 190.16 1.50 11.26 0.66
5 488.47 2.11 21.89 0.93 325.09 3.16 45.54 1.39 179.28 3.13 28.50 1.38
20
25
30
35
40
45
50
10
20
30
40
50
60
70
80
90
Au 1 nm 2 nm 5 nm Ag
1 nm 2 nm 5 nm Al
1 nm 2 nm 5 nm
R
IS
s(
n
m
/R
IU
)
Particle Size (nm)
Fig. 5: Variation in calculated RISs with particle size. The thickness of shell is 1 nm, 2 nm and 5 nm.
In order to check the overall performance of LSPR-based nanosensor, FOM is also calculated. The FOM
depends on the imaginary part of the permittivity of the metal and the use of a metal with smaller loss will lead
to sensors with potentially better performance. Fig. 6 clearly shows that the performance of LSPR based sensor
employing spherical nanoparticles can vary substantially depending on material and size of the nanoparticle.
Our calculations show that the FOM of plasmonic nanosensor for surface refractive index sensitivity depends on
the thickness of the overlayer within which the refractive index change occurs. The value of FOM increases
with increasing thickness of over layer. As a comparison, Ag and Al nanoparticle shows maximum FOM value
375 | P a g e
coated nanosphere has only one surface plasmon resonance peak ranging from the ultraviolet to the near infraredregion depending on the size, shape and surrounding dielectric constant of the nanoparticles.
20
25
30
35
40
45
50
0.0
0.5
1.0
1.5
2.0
2.5
3.0
3.5
4.0
4.5
F
O
M
Particle Size (nm)
Au 1 nm 2 nm 5 nm Ag
1 nm 2 nm 5 nm Al
1 nm 2 nm 5 nm
Fig. 6: Variation in calculated FOM with particle size. The thickness of shell is 1 nm, 2 nm and 5 nm.
V. CONCLUSION
The RIS and FOM of metallic nanosphere coated with oxide have been calculated using the finite difference
time domain (FDTD) method. The peak position and intensity of the resonance modes are effectively controlled
by the thickness of oxide layer and core material. The RIS factor increases on increasing the thickness of oxide
layer. The order of a RIS factor of 20 nm particle size is Ag-X>Al-X>Au-X with a value of
87.43nm/RIU>54.20 nm/RIU>43.8 nm/RIU which shows that Au-X nanostructure shows lowest RIS value
whereas, Ag-X shows highest among Au, Ag and Al based nanostructure with the advantage of spectral peak in
UV-visible region. Apart from RIS factor, FOM of plasmonic nanosensor also shows dependence on the
thickness of the overlayer within which the refractive index change occurs. The value of FOM increases with
increasing thickness of over layer. As a comparison, Ag and Al nanoparticle shows maximum FOM value as
compared to Au irrespective of particle size making them demanding material for UV plasmonic.
REFERENCES
1. .F. Bohren, D.R. Huffman, Absorption and scattering of light by small particles (Wiley, New York).
2. M Kathryn, M. Mayer, H Jason H and Hafner, Localized Surface Plasmon Resonance Sensors, Chem.
Rev.,111(6), 2011, 3828–3857
3. P. Kvasnička and J. Homola, Optical sensors based on spectroscopy of localized surface plasmons on
metallic nanoparticles: Sensitivity considerations, Biointerphases, 3 (3), 2008, 211-234.
4. S. Singh, P. Devi, D. Singh, D. V. S. Jain & M. L. Singla, Sensing behavior of silica-coated Au nanoparticles
towards nitrobenzene, Gold Bull, 45, 2012, 75–81.
5. A. Taflove, S.C. Hagness, Computational electrodynamics: The Finite-Difference Time-Domain method (
376 | P a g e
6. Lumerical solutions, http://docs.lumerical.com/en/fdtd/reference guide.html.
7. J.F. Li, Y.F. Huang, Y. Ding, Z.L. Yang, S.B. Li, X.S. Zhou, F.R. Fan, W. Zhang, Z.Y. Zhou, D.Y. Wu, B.
Ren, Z.L. Wang and Z.Q. Tian, Shelled-isolated nanoparticle-enhanced Raman spectroscopy, Nature,
464(7287), 2010, 392-5.
8. Y.W. Ma, J. Zhang, L.H. Zhang, G.S. Jian and S.F. Wu, Theoretical analysis the optical properties of
multi-coupled silver nanoshell particles, Plasmonics, 6, 2011, 705-713.
9. M. Mitsushio, K. Watanabe, Y. Abeb and M. Higo, Sensor properties and surface characterization of
aluminum-deposited SPR optical fibers, Sensors and Actuators A,163, 2010, 1-8.
10.J. Hu, L. Chen , Z. Lian, M. Cao, H. Li, W. Sun, N. Tong and H. Zeng Deep-Ultraviolet Blue-Light Surface
Plasmon resonance of Al and Al-core/Al2O3 shell in spherical and cylindrical nanostructures, J. Phys. Chem.
C, 116(29), 2012, 15584-90.
11.A. Dhawan, S.J. Norton, M.D. Gerhold and T. Vo-Dinh, Comparison of FDTD numerical computations and
analytical multipole expansion method for plasmonics-active nanosphere dimers, Optics Express, 17(12),