OPTIMISATION OF PROCESS
PARAMETERS IN RAPID PROTOTYPING
FOR ABS MATERIAL
A. Sirisha Badrakali
1, S.D.V.V.S.B.Reddy
2, S.K.Rajesh Reddy
31,2,3
Assistant Professor, Aditya Engineering College , Surampalem (India)
ABSTRACT
Rapid Prototyping (RP) is finding applications in diverse fields in the industry today, with prototypes used for form,
fit and function. Design Engineers around the world use Rapid Prototyping to pre-estimate product characteristics
like shape, manufacturability and finish. Due to the excellent advantages of rp, it is fast catching the fancy of large
number of people. One of the famous RP techniques is Fused Deposition Modeling. Quality characteristics of rapid
prototyping (RP) parts largely depend on process parameters. A functional part must possess different quality
characteristics. Therefore, process parameters need to be determined in such a way that they collectively optimize
more than one response simultaneously. To address this issue, effect of important process parameters viz., layer
thickness, air gap and raster angle have been studied. The quality characteristics are surface finish, dimensional
accuracy, density and hardness. Thaguchi’s designs of experiments were used and the results are statistically
analyzed.
Keywords : Rapid Prototyping , FDM, ANOVA, etc
I
INTRODUCTION
Wang Rong-Ji, Li Xin-hua, Wu Qing-ding, Wang Lingling has done the work on Optimizing process parameters for selective laser sintering based on neural network and genetic algorithm. AsifEqubal, Anoop Kumar Sood, S.S. Mahapatra made a work named Prediction of dimensional accuracy in fused deposition modeling: a fuzzy logic approach.S.S. Mahapatra, Anoop Kumar Sood1, S.K. Patel and S.Sahu conducted Optimization of Process Parameters in Fused deposition modeling using Weighted Principal Component Analysis. Therefore in this work, the FDM Process parameters like layer thickness, raster angle and air gap for their influence on physical properties like surface finish, dimensional accuracy, density, hardness are considered. These process parameters are optimized and the effects of each parameter on quality characteristic are investigated using statistical techniques. Thus the contribution to this extent will definitely help in improving the quality of prototypes in FDM process as well as simplifying the contribution to this extent will definitely help in improving the quality of prototypes in the contribution to this extent will definitely help in improving the quality of prototypes in the contribution to this extent will definitely help in improving the quality of prototypes in FDM process as well as simplifying the process parameters for desired quality standards.
1.1 Process Parameters in FDM process
When preparing to build FDM parts, many fabrication parameters are needed in the software. To achieve optimum quality, these parameters are set differently according to requirements of applications. Therefore, the first step in the experiment was to identify the process control parameters that are likely to affect the quality of FDM parts. The selected parameters are listed below.
Layer thickness:
Slice height is the thickness of each layer measured in the vertical or Z direction. Varying the slice height would most likely have the same effect as varying the bead width of the ABS plastic.
Raster angle:
It is the angle between the two consecutive layers. Air Gap:
It is the space between the beads of FDM material.
1.2 Thaguchi Method:
Thaguchi design of experiments was used in this work in order to evaluate the relative contribution of process parameter on various characteristics like Dimensional accuracy, Surface quality, Density and Hardness.
Experimental Procedure:
Fig 1: Test Specimen
Thaguchi method uses a special set of arrays called orthogonal arrays.
These standard arrays stipulate the way of conducting the minimum number of experiments, which would give the full information of all factors that affect the performance parameters. The selected process parameters affecting the quality of FDM parts and their levels are mentioned in the table 1:L8 Orthogonal array was used and it is shown in table 2.
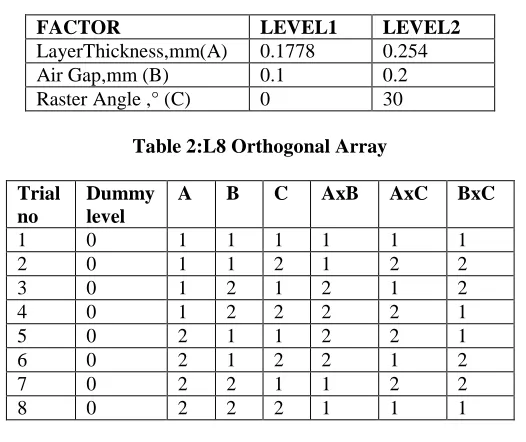
Table 1: List of process parameters considered and their Levels
FACTOR LEVEL1 LEVEL2
LayerThickness,mm(A) 0.1778 0.254
Air Gap,mm (B) 0.1 0.2
Raster Angle ,° (C) 0 30
Table 2:L8 Orthogonal Array
Trial no
Dummy level
A B C AxB AxC BxC
1 0 1 1 1 1 1 1
2 0 1 1 2 1 2 2
3 0 1 2 1 2 1 2
4 0 1 2 2 2 2 1
5 0 2 1 1 2 2 1
6 0 2 1 2 2 1 2
7 0 2 2 1 1 2 2
8 0 2 2 2 1 1 1
Dimensions are as follows. (mm)
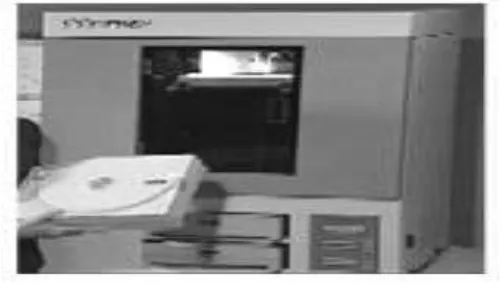
A. FDM Prodigy Plus:
Prodigy Plus builds parts, including internal features, directly from CAD.stl files. The system builds three dimensional parts by extruding a bead of ABS plastic through a computer-controlled extrusion head, producing high quality parts that are ready to use immediately after completion. With three layer resolution settings, it can be choose to build a part quickly for design verification, or finer settings for higher quality surface detail also can be choose. The Prodigy Plus system consists of two main components - the machine itself and insight, the preprocessing software that runs on a Windows NT, Windows 2000, or Windows XP platform. Prodigy Plus's build envelope measures 203 × 203 × 305mm (8 × 8 × 12 in). Each material cartridge contains 922 cc (56.3cu.in.) of usable material - enough to build continuously for about four days without reloading. Fig. 4 (a) shows the Prodigy Plus machine.
Fig 2: FDM Prodigy plus Machine
B. Part accuracy:
Minimum deviation between fabricated part dimension and CAD model dimension was selected as one of the part accuracy criteria. To measure the deviation each dimension is studied separately. For finding the deviation each and every dimension of the fabricated part is measured using micrometer. The least count of micrometer is 0.01 and 0.001mm respectively.
C. Surface Quality:
Roughness values on the surface of the samples were obtained using surf test, a contact type of measuring instrument and the Ra values are noted. Each measurement is taken a length of over 4 mm.
D. Density:
Density of every model is calculated using weight and volume measurement. E. Hardness:
II RESULTS AND DISCUSSION
The study involved 8 samples produced by FDM prodigy plus machine. 2.1 Signal to Noise Ratio:
The signal to noise ratio measures the sensitivity of the quality characteristic being investigated to those uncontrollable external factors. To minimize the problem, the governing.
Relationships for the S/N ratio in terms of the experimentally measured values of Ra, i.e., yi calculated as follows: S/N ratio = – 10 log 10 MSD
Where MSD = (yi– ˆy) 2/n, ˆy the target value that is to be achieved, the number of samples. The S/N ratio values obtained for the trials are listed in following table.
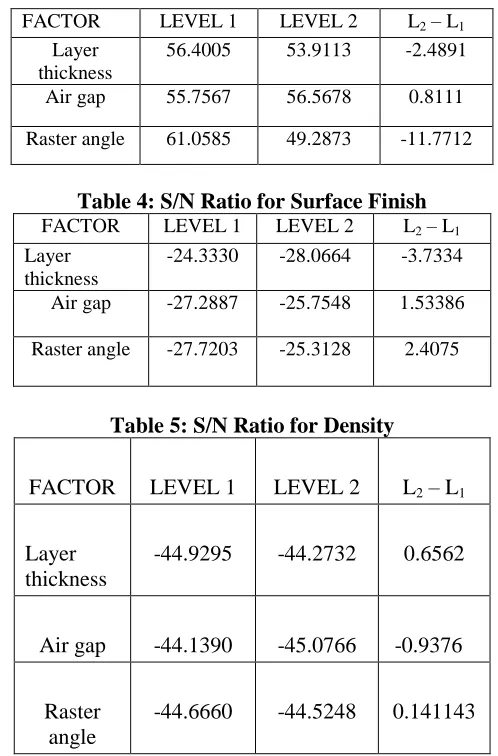
Table 3: S/N Ratio for Dimensional Accuracy
FACTOR LEVEL 1 LEVEL 2 L2 – L1 Layer
thickness
56.4005 53.9113 -2.4891
Air gap 55.7567 56.5678 0.8111
Raster angle 61.0585 49.2873 -11.7712
Table 4: S/N Ratio for Surface Finish
FACTOR LEVEL 1 LEVEL 2 L2 – L1 Layerthickness
-24.3330 -28.0664 -3.7334 Air gap -27.2887 -25.7548 1.53386 Raster angle -27.7203 -25.3128 2.4075
Table 5: S/N Ratio for Density
FACTOR
LEVEL 1
LEVEL 2
L
2– L
1Layer
thickness
-44.9295
-44.2732
0.6562
Air gap
-44.1390
-45.0766
-0.9376
Raster
angle
Table 6: S/N Ratio for Hardness
FACTOR
LEVEL 1
LEVEL 2
L
2– L
1Layer thickness
44.5624
44.9576
0.3952
Air gap
46.0908
42.8456
-3.2451
Raster angle
45.0177
44.5957
-0.5219
2.2 ANOVA
ANOVA analysis provides significance rating of the various factors analyzed in this study. Based on the above rating, factors, which influence the objective function significantly, could be identified and proper control measures adopted. In a similar way, those factors with minimum influence could be suitably modified to suit economic considerations. A variable possessing the maximum value of variance is said to have the most significant effect on the process under consideration.
Table 7: ANOVA for Dimensional Accuracy
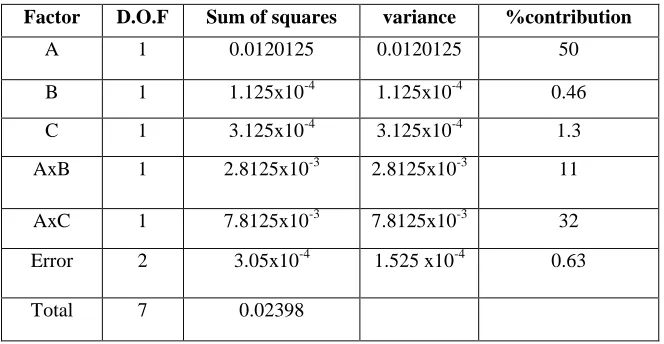
Table 8: ANOVA for Surface finish
Factor D.O.F Sum of squares variance %contribution
A 1 0.0120125 0.0120125 50
B 1 1.125x10⁻⁴ 1.125x10⁻⁴ 0.46
C 1 3.125x10⁻⁴ 3.125x10⁻⁴ 1.3
AxB 1 2.8125x10⁻³ 2.8125x10⁻³ 11
AxC 1 7.8125x10⁻³ 7.8125x10⁻³ 32
Error 2 3.05x10⁻⁴ 1.525 x10⁻⁴ 0.63
Total 7 0.02398
Factor D.O.F Sum of squares variance %contributio n
A 1 280.726 280.726 33
B 1 12.375 12.375 4.1
C 1 129.52 129.52 15
AxB 1 134.72 134.72 16
AxC 1 265.53 265.53 31
Error 2 1.4202 0.7101 0.0836
Table 9: ANOVA for Density
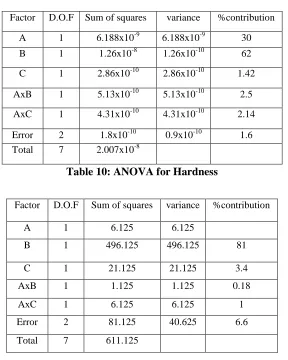
Table 10: ANOVA for Hardness
2.3 F Statistic:This is calculated as the ratio of observed sample variances. It is particularly helpful in comparison of variances.
Mathematically,
F calculated = Mean SStreatment/Mean SSerror
If F calculated ≥ F (α, k-1, N-k) then accept the hypothesis that treatment effects are significant, i.e., some of the treatments may be different from rest. On the other hand, if
F calculated ≤ F (α, k-1, N-k)
Then there is not enough evidence in the observed data to reject the hypothesis that all treatments are equal. Factor D.O.F Sum of squares variance %contribution
A 1 6.188x10⁻⁹ 6.188x10⁻⁹ 30
B 1 1.26x10⁻⁸ 1.26x10⁻¹⁰ 62
C 1 2.86x10⁻¹⁰ 2.86x10⁻¹⁰ 1.42
AxB 1 5.13x10⁻¹⁰ 5.13x10⁻¹⁰ 2.5
AxC 1 4.31x10⁻¹⁰ 4.31x10⁻¹⁰ 2.14
Error 2 1.8x10⁻¹⁰ 0.9x10⁻¹⁰ 1.6
Total 7 2.007x10⁻⁸
Factor D.O.F Sum of squares variance %contribution
A 1 6.125 6.125
B 1 496.125 496.125 81
C 1 21.125 21.125 3.4
AxB 1 1.125 1.125 0.18
AxC 1 6.125 6.125 1
Error 2 81.125 40.625 6.6
Table 11: F static for dimensional accuracy
Factor F statistic F (0.05,1,7) F(0.01,1,7)
A 78.7 5.59 12.25
B 0.737 5.59 12.25
C 2.049 5.59 12.25
AxB 1.8442 5.59 12.25
AxC 5.1229 5.59 12.25
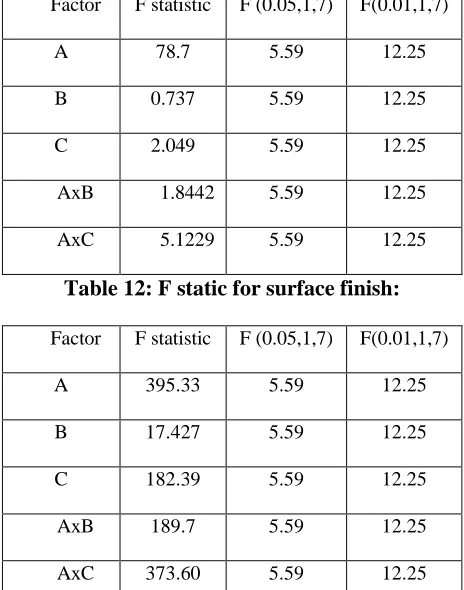
Table 12: F static for surface finish:
Factor F statistic F (0.05,1,7) F(0.01,1,7)
A 395.33 5.59 12.25
B 17.427 5.59 12.25
C 182.39 5.59 12.25
AxB 189.7 5.59 12.25
AxC 373.60 5.59 12.25
Table 13: F static for density
Factor F statistic F (0.05,1,7) F(0.01,1,7)
A 34.377 5.59 12.25
B 70 5.59 12.25
C 0.158 5.59 12.25
AxB 0.285 5.59 12.25
Table 14: F static for hardness
Factor F statistic F (0.05,1,7) F(0.01,1,7)
A 0.15 5.59 12.25
B 12.26 5.59 12.25
C 0.52 5.59 12.25
AxB 0.02 5.59 12.25
16 17 18 19 20 21
0.1 0.2
su
r
fa
c
e
f
in
is
h
air gap
0 5 10 15 20 25
1 2
surf
a
ce
fini
sh
layer thickness and air gap
III CONCLUSIONS
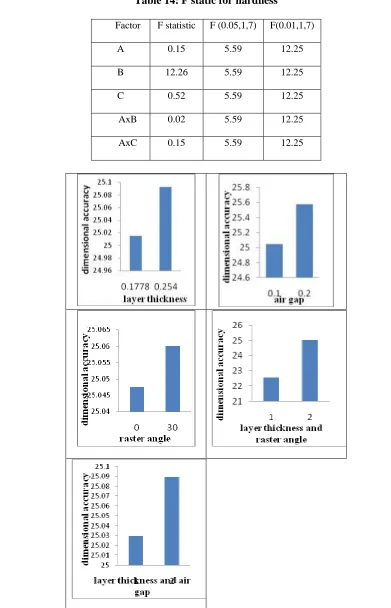
3.1. Dimensional accuracyANOVA:
Layer thickness effects dimensional accuracy greatly.. Air gap has little effect Raster angle also has little effect coming to interactions layer thickness and raster angle effects dimensional accuracy greatly than that of layer thickness and air gap
0 10 20 30 40 50 60 0.1 0.2 h a r d n e ss n o air gap 41.5 42 42.5 43 1 2 h a r d n e ss n o
layer thickness …
Fig 4.Hardness Vs parameters S/N Ratio:
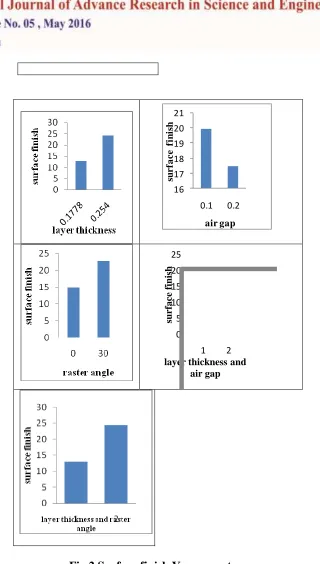
3.2. Surface Quality ANOVA:
Layer thickness effects greatly. Air gap has little effect. Raster angle’s effect should be considered. Coming to interactions, layer thickness and raster angle combination effects greatly compared to that of layer thickness and air gap.
S/N Ratio
. Lesser the thickness of layer more will be the surface quality.. More air gap leads to good surface finish. More raster angle leads to good surface finish.
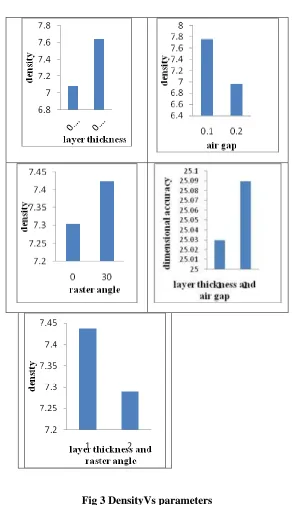
3.3. Density
ANOVA:
Layer thickness has little effect. Air gap effect is more. Raster angle’s effect is very less. Coming to interactions, layer thickness and raster angle, layer thickness and air gap is negligible.
S/N Ratio
More the thickness of layer more will be the density. Less air gap leads to more density more raster angle leads to more density.
3.4. Hardness
ANOVA:
Layer thickness has least effect. Air gap effect is more Raster angle’s effect is less. Coming to interactions, layer thickness and raster angle, layer thickness and air gap effects are negligible.
S/N Ratio
More the thickness of layer more will be the hardness Less Air gap leads to more hardness less raster angle leads to more hardness.
Finally,
A1B1C2 has more dimensional accuracy. A1B1C1 has good surface quality. A2B1C2 has more density. A2B1C2 has more hardness
IV FUTURE SCOPE OF WORK
REFERENCES
[1].Miltiadis A. Boboulos: CAD-CAM & Rapid prototyping Application Evaluation
[2] Chee Kai Chua, Kah Fai Leong, Chu Sing Lim Rapid Prototyping: Principles and Applications [3] PhadkeMadhav S: Quality Engineering Using Robust Design
[4] www.prototyezone.com Rapid prototype basics get the basics on prototype and rapid prototyping
[5] L. Novakova-Marcincinova and J. Novak-Marcincin: Testing of Materials for Rapid Prototyping Fused Deposition Modeling Technology, World Academy of Science, Engineering and Technology 70 2012
[6] Adrian KAMPA: Impact of rapid prototyping techniques for the manufacturing of new product, selected engineering problems Number 31, Institute of Engineering processes, automation and integrated manufacturing systems
[7] S. K. Singhal1, A. P. Pandey1, P. M. Pandey2 and A. K. Nagpal, Optimum Part Deposition Orientation in Stereo lithography: Computer-Aided Design & Applications, Vol. 2, Nos. 1-4, 2005, pp 319-328