Global Thresholding Techniques to Classify Dead Cells in
Diffusion Weighted Magnetic Resonant Images
Ravi S
1, A. M. Khan
2 1Research Student, Department of Electronics, Mangalore University, Karnataka (India)
2Professor, Department of Electronics, Mangalore University, Karnataka (India)
ABSTRACT
Stroke is one of the leading medical conditions that cause more number of death rates across the globe. Identifying the stroke in early stages leads to control of major damage on the body. Doctors rely on sophisticated imaging tools to diagnose abnormalities. Segmentation is part of such tools that helps to identify the abnormal region. Thresholding is the simplest segmentation operation that can be performed to classify pixels of an image into two classes as foreground and background. Threshold operation can be global, local or adaptive in nature. This paper aims at demonstrating few global thresholding techniques to segment the image. The pixel grouping discussed in this paper aims at classifying the regions in a diffusion weighted sequence of a magnetic resonance imaging as dead cell or normal cells. This is important to diagnose stroke regions in the image. We suggest a new threshold value to segment dead cells in stroke images. A performance comparison of the global threshold techniques like Otsu’s threshold, mean threshold, histogram based threshold and the suggested threshold value is done. The results obtained shows that the suggested threshold value performs better than other techniques mentioned and is more accurate in representing the dead cells in the diffusion weighted image. The test images are obtained from the hospital and are real. The Matlab framework is chosen for the study.
Keywords:
DWI sequence, Global Threshold, MRI, Segmentation, Strokes, Thresholding.
I.
INTRODUCTION:
Image processing is one of the significant area that is widely used for improving the visual quality and to enhance
the data present in the image. There are several image processing techniques to serve these purposes. Among the
various image processing methods, image segmentation crucial step in many applications such as medical diagnosis,
image retrieval, traffic control, remote sensing, forensics, surveillance and so on [1] . In medical applications,
identifying the abnormal tissues non-invasively for accurate diagnosis, using image processing techniques is the
trend [2]. Image segmentation operations helps doctors for prognosis, operation plan, diagnosis, treatment plan,
post-operation studies etc. Among the various segmentation techniques, thresholding the image is the simplest one
and computationally inexpensive [3]. This method of segmentation, groups the pixels of an image into two groups as
pixel as the threshold values. The thresholding operation can be either global to the image or local to the regions
within an image or can be adaptive in nature for different types of objects in the same image. Global thresholding
techniques are simple to implement and fast in response. But they also have drawback of low segmentation
efficiency compared to adaptive thresholding techniques [5]. If the image posses clear intensity distinctions between
the objects then global thresholding operation gives good results but if the image posses slight intensity variations
between the objects then the classification is challenging and the success entirely depends on the threshold value
chosen.
In the work presented in this paper a case study of the global thresholding techniques like mean thresholding, Otsu‟s
thresholding, histogram based thresholding is done. The obtained results are also present in brief in the section
below. The paper also suggests a new threshold value that suits for the diffusion weighted sequence of magnetic
resonance imaging to identify the strokes. It is observable from the results that the suggested threshold performs
better than the above mentioned thresholding techniques.
II.
MATERIALS AND METHODS:
Stroke is one of the top three medical conditions that causes more number of deaths across the world [6]. Stroke is
basically a cerebro-vascular disease that results due to lack of supply of blood to the cells [7]. The stroke is usually
identified through the magnetic resonance imaging (MRI) scan. A special sequence called diffusion weighted
imaging sequence (DWI) is preferred by the doctors to identify the affected regions. The hyper-intense regions in
the DWI sequence correspond to the stroke affected region. The abnormal regions are to be segmented accurately to
understand the stroke.
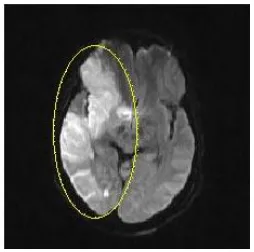
Fig. 1: A sample Diffusion Weighted Image (DWI)
Thresholding is one of the ways to categorize pixels of an image into group of objects or background. Image
thresholding is done by understanding the intensity distribution among image pixels. A distinct intensity value, T, is
chosen to act as a testing parameter for thresholding operation. The thresholding operation simply performs the
relational operation on the pixel values; if the test pixel posses an intensity value greater than the specified threshold
value then it is grouped to represent the object else it represents background. Thresholding operation is effectively
--- (1)
Where T is the selected threshold value, f (x, y) test image and g (x, y) is the resultant threshold image. If the
threshold „T‟ selected for the operation is kept constant for the entire image then the operation is said to be global thresholding [4]. If the value of „T‟ is selected such that it changes with the objects in the image then the threshold
operation is said to be local thresholding. The global threshold techniques take considerably less time for computing
the threshold image [8]. The following sections discuss few global threshold techniques.
A. Mean Threshold
Mean thresholding technique is one of the simplest ways to threshold an image. The average value of background
and foreground (object) are found and then the mean value corresponding to these intensity distribution values is
chosen as threshold. For an image of 8-bit length the intensity distribution is between [0 255]. The mean value that
corresponds to this range lies around the value that corresponds to neutral grey which should be selected as the new
threshold value. This value is kept constant for the entire image to perform the operation. The mean threshold
operation is governed by the equation (1) given above, where the „T‟ value is replaced by the pixel value of 128.
The result obtained by applying the mean threshold on the test images are given and discussed in the following
section. It can be seen that the resultant images obtained by this threshold value is not suitable for brain MR images.
B. Otsu’s Threshold
Thresholding operation though is simple to apply the result is highly sensitive for the threshold value chosen. The
segmented output is useful only if the resultant image clearly distinguishes the object and the boundary values.
Instead of choosing the threshold values based on mean intensity values it is wise choice to select threshold value
based on regional statistical measures like median, variance and so on. This method of choosing threshold value
based on variance was proposed by Otsu [9]. This is one of the widely used thresholding technique to segment the
image and extract objects. Otsu‟s technique is based on minimizing the within-class variance equivalently
maximizing inter-class variance. The algorithm to find threshold value based on Otsu‟s methods is given below [9]:
1. Histogram of the image is computed and probability of each intensity values should be recorded.
2. Initial values for class variance and class means should be set.
3. For all possible threshold values the class variance and class means are updated.
4. Between-class variance (inter-class variance) is computed. The value that corresponds to the maximum
corresponds to the Otsu‟s threshold.
From the studies done, we have observed that the Otsu thresholding technique fails to extract abnormal regions in
DWI sequence of brain MRI. The results are provided in the following section.
C. Histogram Based Threshold
Histogram based threshold values gives a better performance to segment the image. The threshold value based on
method is user-driven and requires interference to decide a good threshold mostly on trial and error basis. The
histogram based threshold detection is suitable for images which has clear distinction between object and
background [11]. The histogram based threshold detection is governed by the relation
--- (2)
Where is within-class variance
is probability of group of values less than threshold
is probability of group of values less than threshold
is variance of group of values less than or equal to threshold
is variance of group of values greater than threshold
The threshold detection based on histogram can be made automatic. The histogram based threshold detection is done
as follows: Histogram corresponding to the original image is plotted. The image pixels are classified into three
groups, based on the valley points. The first valley point towards lower intensity corresponds to the differentiation of
black background and the second valley point towards the higher intensity corresponds to the differentiation of
pixels with gray tone and white. Thus choosing the second valley point as a threshold value, results in extraction of
only abnormal regions in brain images.
D. Proposed Threshold
Though the histogram based threshold selection provides good results it is still not suitable to extract only the
abnormal regions in the test images. This is mainly because the threshold selected is based on the histogram plot of
the entire image. In many cases, the intensity reflections outside the abnormal regions are also seen in the final
segmented image. To avoid such unwanted regions, we have restricted the threshold selection to abnormal regions.
A thorough study on the histogram of the abnormal regions were made and it is found that the threshold value that
corresponds to around 68% of the maximum intensity of the image results in more accurate thresholding of the
abnormal regions. This is in case of diffusion weighted sequence of the MR images of brain. This is due to the fact
that the gray levels that correspond to dead cells within the abnormal region are unique to other intensity levels in
the brain. When the histogram is considered for the entire image the threshold value is shift to the left slightly if
compared with the threshold value of abnormal region only. The effect of such shift is observable in the results
given below. The shift in threshold has included the skull part and other unwanted areas with similar intensity level.
III. RESULTS
The techniques discussed are practically tested on set of test images using MatLab2013a software on Intel(R)
Pentium(R)4 CPU 2.80GHz 1Gb 32-bit OS system. The test images were selected from the database obtained from
the abnormal regions. The pixels corresponding to the abnormal regions are counted to understand the efficiency of
the threshold value. The obtained results are shown below in figure 2 and tabulated as shown in table 1.
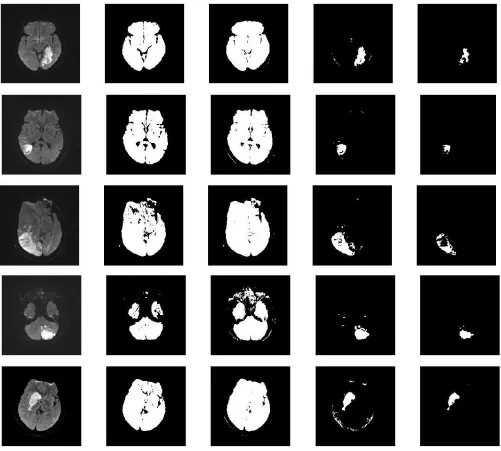
Figure. 2 Results obtained:(a)Original Image (b) Otsu’s threshold (c) Mean threshold (d)
Table 1. Number of identified abnormal pixels using the techniques discussed
Sl. No Image
Number of Pixels
Mean Threshold Otsu‟s Method Histogram Method Proposed Threshold
1 A3-2 7123 3502 1271 526
2 A5-3 9579 9017 775 401
3 B1-3 10918 10275 477 226
4 C1-5 11230 10208 1626 699
5 D1-3 8916 6991 1139 614
6 G1-3 6770 4538 791 457
7 P10-3 9923 9461 1069 495
8 R7-2 9629 8918 372 141
9 S1-3 10469 8562 1192 577
10 S8-3 9610 8706 660 360
Plot 1. Number of identified abnormal pixels using the techniques discussed
IV. DISCUSSION
The table 1 gives the results obtained for threshold operation of various images that corresponds to DWI sequences
of MRI. The brighter area corresponds to the stroke affected area in brain. The test images are subjected to
segmentation process using thresholding techniques. The techniques chosen for the study are the Otsu‟s threshold
value and a new threshold value, around 68% of the maximum intensity value. The value is suggested by the careful
study of the threshold values observed by plotting the histogram of only the region of interest.
The results obtained by the above said threshold operations are given in figure 2 above. It can be seen from the
figure that the resultant images corresponding to global threshold and the Otsu‟s thresholding technique fails to
segment the abnormal region and produces a noisy image as segmented output. It can also be observed from the
figure that the output of the histogram based method and the suggested value are comparable. The table 1 given
above corresponds to the comparison of number of pixels obtained as abnormal when subjected to threshold
operation. It can be seen from the entries in the table that the suggested threshold for the DWI sequences gives
minimum number of pixels. The results obtained from this value confines the pixels to the abnormal region without
any additional process. The suggested value is thus most suited for the threshold operation to classify the pixels of
image as dead cells. Further the resultant image can be spatially correlated to identify spatial locations accurately in
the image. The entries of the table are plotted and are given in plot 1.
V.
CONCLUSION
This paper suggests a new threshold value for the diffusion weighted imaging sequence of MRI. The study done
shows that the conventional Otsu‟s technique to find threshold fails to classify the cells for the proper diagnosis. For
mean thresholding technique, the value is chosen to be the midpoint of the intensity scale, which again fails to
restrict the segmentation to abnormal region within the brain. Another technique considered is the histogram based
selection of threshold value. Though the technique performs better than the Otsu‟s technique and global static
threshold techniques, it identifies the regions outside the abnormal locations which is undesirable. The suggested
threshold value is empirical in nature and was arrived at after thorough study of histogram corresponding to region
of interest in stroke images. As it can be seen from the above results the suggested threshold value performs well by
highlighting only the abnormal regions. We conclude that the suggested threshold value of around 68% of the
maximum intensity of DWI sequence is suitable to extract dead cells and helps doctors to diagnose the abnormality
more accurately.
REFERENCES
[1.] Anjna and Rajandeep Kaur, Review of Image Segmentation Techniques, International Journal of Advanced
Research in Computer Science (Special Issue), Volume 8, No. 4, 2017, 36-39.
[2.] Pham, D. L., Xu, C., & Prince, J. L., Current Methods In Medical Image Segmentation, Annual Review of
Biomedical Engineering, 2000, 315-337.
[3.] Nagabhushana, S., Computer Vision and Image Processing (New-AgeInternational Pvt. Ltd , 2005)
[5.] Ashuthosh Kumar Chaubey, Comparison of The Local and Global Thresholding Methods in Image
Segmentation, World Journal of Research and Review, Volume-2, Issue-1,201, 01-04.
[6.] WHO fact sheet, “Top 10 causes of death”; http://www.who.int/mediacentre/factsheets/fs310/en/
[7.] Sandeep Bhuta, “Diffusion Weighted MRI in Acute Stroke”;
http://radiopaedia.org/articles/diffusion-weighted-mri-in-acute-stroke-1.
[8.] Imocha Singh, Tejmani Sinam, James and Romen Singh, Local Contrast and Mean based Thresholding
Technique in Image Binarization, International Journal of Computer Applications, Volume 51– No.6, 2012.
[9.] Otsu, N. A threshold selection method from gray-level histograms. IEEE Transactions on Systems, Man, and
Cybernetics, Volume 9 – No 1 1979, 62–66.
[10.] Raju, P. D. R., & Neelima, G. Image Segmentation by using Histogram Thresholding, International Journal of
Computer Science and Engineering Technology, Volume 2 - Issue1, 2012, 776–779.
[11.] Al-amri, S. S., Kalyankar, N. V, & Khamitkar, S. D. Image Segmentation by Using Thershod Techniques.