c
Owned by the authors, published by EDP Sciences, 2015
Strain-rate sensitivity of foam materials: A numerical study using
3D image-based finite element model
Yongle Sun1, Q.M. Li1,a, and P.J. Withers2
1School of Mechanical, Aerospace and Civil Engineering, The University of Manchester, Sackville Street, Manchester
M13 9PL, UK
2Henry Moseley X-ray Imaging Facility, School of Materials, The University of Manchester, Grosvenor Street,
Manchester M13 9PL, UK
Abstract. Realistic simulations are increasingly demanded to clarify the dynamic behaviour of foam materials, because, on one hand, the significant variability (e.g. 20% scatter band) of foam properties and the lack of reliable dynamic test methods for foams bring particular difficulty to accurately evaluate the strain-rate sensitivity in experiments; while on the other hand numerical models based on idealised cell structures (e.g. Kelvin and Voronoi) may not be sufficiently representative to capture the actual structural effect. To overcome these limitations, the strain-rate sensitivity of the compressive and tensile properties of closed-cell aluminium Alporas foam is investigated in this study by means of meso-scale realistic finite element (FE) simulations. The FE modelling method based on X-ray computed tomography (CT) image is introduced first, as well as its applications to foam materials. Then the compression and tension of Alporas foam at a wide variety of applied nominal strain-rates are simulated using FE model constructed from the actual cell geometry obtained from the CT image. The stain-rate sensitivity of compressive strength (collapse stress) and tensile strength (0.2% offset yield point) are evaluated when considering different cell-wall material properties. The numerical results show that the rate dependence of cell-wall material is the main cause of the strain-rate hardening of the compressive and tensile strengths at low and intermediate strain-rates. When the strain-rate is sufficiently high, shock compression is initiated, which significantly enhances the stress at the loading end and has complicated effect on the stress at the supporting end. The plastic tensile wave effect is evident at high strain-rates, but shock tension cannot develop in Alporas foam due to the softening associated with single fracture process zone occurring in tensile response. In all cases the micro inertia of individual cell walls subjected to localised deformation is found to have negligible effect on the macro strain-rate sensitivity of Alporas foam.
1. Introduction
Aluminium foams possess unique properties, which are attractive for various engineering applications such as energy absorption and sandwich construction. Their compressive properties are of particular importance when they are used to absorb energy and attenuate impact/blast loads. The understanding of their tensile strength is also important for the design of load-bearing structures (e.g. sandwich structures). Under dynamic loading, their cell deformation may be distinct from the one under quasi-static loading, contributing to macroscopic strain-rate effect. Strain-rate effect on the mechanical behaviour of cellular solids is one of the major concerns for their applications associated with dynamic loads, which has been studied extensively in recent years. However, the actual causes of strain-rate effect have not been completely recognised.
Despite the lack of a general conclusion on the rate sensitivity of aluminium foams, the strain-rate hardening of compressive strength of closed-cell aluminium Alporas foam has been widely observed [1–6]. Meanwhile, a number of explanations have been proposed.
aCorresponding author:[email protected]
For instance, Paul and Ramamurty [3] suggested that the strain-rate hardening is related to both the strain-rate sensitivity of the aluminium matrix and the micro inertia of the individual cell walls. Cady et al. [5] argued that many factors, e.g. the cell-wall interaction, pore architecture and the rate dependence of the cell-wall material, are involved. Dannemann and Lankford [2] attributed the strain-rate effect to the flow of gas through ruptured cell walls. On the other hand, Elnasri et al. [7] examined the structural response during high speed impact and proposed that the strong strain-rate hardening is mainly a shock wave related phenomenon.
From these previous studies, the rate dependence of cell-wall material, the micro inertia, the shock wave, and the trapped gas are identified as the most likely causes responsible for the macro strain-rate effect. However, the individual contributions of these factors cannot be easily distinguished in experiments. Therefore, theoretical and numerical analyses are needed, which usually use simplified or idealised cell structures, e.g. cubic cell and Voronoi structure, but they may not be able to sufficiently capture the actual structural effect of foam materials, since some factors such as cell-wall rate dependence and micro inertia depend on the actual structural characteristics [8]. This motivates the geometrically
realistic simulations based on cell structures obtained from computed tomography (CT) images (so-called image-based modelling [9]), which has been employed to investigate the strain-rate sensitivity of open-cell foams [10,11] and the quasi-static compressive behaviour of closed-cell foams [12,13]. The dynamic behaviour of Alporas foam has yet to be examined in this way.
The objective of this work is to investigate the strain-rate sensitivity of closed-cell aluminium foam (Alporas) and the associated mechanisms. 3D finite element (FE) model is developed using the actual cell structure obtained from CT image. Then compression and tension are simulated at the applied nominal strain-rates ranging from 1×10⁻³s−1 to 3×10³s−1. The numerical prediction of
the strain-rate sensitivity of the compressive strength is also compared with test data reported in the literature.
2. Image-based 3D FE model
2.1. Geometrical characterisation and meshing
A cylindrical Alporas foam sample with dimensions of Ø15.0×14.4 mm was scanned using a Nikon Metris CT system housed in a customised bay at the Henry Moseley X-ray Imaging Facility (HMXIF, Manchester, UK). The accelerating voltage and current of the X-rays were set as 75 kV and 125µA, respectively. The effective voxel size was 10.9µm and the reconstruction of the X-ray radiographs (2000 projections) was accomplished using Nikon Metris CT-Pro software. To eliminate the surface damage incurred by machining during sample preparation, the central portion of the foam sample with dimensions of Ø11.0×13.5 mm was selected as the region of interest (ROI). Greyscale-based segmentation was used to extract the solid phase in ROI. The tiny pores having diameters smaller than 400µm are neglected, which greatly simplifies the meshing and reduces element number. In addition, the cell walls were slightly dilated (by 44µm in this case) to facilitate image down-sampling (i.e. increasing voxel size) without losing thin walls. The down-sampled CT image has a voxel size of 50.0µm. The number of voxels is significantly reduced by the down-sampling, such that the number of elements in the mesh can be greatly reduced.
Figure 1 shows the transverse CT slices at the mid-height of the virtual foam sample after reconstruction and image processing, which manifests the extremely complex cell morphology and topology. In Fig. 1b the colours indicate the local thickness of cell walls measured in 3D [14]. The cell structure constructed here maximally preserves the actual cell morphology and topology, although some fine features (e.g. extremely tiny pores and thin walls) are neglected to restrict complexity.
Table1lists the statistic data of the cell size and local cell-wall thickness, for which the maximum value is about one order larger than the minimum value. The high scatter in cell size and cell-wall thickness is also clearly seen in Fig.1. The thickness of the walls at the junctions is much larger than that at other locations, and many small cells are located in the thick walls.
The FE discretisation of the foam sample was carried out by using ScanIP (Simpleware Ltd, UK), which is a
Figure 1. (a) Transverse slice CT image of the scanned foam (Ø15.0×14.4 mm, voxel size is 10.9µm); (b) corresponding slice CT image of the ROI (Ø11.0×13.5 mm, voxel size is 50.0µm) after the image processing with the local cell-wall thickness (measured in 3D) represented as a colour-scale.
Figure 2. 3D FE mesh (493150 quadratic tetrahedral elements and 957697 nodes) of the foam sample created from the CT image and enlarged view of the surface cells to show the mesh density and quality.
Table 1. Geometrical data of the foam sample (unit: mm).
Mean±SD Max. Min. Cell size 2.01±1.25 5.01 0.43 Cell-wall thickness 0.28±0.30 0.81 0.10
commercial software for directly converting CT images into high quality 3D meshes [15]. The 3D profile of the foam sample after meshing is shown in Fig.3. Quadratic elements were used for meshing since they have high numerical precision which is necessary to capture the bending and buckling of thin walls which are unlikely to be very finely meshed due to the geometrical complexity and the limited mesh density that can be adopted. The relative density (RD, i.e. the ratio of the cell wall volume to the foam volume) of the meshed sample is 0.109, around 11% larger than that of the scanned sample. This mainly results from errors introduced by the image processing and meshing steps. A similar volume increase of closed-cell foam model also occurred when other image processing and meshing techniques were used (e.g. around 21% volume increase occurring in the model by Jeon et al. [12]).
2.2. FE model setup
to describe the strain hardening of the yield stress, and von Mises plasticity was used. The elastic modulus, yield strength and hardening exponent are 68 GPa, 35.5 MPa and 8.5, respectively [16]. The rate dependence of the yield stress was determined by the Cowper-Symonds equation with parameters of ˙ε∗=6500 s−1 and m=4 [11] for
typical aluminium. The case where the cell-wall material is rate-independent was also considered for comparison. The loading processes were treated as dynamic in order to incorporate inertia effects at various strain-rates, and the cell-wall density was taken to be 2710 kg/m3.
The foam sample was loaded on the top surface by applying a constant velocity to the associated nodes, while for the bottom surface the displacement was fixed in the vertical direction. In-plane motion was allowed on the end surfaces and no constraints were exerted on the lateral sides of the sample. The nominal strain ε and stress σ were defined as the displacement divided by the original height and the end-surface reaction force divided by the original cross-sectional area, respectively. The nominal strain-rate ˙εwas defined as the ratio of the loading speed to the original height and varied from 1×10⁻³s−1 to
3×10³s−1in the simulations. To compare with previous
experimental results [1–4], the compressive strength was defined as the first peak stress (i.e. collapse stress), while the 0.2% offset yield point was used to characterise tensile strength.
The general purpose FE code, Abaqus, was employed to perform the simulations considering large deformation effect. The Abaqus/Implicit solver capable of highly accurate stress solutions was adopted for the dynamic simulations so as to take account of inertia effect.
3. Results and discussion
3.1. Stress-strain relationship
The high strain-rate can lead to force imbalance between the two end surfaces. For instance, at a strain-rate of 3× 10³s−1, as shown in Fig.3, the stress at the loading end is
significantly larger than that at the supporting end for both compression and tension, whether the cell-wall material is rate-dependent or not. This phenomenon is known as shock enhancement for cellular solids subjected to compression [7]. For tension, the inertial force associated with the propagation of plastic stress wave also produces higher stress level at the loading end. However, it is not a shock phenomenon since the tangential modulus of the tensile stress-strain curve decreases continuously with the strain, and eventually, the deformation is dominated by the softening mechanism due to the formation of single fracture process zone [17]. The shock phenomenon in dynamic compression is caused by the localised dynamic densification of the collapsed cells leading to the overall increase of compressive stress and shock discontinuity [18]. Another observation from Fig. 3 is that both the loading and supporting stresses for the foam with rate-dependent cell walls are larger than those for the foam with rate-independent cell walls.
To exclude the inertial force occurring at the loading end (i.e. behind shock or plastic wave front), the stress measured at the supporting end is used to characterise
0.00 0.02 0.04 0.06 0.08 0.10 0.12 0.14 0
3 6 9 12 15 18
No
m
inal st
res
s
(MP
a)
Nominal strain
Supporting end, rate-dependent cell walls Loading end, rate-dependent cell walls Supporting end, rate-indenpendent cell walls Loading end, rate-indenpendent cell walls (a)
0.00 0.02 0.04 0.06 0.08 0.10 0.12 0.14 0
3 6 9 12 15 18
Supporting end, rate-dependent cell walls Loading end, rate-dependent cell walls Supporting end, rate-indenpendent cell walls Loading end, rate-indenpendent cell walls
Nomina
l st
re
s
s
(
M
Pa)
Nominal strain
(b)
Figure 3. Stress-strain curves at a strain-rate of 3×10³s−1: (a)
compression; (b) tension.
the foam strength at high strain-rates. Nevertheless, it should be noted that at low and intermediate strain-rates (1×10⁻³−1×10²s−1), the loading and supporting
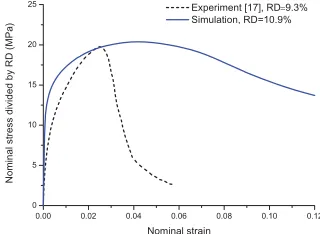
forces (and stresses) are equal. This balancing of forces at the macro-scale, however, can co-exist with the micro inertia of individual cell walls. The micro inertia arises from the nonuniform deformation of the heterogeneous cell structure and was often surmised to affect the macro strength. Figure 4 shows the compressive stress-strain curves at different strain-rates, which are typical foam responses under uniaxial compression [2,3,19,20], i.e. an essentially linear relationship at low stress before attaining a peak stress after which the stress drops to a plateau due to cell crushing. The quasi-static compressive strengths at a strain-rate of 1×10⁻³s−1obtained for foams with cell-wall materials being rate-dependent and rate-independent are 1.61 MPa and 1.57 MPa, respectively, which lie within the scatter band of the compressive strength (1.3– 2.3 MPa) reported for Alporas foam of similar density [21,22]. Figure 5 shows the tensile stress-strain curves, which capture the stress-strain trend observed in tension experiments [17]. However, as cell-wall cracking is not considered in the present FE model, the peak stress and the stresses afterward, which are controlled by single fracture process zone [17], are expected to be overestimated in the tension simulations, as shown in Fig.6. Nevertheless, the fracture area is small when strain is smaller than 0.01, and local plastic deformation dominates at small strain [17]. Thus the 0.2% offset yield point (see Fig.5) is acceptable to evaluate the tensile strength using present FE model. For compression, the plastic buckling of cell walls controls the cell collapse and thus fracture effect is secondary to determine the collapse stress.
0.00 0.02 0.04 0.06 0.08 0.10 0.12 0.14 0.0 0.5 1.0 1.5 2.0 2.5 3.0
Strain-rate = 1×10⁻³ s-1
Strain-rate = 1×100
s-1
Strain-rate = 1×10²
s-1
Strain-rate = 1×10³
s-1
Strain-rate = 3×10³
s-1 No m ina l st re s s (MPa) Nominal strain (a)
0.00 0.02 0.04 0.06 0.08 0.10 0.12 0.14 0.0 0.5 1.0 1.5 2.0 2.5 3.0 Nomi nal stres s (MPa) Nominal strain 1×10⁻³ s-1 1×10² s-1
1×10³ s-1 3×10³ s-1 1×100 s-1 (b)
Figure 4. Compressive stress-strain curves measured at the supporting end at different strain-rates with the yield stress of the cell-wall material being rate-independent (a) and rate-dependent (b). Note that the stress-strain curves are identical at the strain-rates of 1×10⁻³−1×10²s−1in (a).
5a), indicating the negligible influence of micro inertia for Alporas foam in this strain-rate range. By contrast, differences arise at strain-rates above 1×10³s−1 due to
the inertia effect. For instance at a strain-rate of 3× 10³s−1, the elastic precursor wave does not arrive at the supporting end until the nominal strain reaches a critical value, after which the stress becomes non-zero and increases rapidly as a result of the transmission of load through the deforming cell walls. The result is different if the cell-wall material is taken to be rate-dependent. In this case, the foam strength generally increases with strain-rate (Figs.4b and5b), but the increase of collapse stress becomes subtle from 1×10³s−1to 3×10³s−1for
compression and the 0.2% offset yield point decreases for tension. This is because when shock compression or plastic tensile wave is initiated at high strain-rates, the deformation is concentrated at the loading end and the cells near the support end are much less deformed.
3.2. Strain-rate sensitivities of the compressive and tensile strengths
To identify the strain-rate effect, the foam strength measured at the supporting end is normalised by that at a strain-rate of 1×10⁻³s−1 (regarded as quasi-static).
The normalised strength is plotted against strain-rate in Fig. 6, alongside compression test data from the literature. Reasonable agreement is achieved between the compression simulations (for rate-dependent cell walls) and experimental tests although the experimental strain-rate sensitivity appears higher. Furthermore, the foam has slightly higher strain-rate sensitivity than the base material itself (Cowper-Symonds curve in Fig. 7) until the shock compression or plastic tensile wave occurs. When the
0.00 0.02 0.04 0.06 0.08 0.10 0.12 0.14 0 1 2 3 4 5 No mi na l st re ss (MPa) Nominal strain Strain-rate = 1×10⁻³
s-1 Strain-rate = 1×100
s-1 Strain-rate = 1×10²
s-1 Strain-rate = 1×10³ s-1 Strain-rate = 3×10³
s-1
(a)
0.2% offset yield point
0.00 0.02 0.04 0.06 0.08 0.10 0.12 0.14 0 1 2 3 4 5 1×100 s-1 3×10³ s-1
1×10³ s-1
1×10² s-1 No m in a l s tr e s s ( M P a ) Nominal strain 1×10⁻³ s-1 (b)
0.2% offset yield point
Figure 5. Tensile stress-strain curves measured at the supporting end at different strain-rates with the yield stress of the cell-wall material being rate-independent (a) and rate-dependent (b). Note that the stress-strain curves are identical at the strain-rates of 1×10⁻³−1×10²s−1in (a).
0.00 0.02 0.04 0.06 0.08 0.10 0.12
0 5 10 15 20 25 Nomi n al st ress divi ded
by RD (MPa)
Nominal strain
Experiment [17], RD=9.3% Simulation, RD=10.9%
Figure 6. Comparison of the quasi-static tensile stress-strain curves obtained from experiments and simulations. The stress is normalised to eliminate the density effect (the tensile stress is approximately proportional to relative density [23]).
cell-wall material is rate-independent, the foam strength is insensitive to strain-rate although a drop in strength occurs at high strain-rates.
10-3
10-2
10-1
100
101
102
103
1.0 1.2 1.4 1.6 1.8 2.0
No
rmal
is
ed
c
o
mp
re
ss
iv
e
str
e
n
g
th
Strain-rate (s-1)
Cell-wall material (Cowper-Symonds equation) FEM (rate-indepedent cell walls) FEM (rate-dependent cell walls) Mukai et al., 1999 Paul & Ramamurty, 2000 Ramachandra et al., 2003
(a)
10-3 10-2 10-1 100 101 102 103
0.2 0.4 0.6 0.8 1.0 1.2 1.4 1.6 1.8 2.0
Cell-wall material (Cowper-Symonds equation) FEM (rate-independent cell walls) FEM (rate-dependent cell walls)
Strain-rate (s-1)
No
rmalised t
ensile
st
rengt
h
(b)
Figure 7. Predicted strain-rate sensitivity of the compressive (a) and tensile (b) strengths of Alporas foam for rate dependent and independent material models alongside available compression test data [1,3,4]. The dashed curve corresponds to the rate dependence of the cell-wall material. The dynamic strength is normalised by the quasi-static one at a strain-rate of 1×10⁻³s−1.
the foam strength measured at the supporting end is complicated. When the cell-wall material properties are rate-independent, it leads to a discernible reduction in compressive collapse stress and a significant drop of 0.2% offset yield point for tension. The cause of this effect is the concentrated large cell deformation at the loading end and the constrained small deformation at the supporting end, which arise from the inertia-controlled load transmission in the cell structure. This effect competes with the hardening effect of the rate dependence of cell-wall material when both are operative, which complicates the observed strain-rate sensitivity of foam strength.
It is evident from Fig.7that it is the rate dependence of cell-wall material that dominates the strain-rate effect of the foam strength. Furthermore, the foam strength can exhibit slightly higher strain-rate sensitivity than that of the cell-wall material at low and intermediate strain-rates (e.g. <1000 s−1). This is because the local strain-rate can be higher than the nominal one. When the related cell walls act as the critical load-bearing elements, more significant strain-rate hardening of foam strengths will be observed. In addition, it is found that the compressive strain-rate sensitivity is underestimated by the FE model, which is mainly due to the assumption of the rate dependence of the cell walls described by the Cowper-Symonds equation with typical parameters for aluminium. The cell-wall material may exhibit higher rate dependence than that assumed in the simulations, since the components and microstructure of the cell-wall material (with aluminium matrix) of Alporas foams is complicated due to the
foaming process during which additional elements are introduced and special processing is applied [24].
Although the effect of internal gas is neglected in the present FE model, it has been confirmed that the trapped gas hardly affects the foam strength of aluminium foams according to the previous analytical estimate [25] and numerical simulation [26]. However, the gas effect could be significant at the compression densification stage [26] or when the initial gas pressure is much higher than atmosphere pressure [27].
4. Conclusions
Three-dimensional geometrically realistic FE model based on CT image has been developed to investigate the strain-rate effect on the dynamic properties of closed-cell aluminium foam (Alporas). Uniaxial compression and tension have been simulated at different nominal strain-rates (1×10⁻³−3×10³s−1). The simulations show that
the rate dependence of the cell-wall material dominates the macro strain-rate effect on the foam strengths measured at the supporting end, whereas micro inertia has negligible contribution for Alporas foam. At sufficiently high strain-rates, shock compression and plastic tensile wave occur, which lead to higher stresses measured at the loading end but has a complex effect on the stress at the supporting end, depending on the strain-rate sensitivity of the cell-wall material. In general, the cell deformation close to the supporting end is restrained at high strain-rates, thereby limiting the stress level and the strain-rate sensitivity there. The numerical results also demonstrate that foams can be more strain-rate sensitive than their cell-wall materials.
References
[1] T. Mukai, H. Kanahashi, T. Miyoshi, M. Mabuchi, T. Nieh, K. Higashi, Scripta Mater. 40, 921–928 (1999).
[2] K.A. Dannemann, J. Lankford Jr, Mat. Sci. Eng. A 293, 157–164 (2000).
[3] A. Paul, U. Ramamurty, Mat. Sci. Eng. A 281, 1–7 (2000).
[4] S. Ramachandra, P. Sudheer Kumar, U. Ramamurty, Scripta Mater. 49, 741–745 (2003).
[5] C.M. Cady, G.T. Gray Iii, C. Liu, M.L. Lovato, T. Mukai, Mat. Sci. Eng. A 525, 1–6 (2009).
[6] T. Mukai, T. Miyoshi, S. Nakano, H. Somekawa, K. Higashi, Scripta Mater. 54, 533–537 (2006).
[7] I. Elnasri, S. Pattofatto, H. Zhao, H. Tsitsiris, F. Hild, Y. Girard, J. Mech. Phys. Solids 55, 2652–2671 (2007).
[8] C.R. Calladine, R.W. English, Int. J. Mech. Sci. 26, 689–701 (1984).
[9] E. Maire, P.J. Withers, Int. Mater. Rev. 59, 1–43 (2014).
[10] A.D. Brydon, S.G. Bardenhagen, E.A. Miller, G.T. Seidler, J. Mech. Phys. Solids. 53, 2638–2660 (2005). [11] M. Vesenjak, C. Veyhl, T. Fiedler, Mat. Sci. Eng. A
541, 105–109 (2012).
[13] C. Veyhl, I.V. Belova, G.E. Murch, T. Fiedler, Mat. Sci. Eng. A 528, 4550–4555 (2011).
[14] T. Hildebrand, P. R¨uegsegger, J. Microsc. 185, 67–75 (1997).
[15] P.G. Young, T.B.H. Beresford-West, S.R.L. Coward, B. Notarberardino, B. Walker, A. Abdul-Aziz, Philos. T. Roy. Soc. A 366, 3155–3173 (2008).
[16] I. Jeon, K. Katou, T. Sonoda, T. Asahina, K.-J. Kang, Mech. Mater. 41, 60–73 (2009).
[17] C. Motz, R. Pippan, Acta Mater. 49, 2463–2470 (2001).
[18] L. Wang, Foundations of stress waves (Elsevier Science Ltd, Amsterdam, 2007).
[19] I. Jeon, T. Asahina, Acta Mater. 53, (2005) 3415– 3423.
[20] J. Shen, G. Lu, D. Ruan, Compos. Part. B-eng. 41, 678–685 (2010).
[21] U. Ramamurty, A. Paul, Acta Mater. 52, 869–876 (2004).
[22] M.F. Ashby, A.G. Evans, N.A. Fleck, L.J. Gibson, J.W. Hutchinson, H.N.G. Wadley, Metal foams: a design guide (Elsevier, 2000).
[23] L.J. Gibson, M.F. Ashby, Cellular solids: structure and properties, 2 ed. (Cambridge University Press, 1997).
[24] A.E. Simone, L.J. Gibson, Acta Mater. 46, 3109– 3123 (1998).
[25] Y.D. Liu, J.L. Yu, Z.J. Zheng, J.R. Li, Int. J. Solids. Struct. 46, 3988–3998 (2009).
[26] Q. Fang, J. Zhang, Y. Zhang, Z. Gong, H. Wu, Int. J. Impact. Eng., doi: 10.1016/j.ijimpeng.2014.10.009, (2014).


![Figure 7. Predicted strain-rate sensitivity of the compressive (a)and tensile (b) strengths of Alporas foam for rate dependent andindependent material models alongside available compressiontest data [1,3,4]](https://thumb-us.123doks.com/thumbv2/123dok_us/8176826.1365625/5.595.91.251.73.325/predicted-sensitivity-compressive-strengths-andindependent-alongside-available-compressiontest.webp)
