Research
Abstract
Objective To compare the characteristics and responses of patients completing a patient experience survey accessed online after e-mail notification or delivered in the waiting room using tablet computers.
Design Cross-sectional comparison of 2 methods of delivering a patient experience survey.
Setting A large family health team in Toronto, Ont.
Participants Family practice patients aged 18 or older who completed an e-mail survey between January and June 2014 (N = 587) or who completed the survey in the waiting room
in July and August 2014 (N = 592).
Main outcome measures Comparison of respondent
demographic characteristics and responses to questions related to access and patient-centredness.
Results Patients responding to the e-mail survey were more likely to live in higher-income neighbourhoods (P = .0002), be between the ages of 35 and 64 (P = .0147), and be female (P = .0434) compared with those responding to the waiting room survey; there were no significant differences related to self-rated health. The differences in neighbourhood income were noted despite minimal differences between patients with and without e-mail addresses included in their medical records. There were few differences in responses to the survey questions between the 2 survey methods and any differences were explained by the underlying differences in patient demographic characteristics.
Conclusion Our findings suggest that respondent demographic characteristics might differ depending on the method of survey delivery, and these differences might affect survey responses. Methods of delivering patient experience surveys that require electronic literacy might underrepresent patients living in low-income neighbourhoods. Practices should consider evaluating for nonresponse bias and adjusting for patient demographic characteristics when interpreting survey results. Further research is needed to understand how primary care practices can optimize electronic survey delivery methods to survey a representative sample of patients.
Measuring the patient experience in primary care
Comparing e-mail and waiting room survey delivery in a family health team
Morgan Slater
MSc PhDTara Kiran
MD CCFP MScWeb exclusive
Editor’s KEy Points
• Measuring the patient experience is an integral step toward understanding and improving the quality of primary care. As part of quality improvement efforts, family practices are increasingly being asked to survey patients about experiences with care.
• It is important for primary care practices to recognize that the method of survey delivery can influence which patients respond, which might in turn affect responses. Low-cost alternatives to collecting patient experience data, such as electronic surveys sent through e-mail, might underrepresent patients who live in low-income neighbourhoods. This study compared results and patient characteristics for respondents to surveys delivered by e-mail and in the waiting room.
• Responses were similar between the surveys except that patients who responded to the e-mail survey were less likely to report being able to see a provider on the same or next day (53.3% vs 60.2%, P = .0265) and more likely to report that their health care providers always or often spent enough time with them (89.2% vs 85.1%, P = .0457). These differences were explained by the underlying differences in patient demographic characteristics. Practices should consider evaluating their patient experience survey results for nonresponse bias and adjusting for patient characteristics when interpreting survey results.
This article has been peer reviewed.
Résumé
Objectif Comparer les caractéristiques et les réponses des patients qui répondaient à un sondage sur leur expérience des soins, accédé en ligne après un avis par courriel ou distribué dans la salle d’attente sur tablette informatique.
Conception Une comparaison transversale de 2 méthodes de distribution d’un sondage sur l’expérience des patients.
Contexte Une grande équipe de santé familiale à Toronto, en Ontario.
Participants Des patients de la clinique familiale âgés de 18 ans ou plus qui ont répondu à un sondage par courriel entre janvier et juin 2014 (N = 587) ou qui ont complété le sondage dans la salle d’attente en juillet et août 2014 (N = 592).
Principaux paramètres à l’étude Une comparaison des caractéristiques démographiques et des réponses des répondants aux questions concernant l’accès aux soins et les soins axés sur le patient.
Résultats Les patients qui ont répondu au sondage par courriel étaient plus susceptibles de vivre dans des quartiers à revenu plus élevé (P = ,0002), d’être âgés de 35 à 64 ans (P = ,0147) et d’être des femmes (P = ,0434) que ceux qui ont répondu dans la salle d’attente; il n’y avait pas de différences significatives sur le plan de la santé telle qu’évaluée par l’intéressé. Les différences entre les revenus selon le quartier ont été cernées malgré des différences minimales entre les patients ayant ou non une adresse de courriel inscrite dans leur dossier médical. Il y avait très peu de différences dans les réponses aux questions du sondage entre les 2 méthodes d’enquête, et ces distinctions pouvaient s’expliquer par les différences sous-jacentes dans les caractéristiques démographiques des patients.
C o n c l u s i o n Nos constatations font valoir que les caractéristiques démographiques des répondants pourraient être différentes selon la méthode de distribution du sondage, et ces distinctions pourraient influencer les réponses au questionnaire. Les modes de distribution du sondage qui exigent une connaissance des outils électroniques pourraient sous-représenter les patients vivant dans des quartiers à faible revenu. Les cliniques devraient envisager d’évaluer le biais de non-réponse et d’apporter des ajustements en fonction des caractéristiques démographiques dans l’interprétation des résultats du sondage. Il faudrait plus de recherche pour comprendre comment les cliniques de soins primaires pourraient optimiser les méthodes de distribution électronique des sondages dans le but de rejoindre un échantillon représentatif de patients.
Mesurer l’expérience des patients en soins primaires
Comparaison d’un sondage par courriel et dans la salle d’attente au sein
d’une équipe de santé familiale
Morgan Slater
MSc PhDTara Kiran
MD CCFP MScPoints dE rEPèrE du rédactEur
• Évaluer l’expérience des patients est une étape essentielle pour comprendre et améliorer la qualité des soins primaires. Dans le contexte d’efforts pour améliorer la qualité, les cliniques de santé familiale sont de plus en plus appelées à faire des sondages auprès des patients au sujet de leurs expériences en rapport avec les soins.
• Il importe que les cliniques de soins primaires reconnaissent que la méthode de distribution du sondage peut influencer l’échantillon des répondants et, par conséquent, les réponses exprimées. Une option peu coûteuse pour recueillir des données sur l’expérience des patients, comme des sondages électroniques par courriel, peut sous-représenter les patients qui vivent dans des quartiers à faible revenu. Cette étude comparait les résultats et les caractéristiques des patients selon qu’ils avaient répondu à des sondages par courriel ou dans la salle d’attente.
• Les réponses étaient semblables entre les sondages, sauf que les répondants par courriel étaient moins susceptibles de répondre qu’ils pouvaient voir un médecin le même jour ou le lendemain (53,3 c. 60,2 %, P = ,0265) et plus enclins à dire que les professionnels de la santé passaient assez de temps avec eux toujours ou souvent (89,2 c. 85,1 %, P = ,0457). Ces distinctions s’expliquaient par les différences sous-jacentes dans les caractéristiques démographiques des patients. Dans
l’interprétation des résultats d’un sondage, les cliniques devraient envisager d’évaluer le biais de non-réponse et d’apporter des ajustements en fonction des caractéristiques des patients.
Cet article a fait l’objet d’une révision par des pairs.
Research
|
Measuring the patient experience in primary care
M
easuring the patient experience is an integralstep toward understanding and improving the quality of primary care.1-5 As part of quality
improvement efforts, family practices are increasingly being asked to survey patients about their experiences with care. In Ontario, patient experience surveys are now mandatory for all family health teams (FHTs) and community health centres.6 However, finding the capacity
to survey patients regularly can be challenging in a busy family practice. Traditional methods of collecting patient experience data, including surveying patients in clinic waiting rooms, via telephone, or by mail, can be costly and burdensome to primary care practices.
Electronic surveys sent via e-mail offer a low-cost alternative for frequent patient surveys. However, access to digital resources, including the Internet, is unequal across demographic and socioeconomic groups.7-9 Additionally, how data are collected can
influence the content of survey responses. These mode effects, which occur when data obtained via one mode of data collection are different from that obtained by another, have been described in the literature.2,10-18 The
method of data collection can also influence data quality and response rate19 owing to several issues, including
differences in sampling frames and nonresponse.19,20
There is little literature to guide family practices on how patient characteristics and responses might differ when conducting patient experience surveys in their practices using different delivery methods.
Our objective was to assess whether patients responding to an online survey delivered via e-mail were representative of a practice population and whether their characteristics and responses differed from those of patients surveyed in clinic waiting rooms.
MEthods
Setting and context
The St Michael’s Hospital Academic Family Health Team (SMHAFHT) is a large, interprofessional primary care organization with 5 clinics serving 35 000 enrolled patients in the inner city of Toronto, Ont. The SMHAFHT serves a diverse population including urban professionals and families who work or live downtown, as well as patients who are homeless, live in poverty, or are new to Canada. The SMHAFHT developed a patient experience survey as part of their quality improvement work, based on questions in the Commonwealth Fund International Health Policy Survey.21 The survey captured patient perspectives about
access and patient-centredness through questions with Likert-scale response options. The survey also asked for sociodemographic information, including age, gender, and postal code, as well as self-rated health
(the complete survey is available on request from the corresponding author).
In January 2013, the SMHAFHT began to collect patient e-mail addresses as part of routine demographic data. Since January 2014, all patients with e-mail addresses on file have been e-mailed a link to the survey during their birth month. The survey is hosted online by FluidSurveys, and patients complete the survey on their home devices. To determine if patients responding to the online survey were representative of our patient population, we distributed the same survey in clinic waiting rooms during July and August 2014. Patients registering at the clinic were systematically approached by summer students who provided interested patients with an electronic tablet that enabled patients to access the online survey. Patients who could not communicate in English, had an advanced form of dementia, or self-reported already completing the survey were not eligible to participate in the waiting room survey.
Design and participants
We conducted a cross-sectional analysis comparing respondent demographic characteristics and survey responses from e-mail surveys completed between January 1, 2014, and June 30, 2014, (N = 594) and surveys completed in the waiting room between July 1, 2014, and August 31, 2014 (N = 606). For both surveys, we excluded patients younger than 18 years of age owing to potential inconsistencies in data quality for this age group (e-mail survey n = 7; waiting room survey n = 14). We also obtained demographic data for all patients enrolled in the SMHAFHT (as of August 2014) from the electronic medical record, including whether patients had e-mail addresses on file.
Analysis
We considered any survey that contained only blank responses to be incomplete and excluded these from the analysis. We used the Statistics Canada Postal Code Conversion File to convert patient postal codes to the corresponding neighbourhood income quintile based on census data.22 We compared e-mail and waiting room
respondents’ demographic characteristics (age, gender, income quintile, and self-rated health) using χ2 tests and
compared these characteristics to those of all patients enrolled in the SMHAFHT. We used χ2 tests to compare
the demographic profile of enrolled patients with and without e-mail addresses on file to determine if the sampling frame for the e-mail survey was representative of the entire patient population.
or refused to answer, these were removed from the denominators. We used multivariate logistic regression models to assess differences in responses from the 2 delivery methods before and after adjustment for patient demographic characteristics. We performed a sensitivity analysis to assess whether differences in e-mail and waiting room responses varied by clinic, stratifying the analysis to compare differences in responses for all questions for 2 clinics: the largest clinic (clinic A) with a more affluent patient population, and a smaller clinic (clinic D) with a less affluent patient population. All analyses were conducted using SAS, version 9.4.
This initiative was reviewed by institutional authorities at St Michael’s Hospital and deemed to require neither research ethics board approval nor written informed consent from participants.
rEsuLts
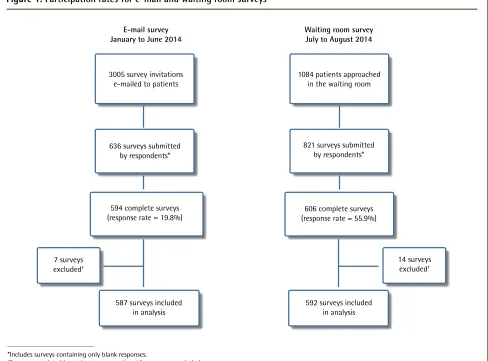
Response rates for the surveys delivered via e-mail and in the waiting room are summarized in Figure 1.
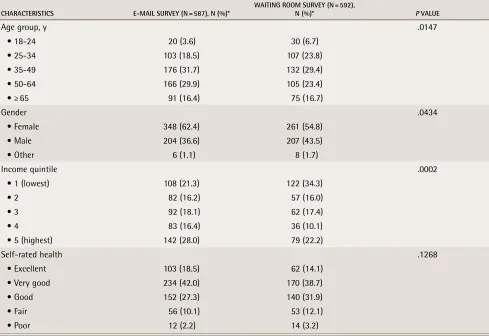
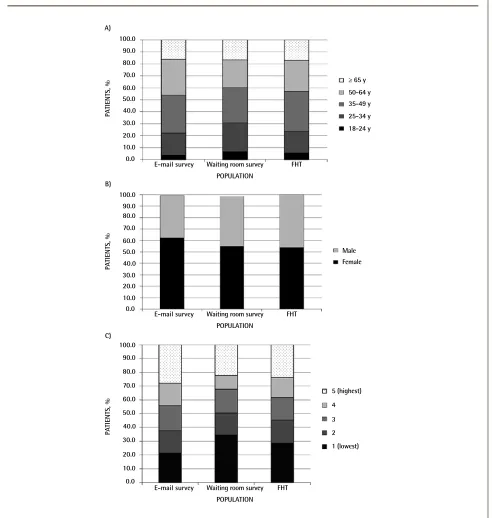
Patients who completed either the e-mail or the waiting room survey were similar with respect to self-rated health (Table 1). However, patients responding to the e-mail survey had a different age (P = .0147) and gender distribution (P = .0434) and were more likely to live in higher-income neighbourhoods (P = .0002) than those who participated in the waiting room. When compared with the demographic profile of all patients enrolled in the SMHAFHT, the waiting room survey overrepresented those aged 18 to 34, while the e-mail survey overcaptured respondents aged 50 to 64 (Figure 2). Female patients were overrepresented by the e-mail survey (Figure 2). Patients living in low-income neighbourhoods were underrepresented in the e-mail survey but overrepresented in the waiting room survey (Figure 2), whereas those living in high-income neighbourhoods were overrepresented among e-mail survey respondents.
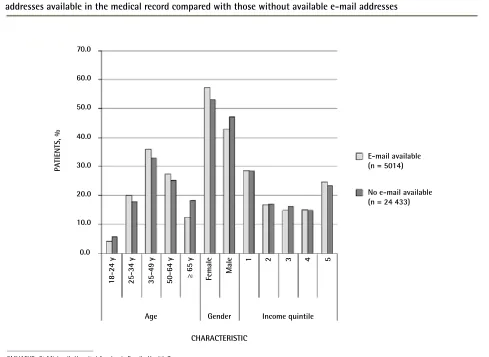
As of June 30, 2014, 17.0% of enrolled patients aged 18 or older had e-mail addresses on file. Patients between the ages of 25 and 64 were more likely to have an e-mail address on file (P < .001), as were female
Figure 1.
Participation rates for e-mail and waiting room surveys
*Includes surveys containing only blank responses.
†Surveys completed by patients younger than 18 years were excluded.
E-mail survey January to June 2014
3005 survey invitations e-mailed to patients
636 surveys submitted by respondents*
594 complete surveys (response rate = 19.8%)
587 surveys included in analysis 7 surveys
excluded†
14 surveys excluded†
Waiting room survey July to August 2014
1084 patients approached in the waiting room
821 surveys submitted by respondents*
606 complete surveys (response rate = 55.9%)
Research
|
Measuring the patient experience in primary care
patients (P < .001), but no differences were seen by income quintile profile (P = .0971; Figure 3).
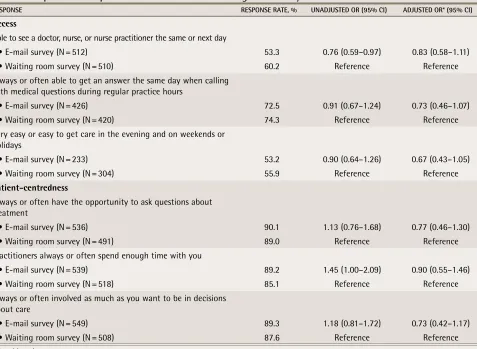
Responses were similar between the e-mail and waiting room survey except for 2 questions (Table 2): patients who responded to the e-mail survey were less likely to report being able to see a provider on the same or next day (53.3% vs 60.2%, P = .0265) and more likely to report that their health care providers always or often spent enough time with them (89.2% vs 85.1%, P = .0457). After adjustment for patient demographic characteristics, there were no significant differences between e-mail and waiting room survey responses.
Our stratified analysis found that unadjusted differences in e-mail and waiting room responses were consistent between clinic A and clinic D except for the question relating to same- or next-day access. We re-ran the multivariate logistic regression model for same- or next-day access to include an interaction term between clinic and type of survey. This interaction term was non-significant (P = .0638), indicating that the relationship between survey method and responses did not vary by clinic.
discussion
We found that patients responding to a primary care patient experience survey delivered via e-mail were more likely to be between the ages of 35 and 64, be female, and live in high-income neighbourhoods compared with patients responding to the same survey conducted in the waiting room. However, we found minimal differences in neighbourhood income quintiles between patients with and without e-mail addresses in their medical records. There were few differences in responses to the survey questions between the 2 survey methods, and any differences were explained by the underlying differences in patient demographic characteristics.
Electronic surveys delivered to patients by e-mail offer practices a convenient, low-cost method of regularly surveying patients to improve quality of care; however, our findings support concerns that they might underrepresent patients living in low-income neighbourhoods. In our setting, underrepresentation of these patients did not relate to differences in providing the practice with an e-mail address (sampling bias) but likely related to the probability of patients living in low-income neighbourhoods responding to the
table 1.
Comparison of respondent demographic characteristics for e-mail and waiting room surveys
CHARACTERISTICS E-MAIl SuRvEy (n = 587), n (%)* WAITIng RooM SuRvEy (n = 592), n (%)* P vAluE
Age group, y .0147
• 18-24 20 (3.6) 30 (6.7)
• 25-34 103 (18.5) 107 (23.8)
• 35-49 176 (31.7) 132 (29.4)
• 50-64 166 (29.9) 105 (23.4)
• ≥ 65 91 (16.4) 75 (16.7)
Gender .0434
• Female 348 (62.4) 261 (54.8)
• Male 204 (36.6) 207 (43.5)
• Other 6 (1.1) 8 (1.7)
Income quintile .0002
• 1 (lowest) 108 (21.3) 122 (34.3)
• 2 82 (16.2) 57 (16.0) • 3 92 (18.1) 62 (17.4) • 4 83 (16.4) 36 (10.1)
• 5 (highest) 142 (28.0) 79 (22.2)
Self-rated health .1268
• Excellent 103 (18.5) 62 (14.1)
• Very good 234 (42.0) 170 (38.7)
• Good 152 (27.3) 140 (31.9)
• Fair 56 (10.1) 53 (12.1) • Poor 12 (2.2) 14 (3.2)
e-mail survey invitation (nonresponse bias). Differences in computer literacy and access to Internet resources might be contributing factors7-9,23,24; however, others have also reported
low response rates across numerous survey methods among populations with low income.25-27
We also found differences in the age and gender distribution of respondents to the e-mail survey
compared with respondents to the waiting room survey. These differences are likely due to a combination of sampling and nonresponse bias. For example, female patients were more likely than expected to have e-mail addresses on file and a greater proportion responded to the e-mail survey compared with the waiting room survey. In contrast, patients aged 50 to 64 were less
Figure 2.
Demographic distribution of e-mail survey respondents, waiting room survey respondents, and all patients
enrolled in the SMHAFHT:
A) Age distribution, B) sex distribution, and C) income quintile
.
FHT—family health team, SMHAFHT—St Michael’s Hospital Academic FHT.
0.0 10.0 30.0 40.0 50.0 60.0 70.0
20.0 80.0 90.0 100.0
PA
TIENTS, %
POPULATION A)
E-mail survey Waiting room survey
Male ≥ 65 y 50-64 y 35-49 y 25-34 y 18-24 y
FHT
0.0 10.0 30.0 40.0 50.0 60.0 70.0
20.0 80.0 90.0 100.0
PA
TIENTS, %
POPULATION B)
E-mail survey Waiting room survey FHT
0.0 10.0 30.0 40.0 50.0 60.0 70.0
20.0 80.0 90.0 100.0
PA
TIENTS, %
POPULATION C)
E-mail survey Waiting room survey FHT
Female
Research
|
Measuring the patient experience in primary care
likely than expected to have e-mail addresses on record but a greater proportion responded to the e-mail survey compared with the waiting room survey. The response rate to the e-mail survey was much lower than that of the survey conducted in the waiting room, which is a known limitation of surveys delivered by e-mail.19 Low
response rates increase the likelihood of nonresponse bias and can limit the generalizability of survey results.19
While respondents to the waiting room survey were more likely to reside in low-income neighbourhoods compared with e-mail survey respondents, they were also more likely to report being able to see a provider the same or next day when they needed care. This difference in experience of access to care might be a reflection of differences inherent to the 2 survey delivery methods. Patients in the waiting room have successfully navigated the health care system to obtain an appointment with a provider, whereas e-mail survey respondents might not have visited the clinic for several months and might be less familiar with clinic procedures. In addition, the confluence of respondents living in low-income neighbourhoods and better perceived access might reflect our clinic
setting, where we have designed services to be accessible to marginalized populations (eg, by accommodating walk-in patients with urgent concerns). We also found that respondents to the waiting room survey were less likely to report that their care provider spent enough time with them compared with e-mail survey respondents. Patients who perceive having short appointment times believe that it is detrimental to their treatment as well as their relationships with their providers.28 Satisfaction with
the length of primary care visits has been reported to be associated with age, race, health status, and visit type, although education level was not found to be significant.29
Differences in patient experience of same- or next-day access and time spent during the appointment disappeared after adjustment for respondent demographic characteristics. Patient experience surveys in both acute30,31 and primary care32,33 settings have
found differences in responses across survey mode and patient mix, and suggest that valid comparisons across institutions require adjustment. However, most primary care practices likely do not have the resources to statistically adjust survey responses.
Figure 3.
Age, gender, and income quintile distribution for all patients enrolled in the SMHAFHT with e-mail
addresses available in the medical record compared with those without available e-mail addresses
CHARACTERISTIC
PA
TIENTS, %
0.0 10.0 20.0
Age
E-mail available (n = 5014) 30.0
40.0 50.0 60.0 70.0
Gender
Female
Income quintile
Male
18-24 y 25-34 y 35-49 y 50-64 y ≥ 65 y
1 2 3 4 5
No e-mail available (n = 24 433)
limitations
This study has some limitations. First, the timing of the surveys, while chosen for practicality, was different and might affect the comparability of the 2 delivery modes. Patients in the waiting room were surveyed directly before an appointment, whereas patients receiving the e-mail survey had not necessarily had recent appointments with their providers. Survey timing has been shown to be an important factor in assessing patient experience; patient evaluations are poorer when measured at longer times after the encounter.34-42 Second, the survey was
con-ducted anonymously, so we were not able to analyze the demographic characteristics of nonrespondents to under-stand how nonresponse bias might have affected the generalizability of the survey findings. The demographic distribution of e-mail respondents appeared to be sig-nificantly different from that of those patients with e-mail addresses on file, so it is likely that nonresponse bias is relevant here. Both survey modes were relatively tech-nologically intensive, so they might have excluded the elderly or those with lower education or technical com-fort.43-45 Anecdotally, there were some technical issues
with the tablet technology used in the waiting room sur-vey, with some patients needing assistance to complete the surveys; most incomplete surveys were conducted in the waiting room. Third, we used the patient’s neighbour-hood income quintile22 as a marker of socioeconomic
sta-tus, which is not necessarily representative of a patient’s actual income, especially in urban neighbourhoods that are being gentrified.46 In addition, neighbourhood income
quintiles are not assigned to people with no fixed address, so this measure cannot be used to assess homeless or underhoused patients. Finally, while we had a reasonable sample size for univariate analyses, we might not have had sufficient power to detect differences in the multivari-ate logistic regression.
Conclusion
Patient experience surveys distributed via e-mail might underrepresent patients from low-income neighbourhoods. The method of survey delivery can influence who responds, which might in turn affect survey responses. Practices should consider evaluating for nonresponse bias and adjusting for patient
table 2.
Comparison of responses between e-mail and waiting room surveys
RESPonSE RESPonSE RATE, % unADjuSTED oR (95% CI) ADjuSTED oR* (95% CI)
access
Able to see a doctor, nurse, or nurse practitioner the same or next day
• E-mail survey (N = 512) 53.3 0.76 (0.59–0.97) 0.83 (0.58–1.11)
• Waiting room survey (N = 510) 60.2 Reference Reference
Always or often able to get an answer the same day when calling with medical questions during regular practice hours
• E-mail survey (N = 426) 72.5 0.91 (0.67–1.24) 0.73 (0.46–1.07)
• Waiting room survey (N = 420) 74.3 Reference Reference
Very easy or easy to get care in the evening and on weekends or holidays
• E-mail survey (N = 233) 53.2 0.90 (0.64–1.26) 0.67 (0.43–1.05)
• Waiting room survey (N = 304) 55.9 Reference Reference
Patient-centredness
Always or often have the opportunity to ask questions about treatment
• E-mail survey (N = 536) 90.1 1.13 (0.76–1.68) 0.77 (0.46–1.30)
• Waiting room survey (N = 491) 89.0 Reference Reference
Practitioners always or often spend enough time with you
• E-mail survey (N = 539) 89.2 1.45 (1.00–2.09) 0.90 (0.55–1.46)
• Waiting room survey (N = 518) 85.1 Reference Reference
Always or often involved as much as you want to be in decisions about care
• E-mail survey (N = 549) 89.3 1.18 (0.81–1.72) 0.73 (0.42–1.17)
• Waiting room survey (N = 508) 87.6 Reference Reference
OR—odds ratio.
Research
|
Measuring the patient experience in primary care
demographic characteristics when interpreting survey results. Further research is needed to understand how primary care practices can optimize electronic survey delivery methods to generate responses from a representative sample of patients.
Dr Slater is Senior Research Associate in the Department of Family and Community Medicine at St Michael’s Hospital in Toronto, Ont. Dr Kiran is a family physician at St Michael’s Hospital and Assistant Professor and Clinician Investigator in the Department of Family and Community Medicine at the University of Toronto, Associate Scientist with the Centre for Research on Inner City Health at the Li Ka Shing Knowledge Institute of St Michael’s Hospital, and Adjunct Scientist at the Institute for Clinical Evaluative Sciences.
Acknowledgment
We thank Madison Giles, Joshua Feldman, Lisa Miller, Sharon Wiltshire,
and the St Michael’s Hospital Academic Family Health Team Quality Steering Committee for their contributions.
contributors
Both authors contributed to the concept and design of the study, data gathering, and interpretation. Dr Slater conducted the data analyses and drafted the manuscript. Both authors critically reviewed the manuscript and approved it for publication.
competing interests
None declared
correspondence
Dr Tara Kiran; e-mail [email protected]
references
1. Browne K, Roseman D, Shaller D, Edgman-Levitan S. Analysis & commentary. Measuring patient experience as a strategy for improving primary care. Health Aff (Millwood) 2010;29(5):921-5.
2. Gribble RK, Haupt C. Quantitative and qualitative differences between handout and mailed patient satisfaction surveys. Med Care 2005;43(3):276-81. 3. Urden LD. Patient satisfaction measurement: current issues and implications.
Lippincott’s Case Management 2002;7(5):194-200.
4. Evans RG, Edwards A, Evans S, Elwyn B, Elwyn G. Assessing the practising physician using patient surveys: a systematic review of instruments and feedback methods. Fam Pract 2007;24(2):117-27. Epub 2007 Jan 29. 5. Cleary PD. The increasing importance of patient surveys. Quality in health
care. Qual Health Care 1999;8(4):212.
6. Ontario Ministry of Health and Long-Term Care [website]. About excellent care for all 2014. Toronto, ON: Ontario Ministry of Health and Long-Term
Care; 2014. Available from: www.health.gov.on.ca/en/pro/programs/
ecfa/legislation/act_regs.aspx. Accessed 2015 Sep 18.
7. Martin SP, Robinson JP. The income digital divide: trends and predictions for levels of internet use. Soc Probl 2007;54(1):1-22.
8. Robinson JP, DiMaggio P, Hargittai E. New social survey perspectives on the digital divide. IT Soc 2003;1:1-22.
9. Gilleard C, Higgs P. Internet use and the digital divide in the English Longitudinal Study of Ageing. Eur J Ageing 2008;5:233-9.
10. De Leeuw ED. Mixed-mode surveys and the Internet. Surv Pract 2010;3(6):1-5. 11. Denscombe M. Web-based questionnaires and the mode effect: an
evaluation based on completion rates and data contents of near-identical questionnaires delivered in different modes. Soc Sci Comput Rev 2006;24(2):246-54.
12. Shim JM, Shin E, Johnson TP. Self-rated health assessed by web versus mail modes in a mixed mode survey: the digital divide effect and the genuine survey mode effect. Med Care 2013;51(9):774-81.
13. McCabe SE, Couper MP, Cranford JA, Boyd CJ. Comparison of Web and mail surveys for studying secondary consequences associated with substance use: evidence for minimal mode effects. Addict Behav 2006;31(1):162-8.
14. Beebe TJ, Locke GR 3rd, Barnes SA, Davern ME, Anderson KJ. Mixing web and mail methods in a survey of physicians. Health Serv Res 2007;42(3 Pt 1):1219-34.
15. Miller ET, Neal DJ, Roberts LJ, Baer JS, Cressler SO, Metrik J, et al. Test-retest reliability of alcohol measures: is there a difference between internet-based assessment and traditional methods? Psychol Addict Behav 2002;16(1):56-63. 16. Buskirk TD, Stein KD. Telephone vs. mail survey gives different
SF-36 quality-of-life scores among cancer survivors. J Clin Epidemiol 2008;61(10):1049-55. Epub 2008 Jun 6.
17. Cheung YB, Goh C, Thumboo J, Khoo KS, Wee J. Quality of life scores differed according to mode of administration in a review of three major oncology questionnaires. J Clin Epidemiol 2006;59(2):185-91.
18. De Vries H, Elliott MN, Hepner KA, Keller SD, Hays RD. Equivalence of mail and telephone responses to the CAHPS Hospital Survey. Health Serv Res 2005;40(6 Pt 2):2120-39.
19. Bowling A. Mode of questionnaire administration can have serious effects on data quality. J Public Health (Oxf) 2005;27(3):281-91. Epub 2005 May 3.
20. Groves RM, Fowler FJ, Couper MP, Lepkowski M, Singer E, Tourangeau R. Survey methodology. Hoboken, NJ: John Wiley & Sons; 2004.
21. Health Council of Canada. How do Canadians rate the health care system? Results from the 2010 Commonwealth Fund International Health Policy Survey. Toronto, ON: Health Council of Canada; 2010.
22. Wilkins R, Khan S. PCCF+ version 5H user’s guide. Automated geographic coding based on the Statistics Canada Postal Code Conversion Files. Ottawa, ON: Health Analysis Division, Statistics Canada; 2011.
23. Diment K, Garrett-Jones S. How demographic characteristics affect mode preference in a postal/web mixed-mode survey of Australian researchers. Soc Sci Comput Rev 2007;25:510-7.
24. Miller TI, Miller-Kobayashi M, Caldwell E, Thurston S, Collett B. Citizen surveys on the web: general population surveys of community opinion. Soc Sci Comput Rev 2002;20:124-36.
25. Chang L, Krosnick JA. The representativeness of national samples: comparisons of an RDD telephone survey with matched Internet surveys by Harris Interactive and Knowledge Networks. Paper presented at: Conference of the American Association for Public Opinion Research; 2001 May 17-20; Montreal, QC.
26. Schejbal JA, Lavrakas PJ. Panel attrition in a dual-frame local area telephone survey. In: Proceedings of the American Statistical Association. Alexandria, VA: American Statistical Association Section on Survey Research Methods; 1995. p. 1035-9.
27. O’Neil MJ. Estimating the nonresponse bias due to refusals in telephone surveys. Public Opin Q 1979;43:218-32.
28. Tabler J, Scammon DL, Kim J, Farrell T, Tomoaia-Cotisel A, Magill MK. Patient care experiences and perceptions of the patient-provider relationship: a mixed method study. Patient Exp J 2014;1(1):75-87.
29. Gross DA, Zyzanski SJ, Borawski EA, Cebul RD, Stange KC. Patient satisfaction with time spent with their physician. J Fam Pract 1998;47(2):133-7. 30. Elliott MN, Zaslavsky AM, Goldstein E, Lehrman W, Hambarsoomians K,
Beckett MK, et al. Effects of survey mode, patient mix, and nonresponse on CAHPS Hospital Survey scores. Health Serv Res 2009;44(2 Pt 1):501-18. 31. Greaves F, Pape UJ, King D, Darzi A, Majeed A, Wachter RM, et al.
Associations between Internet-based patient ratings and conventional surveys of patient experience in the English NHS: an observational study. BMJ Qual Saf 2012;21(7):600-5. Epub 2012 Apr 20.
32. Lyratzopoulos G, Elliott M, Barbiere JM, Henderson A, Staetsky L, Paddison C, et al. Understanding ethnic and other socio-demographic differences in patient experience of primary care: evidence from the English General Practice Patient Survey. BMJ Qual Saf 2012;21(1):21-9. Epub 2011 Sep 7. 33. Paddison C, Elliott M, Parker R, Staetsky L, Lyratzopoulos G, Campbell JL,
et al. Should measures of patient experience in primary care be adjusted for case mix? Evidence from the English General Practice Patient Survey. BMJ Qual Saf 2012;21(8):634-40. Epub 2012 May 23.
34. Bjertnaes OA. The association between survey timing and patient-reported experiences with hospitals: results of a national postal survey. BMC Med Res Methodol 2012;12:13.
35. Bowman MA, Herndon A, Sharp PC, Dignan MB. Assessment of the patient-doctor interaction scale for measuring patient satisfaction. Patient Educ Couns 1992;19(1):75-80.
36. Savage R, Armstrong D. Effect of a general practitioner’s consulting style on patients’ satisfaction: a controlled study. BMJ 1990;301(6758):968-70. 37. Stevens M, Reininga IH, Boss NA, van Horn JR. Patient satisfaction at and
after discharge. Effect of a time lag. Patient Educ Couns 2006;60(2):241-5. Epub 2005 Oct 25.
38. Lemos P, Pinto A, Morais G, Pereira J, Loureiro R, Teixeira S, et al. Patient satisfaction following day surgery. J Clin Anesth 2009;21(3):200-5. 39. Bendall-Lyon D, Powers TL, Swan JE. Time does not heal all wounds.
Patients report lower satisfaction levels as time goes by. Mark Health Serv 2001;21(3):10-4.
40. Jensen HI, Ammentorp J, Kofoed PE. User satisfaction is influenced by the interval between a health care service and the assessment of the service. Soc Sci Med 2010;70(12):1882-7. Epub 2010 Mar 18.
41. Jensen HI, Ammentorp J, Kofoed PE. Assessment of health care by children and adolescents depends on when they respond to the questionnaire. Int J Qual Health Care 2010;22(4):259-65. Epub 2010 Apr 28.
42. Kinnersley P, Stott N, Peters T, Harvey I, Hackett P. A comparison of methods for measuring patient satisfaction with consultations in primary care. Fam Pract 1996;13(1):41-51.
43. Rice RE, Katz JE. Comparing internet and mobile phone usage: digital divides of usage, adoption, and dropouts. Telecomm Policy 2003;27(8-9):597-623. 44. Miller JD. Who is using the web for science and health information? Sci
Commun 2001;22(3):256-73.
45. Brodie M, Flournoy RE, Altman DE, Blendon RJ, Benson JM, Rosenbaum MD. Health information, the Internet, and the digital divide. Health Aff (Millwood) 2000;19(6):255-65.