VOLUME 5 ISSUE 9 APRIL 2017 ISSN 2050-4322
Improving patient experience in primary care:
a multimethod programme of research on
the measurement and improvement of
patient experience
Jenni Burt, John Campbell, Gary Abel, Ahmed Aboulghate, Faraz Ahmed,
Anthea Asprey, Heather Barry, Julia Beckwith, John Benson, Olga Boiko,
Pete Bower, Raff Calitri, Mary Carter, Antoinette Davey, Marc N Elliott,
Natasha Elmore, Conor Farrington, Hena Wali Haque, William Henley,
Val Lattimer, Nadia Llanwarne, Cathy Lloyd, Georgios Lyratzopoulos,
Inocencio Maramba, Luke Mounce, Jenny Newbould, Charlotte Paddison,
Richard Parker, Suzanne Richards, Martin Roberts, Claude Setodji,
care: a multimethod programme of
research on the measurement and
improvement of patient experience
Jenni Burt,
1
John Campbell,
2
Gary Abel,
1,2
Ahmed Aboulghate,
1
Faraz Ahmed,
1
Anthea Asprey,
2
Heather Barry,
2
Julia Beckwith,
1
John Benson,
3
Olga Boiko,
2
Pete Bower,
4
Raff Calitri,
2
Mary Carter,
2
Antoinette Davey,
2
Marc N Elliott,
5
Natasha Elmore,
1
Conor Farrington,
1
Hena Wali Haque,
1
William Henley,
2
Val Lattimer,
6
Nadia Llanwarne,
1
Cathy Lloyd,
7
Georgios Lyratzopoulos,
1
Inocencio Maramba,
2
Luke Mounce,
2
Jenny Newbould,
1
Charlotte Paddison,
1
Richard Parker,
3
Suzanne Richards,
2
Martin Roberts,
2
Claude Setodji,
5
Jonathan Silverman,
8
Fiona Warren,
2
Ed Wilson,
1
Christine Wright
2
and Martin Roland
1
*
1
Cambridge Centre for Health Services Research, Institute of Public Health,
University of Cambridge School of Clinical Medicine, Cambridge, UK
2
University of Exeter Medical School, Exeter, UK
3
Primary Care Unit, Institute of Public Health, University of Cambridge School of
Clinical Medicine, Cambridge, UK
4
National Institute for Health Research (NIHR) School for Primary Care Research,
Manchester Academic Health Science Centre, University of Manchester,
Manchester, UK
5
RAND Corporation, Santa Monica, CA, USA
6
School of Health Sciences, University of East Anglia, Norwich, UK
7
Faculty of Health & Social Care, The Open University, Milton Keynes, UK
8
University of Cambridge Medical School, Cambridge, UK
*Corresponding author
ISSN 2050-4322 (Print)
ISSN 2050-4330 (Online)
This journal is a member of and subscribes to the principles of the Committee on Publication Ethics (COPE) (www.publicationethics.org/).
Editorial contact: [email protected]
The full PGfAR archive is freely available to view online at www.journalslibrary.nihr.ac.uk/pgfar. Print-on-demand copies can be purchased from the report pages of the NIHR Journals Library website: www.journalslibrary.nihr.ac.uk
Criteria for inclusion in theProgramme Grants for Applied Researchjournal
Reports are published inProgramme Grants for Applied Research(PGfAR) if (1) they have resulted from work for the PGfAR programme, and (2) they are of a sufficiently high scientific quality as assessed by the reviewers and editors.
Programme Grants for Applied Research programme
The Programme Grants for Applied Research (PGfAR) programme, part of the National Institute for Health Research (NIHR), was set up in 2006 to produce independent research findings that will have practical application for the benefit of patients and the NHS in the relatively near future. The Programme is managed by the NIHR Central Commissioning Facility (CCF) with strategic input from the Programme Director.
The programme is a national response mode funding scheme that aims to provide evidence to improve health outcomes in England through promotion of health, prevention of ill health, and optimal disease management (including safety and quality), with particular emphasis on conditions causing significant disease burden.
For more information about the PGfAR programme please visit the website: http://www.nihr.ac.uk/funding/programme-grants-for-applied-research.htm
This report
The research reported in this issue of the journal was funded by PGfAR as project number RP-PG-0608-10050. The contractual start date was in October 2010. The final report began editorial review in December 2015 and was accepted for publication in June 2016. As the funder, the PGfAR programme agreed the research questions and study designs in advance with the investigators. The authors have been wholly responsible for all data collection, analysis and interpretation, and for writing up their work. The PGfAR editors and production house have tried to ensure the accuracy of the authors’report and would like to thank the reviewers for their constructive comments on the final report document. However, they do not accept liability for damages or losses arising from material published in this report.
This report presents independent research funded by the National Institute for Health Research (NIHR). The views and opinions expressed by authors in this publication are those of the authors and do not necessarily reflect those of the NHS, the NIHR, CCF, NETSCC, PGfAR or the Department of Health. If there are verbatim quotations included in this publication the views and opinions expressed by the interviewees are those of the interviewees and do not necessarily reflect those of the authors, those of the NHS, the NIHR, NETSCC, the PGfAR programme or the Department of Health.
Programme Grants for Applied Research
Editor-in-Chief
Professor Paul Little Professor of Primary Care Research, University of Southampton, UK
NIHR Journals Library Editor-in-Chief
Professor Tom Walley Director, NIHR Evaluation, Trials and Studies and Director of the EME Programme, UK
NIHR Journals Library Editors
Professor Ken Stein Chair of HTA Editorial Board and Professor of Public Health, University of Exeter Medical School, UK
Professor Andree Le May Chair of NIHR Journals Library Editorial Group (EME, HS&DR, PGfAR, PHR journals)
Dr Martin Ashton-Key Consultant in Public Health Medicine/Consultant Advisor, NETSCC, UK
Professor Matthias Beck Chair in Public Sector Management and Subject Leader (Management Group), Queen’s University Management School, Queen’s University Belfast, UK
Dr Tessa Crilly Director, Crystal Blue Consulting Ltd, UK
Professor William McGuire Professor of Child Health, Hull York Medical School, University of York, UK
Professor John Norrie Chair in Medical Statistics, University of Edinburgh, UK
Professor John Powell Consultant Clinical Adviser, National Institute for Health and Care Excellence (NICE), UK
Professor James Raftery Professor of Health Technology Assessment, Wessex Institute, Faculty of Medicine, University of Southampton, UK
Dr Rob Riemsma Reviews Manager, Kleijnen Systematic Reviews Ltd, UK
Professor Helen Roberts Professor of Child Health Research, UCL Institute of Child Health, UK
Professor Helen Snooks Professor of Health Services Research, Institute of Life Science, College of Medicine, Swansea University, UK
Professor Jim Thornton Professor of Obstetrics and Gynaecology, Faculty of Medicine and Health Sciences, University of Nottingham, UK
Please visit the website for a list of members of the NIHR Journals Library Board: www.journalslibrary.nihr.ac.uk/about/editors
Editorial contact: [email protected]
Professor Jonathan Ross Professor of Sexual Health and HIV, University Hospital Birmingham, UK
Dr Eugenia Cronin Senior Scientific Advisor, Wessex Institute, UK
Professor Martin Underwood Director, Warwick Clinical Trials Unit, Warwick Medical School, University of Warwick, UK
Professor Geoffrey Meads Professor of Health Sciences Research, Health and Wellbeing Research Group, University of Winchester, UK
Ms Tara Lamont Scientific Advisor, NETSCC, UK
Dr Catriona McDaid Senior Research Fellow, York Trials Unit, Department of Health Sciences, University of York, UK
Abstract
Improving patient experience in primary care:
a multimethod programme of research on the
measurement and improvement of patient experience
Jenni Burt,
1John Campbell,
2Gary Abel,
1,2Ahmed Aboulghate,
1Faraz Ahmed,
1Anthea Asprey,
2Heather Barry,
2Julia Beckwith,
1John Benson,
3Olga Boiko,
2Pete Bower,
4Raff Calitri,
2Mary Carter,
2Antoinette Davey,
2Marc N Elliott,
5Natasha Elmore,
1Conor Farrington,
1Hena Wali Haque,
1William Henley,
2Val Lattimer,
6Nadia Llanwarne,
1Cathy Lloyd,
7Georgios Lyratzopoulos,
1Inocencio Maramba,
2Luke Mounce,
2Jenny Newbould,
1Charlotte Paddison,
1Richard Parker,
3Suzanne Richards,
2Martin Roberts,
2Claude Setodji,
5Jonathan Silverman,
8Fiona Warren,
2Ed Wilson,
1Christine Wright
2and Martin Roland
1*
1Cambridge Centre for Health Services Research, Institute of Public Health, University of Cambridge School of Clinical Medicine, Cambridge, UK
2University of Exeter Medical School, Exeter, UK
3Primary Care Unit, Institute of Public Health, University of Cambridge School of Clinical Medicine, Cambridge, UK
4National Institute for Health Research (NIHR) School for Primary Care Research, Manchester Academic Health Science Centre, University of Manchester, Manchester, UK
5RAND Corporation, Santa Monica, CA, USA
6School of Health Sciences, University of East Anglia, Norwich, UK
7Faculty of Health & Social Care, The Open University, Milton Keynes, UK 8University of Cambridge Medical School, Cambridge, UK
*Corresponding author [email protected]
Background:There has been an increased focus towards improving quality of care within the NHS in the last 15 years; as part of this, there has been an emphasis on the importance of patient feedback within policy, through National Service Frameworks and the Quality and Outcomes Framework. The development and administration of large-scale national patient surveys to gather representative data on patient
experience, such as the national GP Patient Survey in primary care, has been one such initiative. However, it remains unclear how the survey is used by patients and what impact the data may have on practice.
Objectives:Our research aimed to gain insight into how different patients use surveys to record
experiences of general practice; how primary care staff respond to feedback; and how to engage primary care staff in responding to feedback.
Results:(1)Understanding patient experience data. Patients readily criticised their care when reviewing consultations on video, although they were reluctant to be critical when completing questionnaires. When trained raters judged communication during a consultation to be poor, a substantial proportion of patients
rated the doctor as‘good’or‘very good’. Absolute scores on questionnaire surveys should be treated with
caution; they may present an overoptimistic view of general practitioner (GP) care. However, relative
rankings to identify GPs who are better or poorer at communicating may be acceptable, as long as statistically reliable figures are obtained. Most patients have a particular GP whom they prefer to see; however, up to 40% of people who have such a preference are unable regularly to see the doctor of their choice. Users of out-of-hours care reported worse experiences when the service was run by a commercial provider than when
it was run by a not-for profit or NHS provider. (2)Understanding patient experience in minority ethnic groups.
Asian respondents to the GP Patient Survey tend to be registered with practices with generally low scores, explaining about half of the difference in the poorer reported experiences of South Asian patients than white British patients. We found no evidence that South Asian patients used response scales differently. When viewing the same consultation in an experimental vignette study, South Asian respondents gave higher scores than white British respondents. This suggests that the low scores given by South Asian respondents in patient experience surveys reflect care that is genuinely worse than that experienced by their white British counterparts. We also found that service users of mixed or Asian ethnicity reported lower scores than white
respondents when rating out-of-hours services. (3)Using patient experience data. We found that measuring
GP–patient communication at practice level masks variation between how good individual doctors are within
a practice. In general practices and in out-of-hours centres, staff were sceptical about the value of patient surveys and their ability to support service reconfiguration and quality improvement. In both settings, surveys were deemed necessary but not sufficient. Staff expressed a preference for free-text comments, as these provided more tangible, actionable data. An exploratory trial of real-time feedback (RTF) found that only 2.5% of consulting patients left feedback using touch screens in the waiting room, although more did so when reminded by staff. The representativeness of responding patients remains to be evaluated. Staff were broadly positive about using RTF, and practices valued the ability to include their own questions. Staff benefited from having a facilitated session and protected time to discuss patient feedback.
Conclusions:Our findings demonstrate the importance of patient experience feedback as a means of informing NHS care, and confirm that surveys are a valuable resource for monitoring national trends in quality of care. However, surveys may be insufficient in themselves to fully capture patient feedback, and in practice GPs rarely used the results of surveys for quality improvement. The impact of patient surveys appears to be limited and effort should be invested in making the results of surveys more meaningful to practice staff. There were several limitations of this programme of research. Practice recruitment for our in-hours studies took place in two broad geographical areas, which may not be fully representative of practices nationally. Our focus was on patient experience in primary care; secondary care settings may face different challenges in implementing quality improvement initiatives driven by patient feedback. Recommendations for future research include consideration of alternative feedback methods to better support patients to identify poor care; investigation into the factors driving poorer experiences of communication in South Asian patient groups; further investigation of how best to deliver patient
feedback to clinicians to engage them and to foster quality improvement; and further research to support the development and implementation of interventions aiming to improve care when deficiencies in patient experience of care are identified.
Funding:The National Institute for Health Research Programme Grants for Applied Research programme. ABSTRACT
NIHR Journals Library www.journalslibrary.nihr.ac.uk
Contents
List of tables xvii
List of figures xxi
List of boxes xxiii
List of abbreviations xxv
Plain English summary xxvii
Scientific summary xxix
Chapter 1Introduction to the IMPROVE (improving patient experience in primary
care) programme 1
Context 1
Experience and satisfaction 2
Patient experience matters 3
Capturing patient experience of care 3
The content of primary care surveys of patient experience 4
Out-of-hours services 5
Measuring patient experience of care 5
Patients’varying experiences of care 6
Using patient survey data to improve care 7
Summary 8
Aims of the programme 8
1. Understanding patient experience data 11
2. Understanding patient experience in minority ethnic groups 11 3. Using data on patient experience for quality improvement 11
Patient and public involvement 11
Formation and composition of the main study advisory group 11 Formation and composition of the out-of-hours study advisory group 12
Activities of the main study advisory group 12
Activities of the out-of-hours study advisory group 13
Section AUnderstanding patient experience data 15
Chapter 2How do patients respond to communication items on patient
experience questionnaires? Video elicitation interviews with patients 17
Abstract 17
Background 17
Methods 17
Results 17
Conclusions 17
Introduction and rationale for the study 17
Changes to study methods from the original protocol 18
Methods 18
Recruitment of general practices 19
Video elicitation interviews and analysis 19
Ethics considerations 20
Results 21
Participant recruitment 21
Video elicitation interviews 21
Questionnaire completion 22
Disconnect between the‘tick and the talk’ 22
Factors that influence patients’reluctance to criticise on the questionnaire 24
Additional interviews with South Asian respondents 26
Discussion 28
Strengths and limitations 29
Conclusions 29
Chapter 3The association between patients’, raters’and general practitioners’
assessments of communication in a consultation 31
Abstract 31
Background 31
Methods 31
Results 31
Conclusions 31
Introduction and rationale for the study 31
Changes to study methods from the original protocol 32
Methods 33
Ratings by trained external raters 33
Statistical analyses 34
Ethics approval 35
Results 35
Reliability of Global Consultation Rating Scale scores 35
The association between patient scores and trained clinical raters’scores 35 The association between general practitioner scores and trained clinical raters’scores 39 The association between general practitioner scores and patient scores 41
Discussion 41
Strengths and limitations 42
Conclusions 43
Chapter 4Ability of patients to see the clinician of their choice 45
Abstract 45
Background 45
Methods 45
Results 45
Conclusions 45
Introduction and rationale for the study 45
Methods 46
Analysis 1 46
Analysis 2 47
Analysis 3 47
Results 48
Analysis 1a: preference for seeing a particular doctor 48
Analysis 1b: ability to see the doctor of the patient’s choice 50 Analysis 2: seeing the clinician of the patient’s choice–changes over time 53 Analysis 3: seeing the clinician of the patient’s choice–association with subsequent rating 53
Conclusions 56
CONTENTS
NIHR Journals Library www.journalslibrary.nihr.ac.uk
Section BUnderstanding patient experience in minority ethnic groups 57
Chapter 5Analyses of GP Patient Survey data to explore variations in patient
experience by ethnic group and practice 59
Abstract 59
Background 59
Methods 59
Results 59
Conclusions 59
Introduction and rationale for the study 59
Structure of the work package 60
Changes to study methods from the original protocol 60
Background to the GP Patient Survey 60
Workstream 1: do poor patient experience scores of minority ethnic groups reflect their
concentration in poorly performing primary care practices? 61
Aims and objectives 61
Methods 61
Results 62
Summary 64
Workstream 2: how does reported general practitioner–patient communication vary
between patients from different ethnic groups, stratified by age and gender? 65
Aims 66
Methods 66
Results 67
Summary 69
Workstream 3: is there evidence that the GP Patient Survey communication items
perform differently for South Asian and white British respondents? 69
Aims and objectives 69
Methods 70
Results 70
Summary 73
Workstream 4: how do practice factors influence general practitioner–patient
communication scores? 73
Aims and objectives 73
Methods 73
Results 76
Summary 78
Overall conclusions 79
Strengths and limitations 80
Implications for practice 80
Chapter 6How do white British and Pakistani patients rate communication during simulated general practitioner–patient consultations? Experimental
vignette study 81
Abstract 81
Background 81
Methods 81
Results 81
Conclusions 81
Introduction and rationale for the study 81
Methods 83
Simulated consultations 83
Data collection 83
Analysis 85
Results 86
Participants 86
Main results 86
Analysis of interactions 86
Discussion 87
Strengths and limitations 88
Implications for practice 91
Section CUsing data on patient experience for quality improvement 93
Chapter 7Attitudes to receiving feedback from patient experience surveys: focus
groups with practice staff 95
Abstract 95
Background 95
Methods 95
Results 95
Conclusions 95
Introduction and rationale 95
Changes to study methods from the original protocol 96
Methods 96
Findings 98
Understanding of, and engagement with, surveys 98
Changes driven by survey feedback 100
Barriers to improvement 102
Discussion 103
Strengths and limitations and implications for future research 103
The Utility Index 103
Implications for practice 106
Conclusions 106
Chapter 8Attitudes to receiving feedback from patient experience surveys:
interviews with general practitioners 107
Abstract 107
Background 107
Methods 107
Results 107
Conclusions 107
Introduction and rationale 107
Changes to study methods from the original protocol 108
Methods 108
Data collection 108
Data analysis 109
Results 109
Dimensions of ambivalence 109
Patients and surveys 109
Patient experience surveys and quality improvement 111
Discussion 114
Implications for practice 114
Conclusions 115
CONTENTS
NIHR Journals Library www.journalslibrary.nihr.ac.uk
Chapter 9Understanding high and low patient experience scores: analysis of
patients’survey data for general practices and individual general practitioners 117
Abstract 117
Background 117
Methods 117
Results 117
Conclusion 117
Introduction and rationale 117
Changes to study methods from the original protocol 118
Methods 118
Questionnaire used in the study 119
Test–retest reliability 119
Analysis 119
Main analysis 119
Analysis of test–retest reliability 120
Results 120
Main results 123
Results of the test–retest reliability analysis 125
Discussion 128
Strengths and limitations 129
Conclusions 129
Chapter 10Exploratory trial of a real-time feedback intervention to improve
patient experience in general practice 131
Abstract 131
Background 131
Methods 131
Results 131
Conclusions 131
Introduction and rationale 131
Review of the evidence on interventions to improve communication skills in primary care 132
Modelling the intervention 135
The level of feedback: practices or individuals? 136
Supported feedback to practices: facilitated or unfacilitated? 137 Timely feedback: the potential of real-time data acquisition and reporting 137
Towards a clinical trial 138
Changes to study methods from the original protocol 138
Aims and objectives 139
Methods 139
Practice sampling and recruitment 139
Staff surveys 139
Practice allocation to intervention groups 140
Description of the real-time feedback intervention 140
Practice feedback reports 143
Facilitated team reflection session 143
Details of data collection 145
Data analysis 148
Results: feasibility study 150
Summary of findings 150
Results: exploratory trial 151
Proportion and characteristics of patients providing real-time feedback 151
Observed patient and staff interactions 154
Real-time feedback and staff attitudes to patient feedback 155
Cost analysis 156
Qualitative evaluation 157
Discussion 165
Strengths and limitations 167
Conclusions 168
Chapter 11The validity and use of patient experience survey data in
out-of-hours care 171
Abstract 171
Background 171
Aims 171
Methods 171
Findings 171
Conclusions 171
Introduction and rationale 171
Defining out-of-hours GP care 171
Ensuring quality and safety of out-of-hours care 172
Role of patient experience surveys in quality assessment 172
Rationale for the out-of-hours research 173
Structure of the out-of-hours work package 173
Stakeholder advisory group 173
Changes to study methods from the original protocol 174
Workstream 1: exploring variations in national GP Patient Survey out-of-hours items 174
Study aims and objectives 174
Methods 175
Results 176
Discussion 179
Workstream 2: establishing the validity of GP Patient Survey out-of-hours items 182
Study aims and objectives 182
Methods 182
Data analysis 184
Results 185
Discussion 187
Workstream 3: exploring how out-of-hours services use patient feedback 189
Study aims and objectives 189
Methods 190
Results 190
Discussion 192
Conclusions from the out-of-hours research 193
Implications for practice and future research 193
Chapter 12Conclusions, implications for practice and recommendations for
future research 197
Conclusions 197
Understanding patient experience data 198
Understanding patient experience in minority ethnic groups 199 Using data on patient experience for quality improvement 201
Implications for practice 203
The importance of patient experience 203
The need for action on the quality of care for minority ethnic groups 203 Patients give overly positive responses when rating their care 203 Surveys are not sufficient to fully capture patient feedback 203 CONTENTS
NIHR Journals Library www.journalslibrary.nihr.ac.uk
The need for valid, reliable individual-level feedback for doctors 203 Patient surveys need to become more meaningful to staff 204
The value of surveys in monitoring national trends 204
Development of surveys in out-of-hours care 204
Recommendations for research 205
Acknowledgements 207
References 223
Appendix 1Global Consultation Rating Scale 243
Appendix 2Chapter 9: patient questionnaire 245
Appendix 3Chapter 9: calculation of reliability 253
Appendix 4Cochrane Central Register of Controlled Trials (CENTRAL)
search strategy 255
Appendix 5Chapter 10: the development of the Value of Patient Feedback scale 261
Appendix 6Chapter 11: supplementary tables 301
Appendix 7Chapters 2and3: practice information sheet 305
Appendix 8Chapters 2and3: general practitioner information sheet 309
Appendix 9Chapters 2and3: general practitioner consent form 313
Appendix 10Chapters 2and3: patient full information sheet 315
Appendix 11Chapters 2and3: patient summary information sheet 321
Appendix 12Chapters 2and3: patient video consent form 323
Appendix 13Chapters 2and3: general practitioner questionnaire 327
Appendix 14Chapters 2and3: patient questionnaire 329
Appendix 15Chapter 2: patient interview information sheet 333
Appendix 16Chapter 2: patient interview consent form 339
Appendix 17Chapter 2: video elicitation interview topic guide 341
Appendix 18Chapter 6: computer-assisted personal interview schedule 345
Appendix 19Chapter 7: participant information sheet 351
Appendix 20Chapter 7: participant consent form 355
Appendix 22Chapter 8: participant information sheet 361
Appendix 23Chapter 8: participant consent form 365
Appendix 24Chapter 8: interview topic guide 367
Appendix 25Chapter 9: practice information sheet 369
Appendix 26Chapter 9: patient information sheet 373
Appendix 27Chapter 10: practice information sheet 379
Appendix 28Chapter 10: practice consent form 383
Appendix 29Chapter 10: practice profile questionnaire 385
Appendix 30Chapter 10: The Value of Patient Feedback scale 391
Appendix 31Chapter 10: structured observation sheets 393
Appendix 32Chapter 10: patient exit surveys 401
Appendix 33Chapter 10: example focus group/interview topic guide 407
Appendix 34Chapter 10: facilitator interview topic guide 413
Appendix 35Chapter 11: provider information sheet 417
Appendix 36Chapter 11: patient survey information sheet 421
Appendix 37Chapter 11: patient questionnaire 425
Appendix 38Chapter 11: patient interview information sheet 433
Appendix 39Chapter 11: patient interview consent form 437
Appendix 40Chapter 11: patient interview topic guide 439
Appendix 41Chapter 11: service provider information sheet 445
Appendix 42Chapter 11: service provider consent form 447
Appendix 43Chapter 11: service provider interview topic guide 449
CONTENTS
NIHR Journals Library www.journalslibrary.nihr.ac.uk
List of tables
TABLE 1 General practitioner–patient communication items used in the patient
experience survey 19
TABLE 2 Location of video elicitation interviews 22
TABLE 3 General practitioner–patient communication items used in the patient
experience survey 33
TABLE 4 Self-reported demographics for patients who completed a questionnaire
and those selected for their consultation to be rated by trained raters 37
TABLE 5 Correlation coefficients/standardised regression coefficients used to examine the association between physician scores and the scores given by the
trained raters and by patients 40
TABLE 6 Questions on choice of doctor as they appear in the GP Patient Survey 46
TABLE 7 Prevalence and ORs for having a preference for seeing a particular doctor 49
TABLE 8 Prevalence and adjusted ORs for seeing a preferred doctor most of the time 51
TABLE 9 Descriptive statistics showing what patients wanted to do last time they
contacted the GP surgery 54
TABLE 10 Association between the type of appointment that patients wanted
and the type of appointment that they actually received 54
TABLE 11 Results of the regression analysis examining the association between nurse–patient communication scores and what patients wanted to do and what
they did do among those who saw a nurse at their last visit to the GP surgery 55
TABLE 12 Results of the regression analysis examining the association between doctor-patient communication scores and what patients wanted to do and what
they did do among those who saw a doctor at their last visit to the GP surgery 55
TABLE 13 General practitioner and nurse communication items for the 2009 GP
Patient Survey 61
TABLE 14 Ethnicity of respondents to the 2009 GP Patient Survey 62
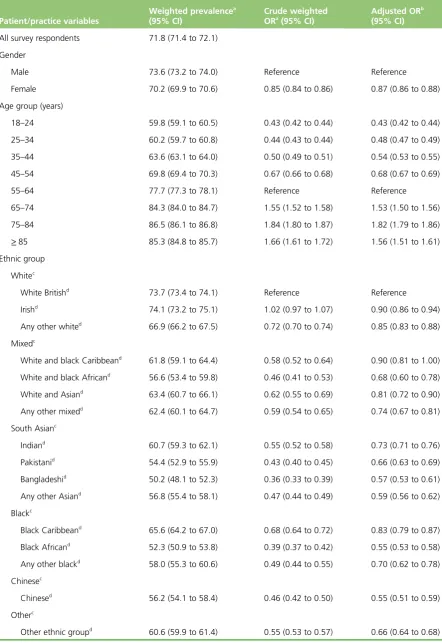
TABLE 15 Sociodemographic differences in reports of GP–patient communication
(scale 0–100) 63
TABLE 16 Sociodemographic differences in reports of nurse–patient
communication (scale 0–100) 64
TABLE 17 Mean ethnic group difference (percentile points) and degree of consistency in ethnic group differences across practices (indicated by the
TABLE 18 Mean ethnic group difference (percentile points) and degree of consistency in ethnic group differences across practices (indicated by the
respective 95% mid range) for nurse–patient communication ratings 65
TABLE 19 General practitioner and nurse communication items for the 2012/13
and 2013/14 GP Patient Surveys 66
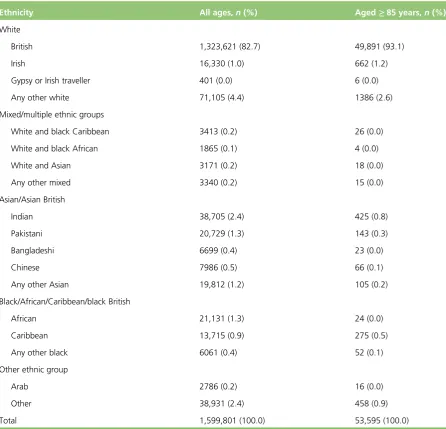
TABLE 20 Ethnicity make-up of the sample for all ages and those aged≥85 years 67
TABLE 21 Estimated item parameters from the graded response model in the full
(n=873,051) and the matched (n=108,968) sample 71
TABLE 22 Regression coefficients for practice predictors 77
TABLE 23 General practitioner communication items used to rate vignettes 85
TABLE 24 Sociodemographic profile of vignette study participants 87
TABLE 25 Description of all video vignettes used showing the number of times
each video was scored 89
TABLE 26 Output from the main regression model adjusting for
sociodemographic characteristics but with no interactions 90
TABLE 27 Adjusted difference in communication scores between white British
and Pakistani participants by age group and good/poor scripted communication 92
TABLE 28 Participating practices and focus group participants 97
TABLE 29 General practitioners’attitudes to patients’motivation and competence 111
TABLE 30 Plausibility of patient experience surveys: limiting factors and
potential solutions 115
TABLE 31 Practice profiles and questionnaire response rates 121
TABLE 32 Demographic profile of patient respondents 121
TABLE 33 Demographic characteristics of the test–retest patient sample by level
of study participation withp-values for tests of variation across the three groups 123
TABLE 34 Percentages of variance in adjusted mean outcome scores that are
attributable to practices, doctors and patients 123
TABLE 35 Number of patient ratings needed to achieve reliability of 0.7 or 0.8
for a doctor’s raw and adjusted mean scores 124
TABLE 36 Sample size, raw agreement (%) and Cohen’s kappa statistic for the
33 categorical items 125
TABLE 37 Sample size, ICC (95% CI), mean test–retest difference (95% CI) and
associatedp-value for the 21 ordinal response items 127
LIST OF TABLES
NIHR Journals Library www.journalslibrary.nihr.ac.uk
TABLE 38 Overview of relevant studies assessing the impact of interpersonal
skills training 133
TABLE 39 The VOP scale 141
TABLE 40 Intervention groups in the exploratory trial phase 141
TABLE 41 Core RTF survey items and response options 144
TABLE 42 Summary of patient exit survey items 147
TABLE 43 Cost analysis: unit costs 149
TABLE 44 Characteristics of participating practices (feasibility phase) 151
TABLE 45 Characteristics of participating practices (by exploratory trial group) 152
TABLE 46 Real-time feedback completion rates for consulting patients
(exploratory trial) 153
TABLE 47 Representativeness of consulting patients who provided RTF 154
TABLE 48 Value of patient feedback scale scores for practice staff: pre and post
intervention broken down by trial arm and staff group 155
TABLE 49 Cost analysis: results 156
TABLE 50 Characteristics of staff who took part in interviews and focus groups 158
TABLE 51 Sociodemographic characteristics of service users contacting an
out-of-hours GP provider (on their own behalf or for someone else) (N=106,513) 176
TABLE 52 Timeliness of care, confidence and trust in out-of-hours clinician and
overall experience of care: raw scores 177
TABLE 53 Associations of out-of-hours GP provider type with timeliness,
confidence and trust and overall experience of care 178
TABLE 54 Overall experience of out-of-hours GP services: linear regression modelling 179
TABLE 55 Timeliness of care from out-of-hours GP services: linear regression
modelling 180
TABLE 56 Confidence and trust in out-of-hours clinician: linear regression modelling 181
TABLE 57 Changes made to GP Patient Survey items evaluating out-of-hours care
following cognitive interviews with service users 183
TABLE 58 The OPQ: 14 items used in analyses 184
TABLE 59 Characteristics of responders and non-responders (N=5067) 186
TABLE 61 Linear regression models showing the associations of OPQ items with
the four modified GP Patient Survey outcomes 188
TABLE 62 Overall contribution to the programme of research 207
TABLE 63 Chapter 2acknowledgements: contributions to the video elicitation
interview workstream 210
TABLE 64 Chapter 3acknowledgements: contributions to the consultation
rating workstream 211
TABLE 65 Chapter 4acknowledgements: contributions to the GP Patient
Survey analyses 212
TABLE 66 Chapter 5acknowledgements: contributions to the GP Patient Survey
analyses on experiences of minority ethnic groups 212
TABLE 67 Chapter 6acknowledgements: contributions to the vignette study 213
TABLE 68 Chapter 7acknowledgements: contributions to the focus group study 214
TABLE 69 Chapter 8acknowledgements: contributions to the GP interview study 215
TABLE 70 Chapter 9acknowledgements: contributions to the patient
survey workstream 216
TABLE 71 Chapter 10acknowledgements: contributions to the RTF exploratory
trial workstream 217
TABLE 72 Chapter 11acknowledgements: contributions to the out-of-hours
workstream 218
TABLE 73 Item pool following initial generation of items 263
TABLE 74 Group distribution for cognitive interviews 265
TABLE 75 Polychoric correlation matrix for all items 268
TABLE 76 Polychoric correlation matrix for all items after reversing negative items 274
TABLE 77 Final set of questions used in exploratory factor analysis 278
TABLE 78 Factor loadings from a four-factor exploratory factor analysis 279
TABLE 79 Content validation of initial pool of items 282
TABLE 80 Comments from expert reviewers 287
TABLE 81 Questionnaire item response distributions 301
TABLE 82 Reliability of the overall satisfaction with out-of-hours care scale
formed from the four modified GP Patient Survey items 304
LIST OF TABLES
NIHR Journals Library www.journalslibrary.nihr.ac.uk
List of figures
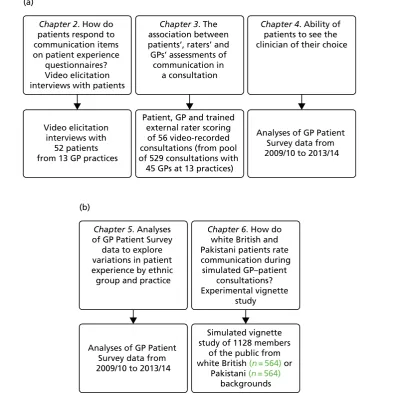
FIGURE 1 The IMPROVE (improving patient experience in primary care)
programme themes and studies contained within workstreams: (a) understanding patient experience data; (b) understanding patient experience in minority ethnic
groups; and (c) using data on patient experience for quality improvement 9
FIGURE 2 Flow of patients through the video elicitation interview
recruitment process 21
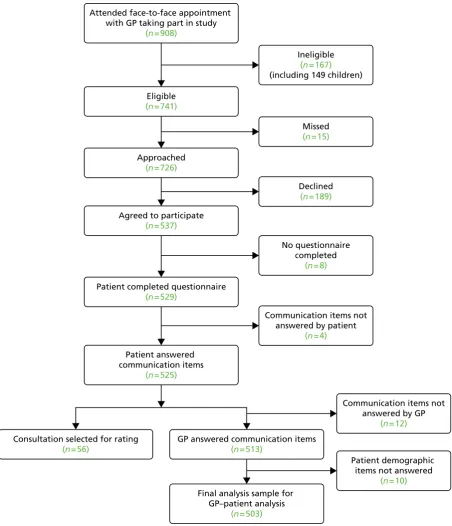
FIGURE 3 Flow chart illustrating the recruitment and participation of patients 36
FIGURE 4 Distribution of (a) patient scores based on GP–patient communication
survey items; and (b) ratings by trained raters on the GCRS 37
FIGURE 5 Scatterplot comparing patient scores based on GP–patient
communication survey items and ratings by trained raters on the GCRS 38
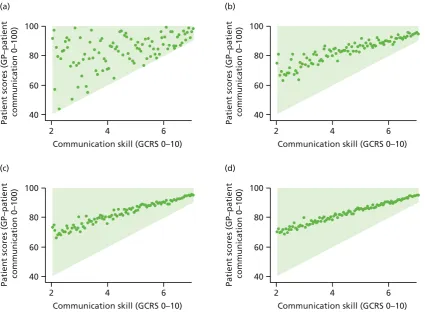
FIGURE 6 Simulated GP–patient communication scores based on different
numbers of patient ratings: (a)n=1; (b)n=10; (c)n=30; and (d)n=100 38
FIGURE 7 Distribution of scores given to consultations by GPs scoring themselves
(a) and (c), raters using the GCRS scale (b) and patients (d) 39
FIGURE 8 Scatterplots illustrating the association between GP scores and (a) trained
rater scores using the GCRS scale (n=55); and (b) patient scores (n=503) 40
FIGURE 9 Percentage of patients able to see or speak to the GP they prefer‘a lot of the time’,‘almost always’or‘always’(of those who say that they have a
particular GP who they prefer to see–data from the GP Patient Survey) 53
FIGURE 10 Age composition of responders according to self-reported ethnicity 68
FIGURE 11 Age- and gender-specific differences with 95% CIs in reported GP–patient communication scores (0–100 scale) between white British patients
and responders in Asian and white (non-British) ethnic groups 69
FIGURE 12 Full sample response curves for patient experience: (a) GP item 1: giving you enough time; (b) GP item 2: listening to you; (c) nurse item 2:
listening to you; and (d) nurse item 4: involving you in care decisions 74
FIGURE 13 Full sample test characteristic curves (TCCs): (a) TCC for GP questions;
and (b) TCC for nurse questions 75
FIGURE 14 Development of the vignettes 84
FIGURE 15 Geographical locations of the census-based output areas from where
participants were recruited: (a) white British participants; and (b) Pakistani participants 88
FIGURE 16 Box plots showing the distribution of GP–patient communication
FIGURE 17 The‘Utility Index’of patient experience surveys in primary care:
perspectives of practice staff 105
FIGURE 18 Mean communication score (best estimate) by practice and doctor 124
FIGURE 19 Mean score for cleanliness of practice building (best estimate) by
practice and doctor 125
FIGURE 20 Typology of GPs’potential responses to communication training 135
FIGURE 21 Overview of the practice pathway (exploratory trial) 142
FIGURE 22 Multimethod approach to data collection 145
FIGURE 23 Normalisation process theory framework: qualitative analysis 150
FIGURE 24 Attendance at RTF set-up sessions by intervention arm, practice and
staff role 157
FIGURE 25 Percentage endorsing each response category for each question (including missing when question not answered rather than page missing),
with‘strongly positive’indicating a view in favour of patient feedback 267
FIGURE 26 Percentage endorsing each response level for each question (including missing when question not answered rather than page missing),
with‘strongly positive’indicating a view in favour of patient feedback 272
FIGURE 27 Scree plot of eigenvalues from exploratory factor analysis 279
LIST OF FIGURES
NIHR Journals Library www.journalslibrary.nihr.ac.uk
List of boxes
BOX 1 Video elicitation interview approach 20
BOX 2 Sample focus group questions 97
BOX 3 Doctors’attitudes to patient experience surveys as quality
improvement tools 113
BOX 4 Interactions and events targeted during structured observation sessions 146
BOX 5 Cost analysis: cost items 149
BOX 6 Planning a future trial of RTF in primary care 169
BOX 7 Proposed final set of questions for the VOP scale 281
BOX 8 Revised items from cognitive interviews in group 1 294
BOX 9 Revised items from cognitive interviews in group 2 295
List of abbreviations
ANOVA analysis of variance
CFI comparative fit index
CI confidence interval
CQC Care Quality Commission
CRT Customer Research Technology
DIF differential item functioning
EQ-5D-3L EuroQol-5 Dimensions three-level
version
GCRS Global Consultation Rating Scale
GMC General Medical Council
GP general practitioner
ICC intraclass correlation coefficient
IMD Index of Multiple Deprivation
IMPROVE improving patient experience in
primary care
IQR interquartile range
NIHR National Institute for Health
Research
NPT normalisation process theory
NQR National Quality Requirement
NRES National Research Ethics Service
ONS Office for National Statistics
OPQ Out-of-hours Patient Questionnaire
OR odds ratio
PCA principal component analysis
PCT primary care trust
PFC patient feedback questionnaire on
consultation skills
PPG Patient Participation Group
PPI patient and public involvement
QOF Quality and Outcomes Framework
RCT randomised controlled trial
RMSEA root-mean-square error of
approximation
RTF real-time feedback
SD standard deviation
SHA strategic health authority
Plain English summary
W
e aimed to gain a better understanding of how patients in general practice use surveys to recordtheir experiences, to understand how staff respond to feedback and to find ways of engaging staff more actively in the process. We did this in a number of ways, including carrying out surveys, having discussions with patients and staff and trying out different ways of gathering patient feedback.
Patients were reluctant to be critical when completing questionnaires after consultations even when they did not think that their care had been very good and they explained their reasons for this. Considering the results of the national GP Patient Survey, we found that the most common reason for dissatisfaction was patients not being able to see a doctor of their choice, something that has got worse in the past few years.
We carried out several studies to understand why minority ethnic groups give low scores on patient surveys. Part of this is because they tend to be registered in practices with low scores. However, our studies also suggest that low scores from South Asian patients reflect poor care rather than, for example, different expectations.
We found that, in both primary and out-of-hours care settings, staff do not trust the results of patient surveys and do not usually make big changes in clinical care as a result of these. We looked for ways of
engaging staff more actively with patient feedback. We tested‘real-time feedback’in which patients use a
touch screen in the waiting room, with staff being provided with results fortnightly. Although patients found this useful, few actually used it unless they were reminded to do so by receptionists.
Scientific summary
T
his programme had seven aims:1. to understand how general practices respond to low patient survey scores
2. to estimate the extent to which practice-level scores mask differences between individual doctors
3. to investigate how patients’ratings on questions in the GP Patient Survey [see https://gp-patient.co.uk
(accessed 23 January 2017)] relate to actual behaviour by general practitioners (GPs) in consultations
4. to understand patients’responses to questions on communication and seeing a doctor of their choice
5. to understand the reasons why minority ethnic groups, especially South Asian respondents, give lower scores on patient surveys than white British respondents
6. to carry out an exploratory randomised controlled trial (RCT) of an intervention to improve patient experience, using tools developed in earlier parts of the programme
7. to investigate how the results of the GP Patient Survey can be used to improve out-of-hours care.
In this report, we group our results under three headings:
1. understanding patient experience data (aims 3 and 4)
2. understanding patient experience in minority ethnic groups (aim 5)
3. using data on patient experience for quality improvement (aims 1, 2, 6 and 7).
We conducted empirical studies in general practices (varying in location, deprivation and performance on patient experience measures) and out-of-hours providers nationally. A total of 47 general practices and 11 out-of-hours providers participated in the programme of work, although some were involved in more than one study. We additionally completed multiple analyses of GP Patient Survey data and, for an experimental vignette study, collected data from the general public.
1. Understanding patient experience data
Patient surveys are widely used in many countries, yet comparatively little is known about what experiences actually lead patients or service users to respond in particular ways when completing them. We approached this issue in two studies in which we (1) used video elicitation interview methods to ask 52 patients directly about how they chose certain questionnaire responses while showing them a video of their consultation and (2) used statistical analyses to compare assessments of videoed consultations by 56 patients with those of expert raters using standardised assessment instruments.
The first study showed that, although patients readily criticised their care when reviewing consultations on video, they described how they had been reluctant to be critical when completing a questionnaire. Reasons for this included the need to maintain a relationship with the GP, gratitude for NHS care that they had received in the past and power asymmetries. We concluded that patients find questionnaires to be limited tools for feeding back concerns about consultations.
The second study reinforced our conclusion from the first study. When trained raters judged communication in a consultation to be good, patients generally did the same. However, when trained raters judged
communication in a consultation to be poor, patients’assessments varied from‘poor’to‘very good’.
We spoke to GPs about their survey results through both focus groups and face-to-face interviews. They reported that, although positive about the concept of patient feedback, they struggled to engage with and make changes under the current approaches to measurement.
A second aspect of care that we identified as being of importance as part of our programme of work
relates to patients’ability to see a doctor of their choice. Our analyses of GP Patient Survey data showed
that for all age groups most patients have a particular GP whom they prefer to see. However, up to 40% of people who have such a preference are unable regularly to see the doctor of their choice. This is a significant quality issue for the NHS.
In out-of-hours care we found that patients reported worse experiences when the service was run by a commercial provider than when it was run by a not-for-profit or NHS provider.
2. Understanding patient experience in minority ethnic groups
Minority ethnic groups provide consistently low scores in English surveys. In this study, our analyses of GP Patient Survey data focused on South Asian respondents and on questionnaires completed in English. Although the GP Patient Survey is available in 15 languages, fewer than 0.2% of surveys are completed in languages other than English. First, we showed that Asian respondents to the GP Patient Survey tend to be registered in practices with generally low scores, explaining about half of the difference between South Asian and white British patients in their experience of care. Then, using item response theory, we found no evidence that South Asian respondents used the scales in a different way from white British respondents.
We then conducted an experimental vignette study for which we filmed 16 simulated consultations based on transcripts of real consultations using various combinations of white and Asian doctors and patients,
half scripted to be‘good’and half scripted to be‘poor’for communication. We showed three randomly
sampled videos to each of 1120 people (half white British, half Pakistani, equally split between those aged
<55 years and those aged≥55 years) and asked them to score the consultation using the communication
items from the GP Patient Survey. If the low scores of Pakistani patients in real-life settings were the result of higher expectations of care, then we would expect them to give lower scores in the experimental vignette situation. In fact, the reverse was observed. When viewing the same consultation, Pakistani respondents gave scores that were much higher when adjusted for sociodemographic characteristics than white British respondents. This suggests that the low scores given by Pakistani patients in surveys such as the GP Patient Survey reflect care that is genuinely worse, and possibly much worse, than that experienced by their white British counterparts.
It is sometimes suggested that survey scores should be adjusted for the ethnicity of the respondents to be able to compare practices with high or low proportions of minority ethnic patients. Our results suggest
that this should not be performed. Rather, low scores from South Asian patients should be taken at‘face
value’and investigated as possible indicators of poor care.
3. Using data on patient experience for quality improvement
We carried out a patient experience survey to explore assessment of care conducted at practice level compared with assessment of care carried out at individual GP level. We used focus groups and interview studies to investigate the views of GPs and practice staff on the survey results. Finally, we carried out a qualitative interview study with out-of-hours staff responsible for collecting and acting on patient feedback to explore the same issues, alongside other work on measuring patient experiences of out-of-hours care.
By conducting a patient experience survey at individual doctor level, we demonstrated that practice-level
ratings of GPs’communication skills can mask considerable variation between GPs within a practice.
SCIENTIFIC SUMMARY
NIHR Journals Library www.journalslibrary.nihr.ac.uk
This is particularly the case in poorer-performing practices in which patients may experience wide variation in communication skills between individual doctors.
Across both settings, staff neither believed nor trusted patient surveys. Concerns were expressed about their validity and reliability and of the likely representativeness of respondents. Staff expressed a preference for free-text comments as they provided more tangible, actionable data. It was easiest for practices to engage with office functions such as appointment systems and telephone answering. Addressing an
individual doctor’s performance (e.g. communication skills) was much more difficult.
In interviews, doctors expressed markedly ambivalent views about surveys. However, despite their concerns about surveys, they expressed broadly positive views about the importance of patient feedback in
monitoring and improving services.
These results led us to consider how patient feedback might be obtained and delivered in a way that would engage doctors to use patient surveys for quality improvement. We conducted a preliminary evaluation of a real-time feedback (RTF)-based intervention in general practice, using touch screens that patients could use to leave feedback following a consultation. As RTF has not been widely used, an exploratory RCT and qualitative study were conducted to answer questions about feasibility, estimate likely response rates, obtain patient and staff views on RTF and estimate the costs to a practice of introducing RTF. We also included facilitated feedback in one arm of the exploratory trial. In our exploratory trial, only 2.5% of consulting patients left any RFT without prompting; however, if encouraged to use RTF by staff, as many as 60% of patients did so. Of patients who used RTF, 86% found it easy to use and were positive about it as a feedback method. Lack of awareness of the screens and lack of time were the commonest reasons for not giving feedback.
Practice staff were broadly positive about using RTF and practices valued the ability to include their own questions in the survey. Practices that had open communication between staff members tended to be more positive about using patient feedback. Practice staff identified clear benefits from having a facilitated session for discussion of patient feedback and having protected time to discuss the results.
Our programme of work was supported by two study advisory groups consisting of lay members and health-care professionals. One was based in Cambridge and provided support across all streams of work except for the out-of-hours research; the other was based in Exeter and was convened specifically to provide input to the out-of-hours workstreams.
Implications for practice
The work that we have carried out over the 5 years of the programme grant has clear implications for practice.
The importance of patient experience
Our research supports the continuing emphasis on obtaining patient experience feedback as an important means of informing NHS care. Although continuing efforts should be invested in refining the most effective and meaningful mechanism to capture patient feedback, the key challenge remains to provide primary care staff with the support and means to enable them to act on patient feedback.
The need for action on the quality of care for minority ethnic groups
There has been much speculation whether the lower survey scores reported by minority ethnic groups are
‘real’, reflecting poorer quality of care, or an artefact of the questionnaires used or higher expectations of
Patients give overly positive responses when rating their care
Our results highlight the difficulty that patients have in feeding back negative experiences in questionnaire
surveys. However, patients’reluctance to criticise a doctor or provider with whom they have to maintain an
ongoing relationship will not be addressed simply by changing the survey method. Providers and managers
need to understand that absolute scores paint an optimistic picture of patients’true views.
Surveys are not sufficient to fully capture patient feedback
Across primary and out-of-hours care settings, staff members view patient surveys as necessary but not sufficient. Alternative methods for gaining more qualitative feedback were commonly used to supplement survey scores, with free text viewed as providing more actionable data than responses to standard survey questions.
The need for individual-level feedback for doctors
Reporting patient experience at the practice level masks substantial variation in performance within
practices for aspects of care related to individual doctors (e.g. doctor–patient communication). However,
if a practice has an overall high score for doctor–patient communication, it is unlikely that it contains a
low-scoring doctor. Robust mechanisms are needed to help lower-scoring practices identify and support doctors whose individual patient feedback identifies areas for potential improvement.
Patient surveys need to become more meaningful to staff
Practices found it easier to engage with items on surveys that related to practice management (e.g. availability of appointments, ability to get through on the telephone) than to issues around communication between patients and clinical staff. Effort should be invested to focus the attention of staff on the whole range of feedback provided by service users and on making available suitable support and learning opportunities to act on such feedback.
Immediacy of feedback, regularity of feedback and having some control over the questions asked were all aspects of our experiment with RTF that were valued by practices and had the potential to make feedback more useful. However, a number of important questions remain before RTF could be recommended as a replacement for postal questionnaires.
The value of surveys in monitoring national trends
Despite their limited value in stimulating quality improvement, surveys are important for monitoring national trends. For example, the GP Patient Survey is the only source of data which demonstrates that, year on year, from 2010 to 2015, patients have had increasing difficulty in terms of seeing a doctor of their choice. For out-of-hours services the GP Patient Survey is the only way of monitoring trends. However, when national surveys are used to monitor trends in care it is important that the questions (such as questions on access in the GP Patient Survey) do not keep changing. Much smaller sample sizes are required to monitor national trends: tens of thousands of participants rather than millions.
Development of surveys in out-of-hours care
Out-of-hours services are required to audit patient experience but are provided with no information on how to do this, leading to diverse and non-comparable data. Our work shows that, subject to minor
amendments, the GP Patient Surveyissuitable for the national monitoring of out-of-hours care. However,
it is not sufficiently detailed to support quality improvement and is unlikely at present to replace in-house approaches, leading to duplication of effort.
Concluding remarks
Large-scale postal surveys are likely to remain the dominant approach for gathering patient feedback for the time being, although a range of other methods are being developed. These include RTF, focus groups, online feedback, analyses of complaints, practice participation groups and social media. In the final section
SCIENTIFIC SUMMARY
NIHR Journals Library www.journalslibrary.nihr.ac.uk
of our report we outline recommendations for research and identify the criteria that any new methods will need to meet to become useful quality improvement tools.
Future work recommendations
Alternative feedback methods to better support patients to identify poor care should be considered. Investigation into the factors driving poorer experience of communication in South Asian patient groups; further investigation of how best to deliver patient feedback to clinicians to engage them and foster quality improvement; and further research to support the development and implementation of interventions aiming to improve care when deficiencies in patient experience of care are identified are recommended as areas for future work.
Funding
Chapter 1
Introduction to the IMPROVE
(improving patient experience in primary care)
programme
Context
Improving the health status of individuals and populations is a central ambition of health-care systems in high-income countries, and the US Institute of Medicine has suggested that high-quality health-care
delivery should be safe, effective, patient-centred, timely, efficient and equitable.1Berwicket al.2have
noted the importance of patient experience of care as one of the suggested‘triple aims’of an advanced
health-care system. A recent US report highlighted the important contribution that listening to, and acting
on, patient feedback can potentially make to health-care improvement efforts.3
New developments within the English NHS highlight the embedding of public performance assessment
within the regulation of the health-care system, including NHS England’s consultation on the production
of general practitioner (GP) league tables4and the Care Quality Commission’s (CQC) parallel development of
a rating system for primary care.5A transparent health-care system is regarded by policy-makers as essential
to enable patients to make informed choices about the care that they receive6and patient feedback on
health-care services is now commonly gathered in the USA, Canada, Europe, Australia and China.
Efforts to improve quality of care in the NHS over the last 15 years have focused on providing prompt access to care (e.g. the time taken to see a GP or hospital waiting times) and on providing evidence-based clinical care [e.g. through the development of National Service Frameworks and the UK Quality and Outcomes Framework
(QOF)7]. A direct link between patient feedback and quality improvement efforts was previously operationalised
by including results arising from patient surveys as a component of the QOF.7This performance management
system provides financial incentives for GPs within the NHS to achieve agreed quality indicators covering areas including chronic disease management, practice organisation and additional services offered. With the introduction of the QOF it was possible, for the first time, to rank all practices according to their patient feedback and the results of surveys, aggregated at practice level, formed the basis of a pay-for-performance scheme between 2009 and 2011, when the UK government withdrew the pay-for-performance arrangements for patient experience.
Some of these policies have been highly effective. For example, associated with a wide range of quality improvement initiatives over a decade, there have been greater improvements in the UK for the clinical care
of conditions such as heart disease and diabetes than in any other major developed country.8Although
relatively neglected in the early years of the millennium, patient experience of health care is now a high policy priority, and in 2008 the Next Stage Review suggested that:
. . . quality of care includes quality of caring. This means how personal care is–the compassion, dignity and respect with which patients are treated. It can only be improved by analysing and understanding patient’s satisfaction with their own experiences.
Department of Health, p. 47, emphasis in original.9© Crown copyright 2008, contains public sector
information licensed under the Open Government Licence v3.0
The review9noted, however, that‘[up until 2008] progress has been patchy, particularly on patient experience’
(p. 48) and announced the development of quality accounts for all NHS organisations in which‘healthcare
providers will be required to publish data . . . looking at safety, patient experience, and outcome’(p. 51)
Since 2008, therefore, there has been a major policy initiative to improve patient experience in the NHS. Most recently, the focus on patient experience has been enshrined in the NHS Outcomes Framework,
which, in Domain 4, focuses on ensuring that‘patients have a positive experience of care’10(contains
public sector information licensed under the Open Government Licence v3.0). In primary care, these policy initiatives and statements have been implemented primarily through the development and conduct of the
GP Patient Survey,11first sent to 5.6 million patients in January 2009. The large sample size was intended
to provide sufficient responses to characterise patient experience of primary care in all 8300 general practices in England. Detailed responses for individual practices were published on the NHS Choices
website12and made available online and included information on access to GP services and interpersonal
aspects of care, out-of-hours care and care planning. The questionnaire specifically included validated questions about interpersonal aspects of care based on questionnaires that the authors of the present
report previously designed and on which we have previously reported.13This large-scale survey is, of course,
an expensive undertaking and its utility and impact need to be commensurable with this investment.
In seeking to achieve improvement in the quality of NHS services, gathering data is important both to inform the process of service development and innovation and to assess the impact of such changes in practice. It has been suggested that data to support such improvement initiatives need to be of sufficient quality to assess whether or not an innovation can be made to work, rather than being the more rigorous
level of research data needed to assess whether or not an innovation works.14
Communication in the consultation has always been an important part of primary care and is closely linked to continuity of care. At the outset of this research, there had been many anecdotal accounts that GPs were more focused on meeting clinical targets identified on their computer screens than on the needs of the patient sitting in front of them. It seemed therefore an appropriate time to balance the focus on improving clinical care with a renewed focus on interpersonal care and communication in the consultation. The ability of patients to choose their own doctor is also important. Our research prior to commencing this programme showed that continuity of care had deteriorated since the introduction of the new GP contract
in 200415and previous research had also highlighted that patients were less likely to report overall positive
experiences if they were not able to choose a doctor whom they know.16,17
Experience and satisfaction
Previous research has identified considerable confusion and overlap relating to the concepts of patient experience and satisfaction. The two concepts are closely linked, although at a simple level reports of experience relate to recounting or commenting on what actually happened during the course of a clinical
encounter whereas reports of satisfaction focus on the patient’s or carer’s subjective evaluation of the
encounter (i.e. asking for‘ratings’of care rather than simple‘reports’of care). Individual items in a survey
may thus examine patients’reports of their experience of care, whereas other items may explore patients’
evaluation of that care, with the linkage between report and evaluation/rating item pairs offering potential
for the development of cut points in scales of performance.18In practice, however, the terms are often
used interchangeably and survey items designed as report items often have an evaluative component; for
example, the question‘Were you involved as much as you wanted to be in decisions about your care and
treatment?’from the NHS Inpatient Survey19contains elements of both. Within the GP Patient Survey,11the
instrument behind much of this programme of work, items often relate to ratings of care. For example,
the communication questions ask patients to consider‘how good’the doctor was at providing various
elements during a consultation, including giving enough time, involving in decisions about care and treating with care and concern.
Patient satisfaction may be seen as a multidimensional construct, focusing on the subjective experiences of
patients, and related to their expectations of care and the perceived technical quality of the care provided.20
Russell21has recently summarised some of the problems associated with surveys of patient satisfaction with
care, including problems with the validity and reliability of satisfaction survey instruments, the lack of a INTRODUCTION TO THE IMPROVE (IMPROVING PATIENT EXPERIENCE IN PRIMARY CARE) PROGRAMME
NIHR Journals Library www.journalslibrary.nihr.ac.uk