Article
1
Bayesian Count Data Modeling for Finding
2
Technological Sustainability
3
Sunghae Jun 1,*
4
1 Department of Big Data and Statistics, Cheongju University, Chungbuk, 28503, Korea
5
* Correspondence: [email protected]; Tel.: +82-10-7745-5677
6
7
8
Abstract: Technology development changes society and society demands new and innovative
9
technology development. We analyze technology to understand society and technology itself. Many
10
researches have been introduced in various fields. Most of them were about patent analysis. This is
11
because detailed and accurate results of research and development are patented. In this paper, we
12
study on new patent analysis method based on count data model and Bayesian regression analysis.
13
Using count data model, we analyze the technological keywords extracted from the collected patent
14
documents. We use the posterior distribution of Bayesian statistics to reflect the experience and
15
knowledge of the relevant technological experts in the analysis model. Moreover, we apply the
16
proposed model to finding sustainable technologies. Finding and developing sustainable
17
technologies is an important activity for companies and research institutes to maintain their
18
technological competitiveness. To illustrate how our modeling could be applied to real domain, we
19
carry out a case study using the patent documents related to artificial intelligence.
20
Keywords: count data; Bayesian regression; technological sustainability; Poisson probability
21
distribution; patent analysis
22
23
1. Introduction
24
Technology with sustainability is to keep technological Competitiveness of company [1-2]. Most
25
companies have tried to find their sustainable areas for technological innovation and new product
26
development. So, sustainable technology is important issue in management of technology (MOT) [3].
27
Many academics, research institutes, and companies have studied on sustainable technologies.
28
Recently, Kim et al. (2018) published a statistical method for sustainable technology analysis [4]. They
29
considered Bayesian inference and social network analysis for the proposed method, applied their
30
research to the technology domain related to artificial intelligence (AI). Also, they used the IPC
31
(international patent classification) codes extracted from patent documents as input data for
32
sustainable technology analysis. The IPC is a hierarchical system of technologies for the classification
33
of patents [5]. For example, the IPC code G06F represents the electric digital data processing
34
technology [6]. In general, IPC codes cover a wide range of technologies. So, it is difficult for us to
35
grasp the detailed technological structure of a specific technology field. In order to overcome this
36
problem, we propose a technology analysis method using patent keywords. The keywords are
37
extracted from patent documents related to specific technology by text mining techniques [7].
38
Therefore, the technology keyword can represent more detailed description of a specific technology
39
field than the IPC code for sustainable technology analysis. In addition, we propose a statistical
40
modeling using Bayesian count data analysis for understanding sustainability of given technology
41
domain. The count of event is the number of times an event occurs [8]. In this paper, each patent
42
keyword is an event, and we analyze the count data of patent keywords. We consider the Poisson
43
probability distribution for the proposed statistical patent analysis model, because the count data of
44
patent keywords are nonnegative integer values [9]. We also combine the Poisson count model with
45
Bayesian regression analysis to build Bayesian count data modeling for finding technological
46
sustainability. We use the prior probability distribution to reflect the experience and knowledge of
47
the relevant technology experts in the model. The collected patent data is represented by the
48
likelihood function. We get the posterior distribution by multiplying prior distribution and likelihood
49
function. Finally, these Bayesian probability distributions are applied to the count data regression for
50
Bayesian count data model. Therefore, we carry out the Bayesian count data modeling to find
51
technological sustainability. To show the validity of our modeling, we perform a case study using the
52
patent documents related to AI. The remainder of this paper is organized as follows. In section 2, we
53
show the research backgrounds related to our study. We explain the proposed modeling for finding
54
technological sustainability in section 3. Next section illustrates the result of our case study. In the
55
conclusions section, we conclude our research and describe our future works related to this paper.
56
2. Sustainable Technology and Patent Analysis
57
In this paper, sustainable technology means a technology that can sustain a company's
58
technological competitiveness. So, it is important for a company to know what its sustainable
59
technologies are. In the MOT field, many companies and institutes have tried to find their sustainable
60
technologies. Many research results on sustainable technology analysis have been published in
61
academia [1-2,4,10-11]. The sustainable technology analysis has been made using diverse analytical
62
methods in various technological fields. However, research on this field is still lacking. Companies
63
and research institutions are demanding a more sophisticated and feasible methodologies for
64
sustainable technology analysis.
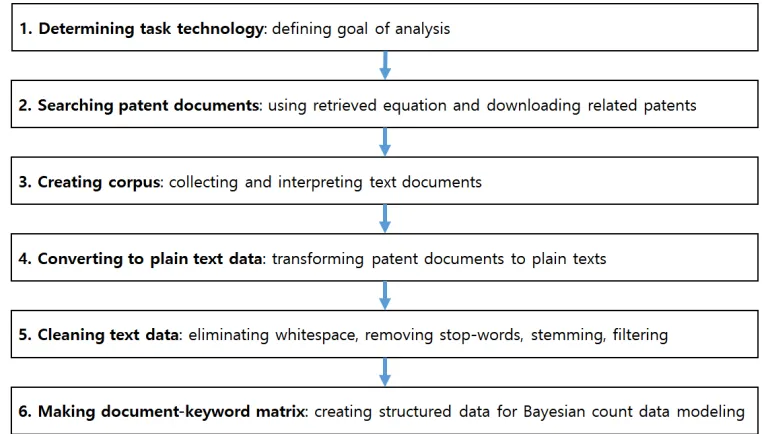
65
Most methods for sustainable technology analysis rely on patent analysis. This is because patents
66
contain accurate and vast results on the research and development of technology. This is due to the
67
exclusive right to use the technology granted to the inventor. Thus, a great deal of research has been
68
done on patent analysis [12-16]. In patent analysis, we should transform the collected patent
69
documents into structured data consisting of keywords, IPC codes, citations, etc. for statistical
70
analysis. In the preprocessing process of patent data, we use R data language and its ‘tm’ package
71
[7,17]. Using the structured patent data, we perform the proposed modeling for finding technological
72
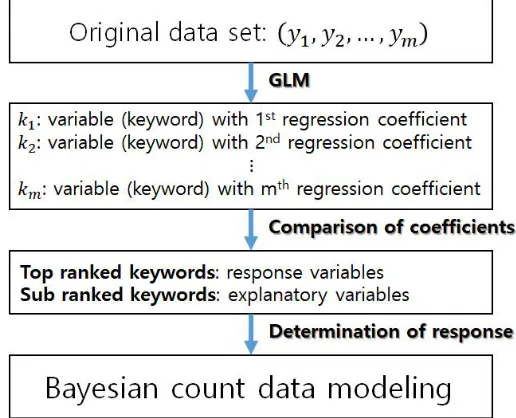
sustainability.
73
3. Finding Technological Sustainability using Bayesian Count Data Modeling
74
Bayesian modeling has been used in diverse data analysis areas such as regression and
75
classification increasingly. This is one of two approaches to statistics. We start the Bayesian count
76
data modeling from the following expression [18].
77
78
P(θ|y) = y θ ( )
( ) (1)
79
80
Where θ is model parameter, and y is response variable to be predicted. P(θ) and P(θ|y) are
81
the prior and posterior probabilities of parameter θ respectively. P(y|θ) represents the likelihood
82
function of y given θ respectively. Also, P(y) is calculated by the following integration [19].
83
84
P(y) = ∫ P(y|θ)P(θ)dθ (2)
85
86
Using Bayesian modeling, we determine the model parameter of posterior distribution and
87
compute the credible interval of true parameter. We are interested in the mean of the parameters in
88
this credible interval. The 100(1-)% credible interval of θ is defined as follow [19].
89
90
P(θ ∈ C) = 1 − α (3)
91
92
Where C is an interval depended on y. In addition, the credible interval of Bayesian modeling is
93
modeling. Non-informative or informative priors can be used for the prior distribution in Bayesian
95
modeling. In general, the result of non-informative prior is close to the maximum likelihood estimate
96
(MLE) in frequentist statistics, because the popular non-informative prior is uniform distribution
97
[9,19]. On the other hand, we should use the informative prior to get amend result for the parameter
98
estimation. But, we should carry out Bayesian computing such as Markov Chain Monte Carlo
99
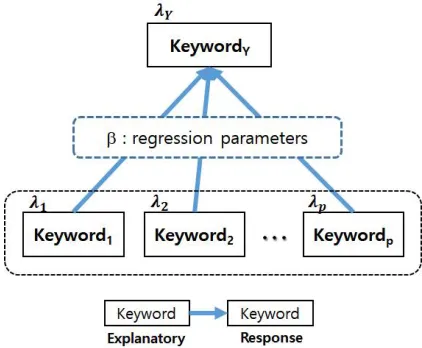
(MCMC) for using the informative prior [19]. To alleviate the computational burden, we can use
100
conjugate prior. In Bayesian count data modeling, the gamma and beta distributions are conjugate to
101
the Poisson and binomial distributions respectively. In our research, we consider a Bayesian count
102
data modeling with Poisson distribution for finding technological sustainability. The Poisson
103
probability distribution is the most popular model for count data. If the random variable Y is
104
distributed to Poisson with parameter , its distribution is defined as follow [9]; Y~Poisson(λ).
105
106
P(Y = y|λ) =
! , y = 0,1,2, … (4)
107
108
Where the expectation E(Y) and variance of Y are equal to parameter λ. In this paper, the
109
frequency of each patent keyword extracted from patent document data is a Poisson random variable
110
with parameter as follow.
111
112
~ ( ), i = 1,2, … , m (5)
113
114
Where m is the number of all keywords. We extract the patent keywords from the collected
115
patent documents using text mining techniques as follow.
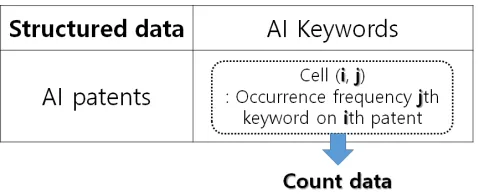
116
117
118
Figure 1. Text mining process for creating structure data for Bayesian count data modeling.
119
120
In our text mining process, first of all we should determine the target technology for statistical
121
analysis. Next, we use a retrieved equation to collect the patent documents related to target
122
technology from the patent databases in the world. It is impossible to analyze the searched patent
123
document data directly, because the data is not suitable to input data for statistical analysis including
124
Bayesian count data modeling. So, we try to make a structured data for statistical analysis. The first
125
step in creating structured data is to create corpus collecting and interpreting text documents. Based
126
on the created corpus, we transform the patent documents into plain texts, and clean the text data by
127
eliminating whitespace, removing step-words (“and”, “for”, ”in”, “is”, etc. ), stemming, and filtering.
128
modeling. The matrix consists of patent (row) and keyword (column), and its elements are the
130
frequency (count) values of occurred keywords in each patent document.
131
In our modeling, we define the frequency (count) of ith occurred keyword as , and represent
132
the data set as follow [9].
133
134
~ ( ), E( ) = Var( ) = , i = 1,2, … , m (6)
135
136
Using this data set, we perform the generalized linear model (GLM) with Poisson probability
137
distribution, no predictors, and log link function as follow.
138
139
log( ) = or = exp ( ), i = 1,2, … , m (7)
140
141
We determine the response and predictor variables (keywords) by the results of GLM. In our
142
study, we use variables with large coefficient values as response variables and those with small
143
coefficient values as explanatory variables.
144
145
146
Figure 2. Determination of response variable by GLM results.
147
148
In this paper, we denote the response variable as Y, and the explanatory variables as
149
, , … , . Where p is the number of explanatory variables. For Bayesian count data modeling,
150
we make the Poisson regression model with gamma distribution as prior. The Poisson regression
151
model with λ is defined as follow [20].
152
153
f(Y|λ) = exp(− + log( ) − ∑ log ( !)) (8)
154
155
Where n is the number of collected patent documents. Also, an informative gamma prior for λ
156
as follow.
157
158
P(λ) =
( ) (9)
159
160
Where Γ(∙) is gamma function, and E(λ) and Var(λ) are and respectively. This
161
expression is used for the likelihood in the Bayesian count data modeling. So, using the likelihood
162
and prior distributions, we show the posterior distribution as follow.
163
P(λ|Y) = exp(− + log − ∑ log !) ×
( ) (10)
165
166
We can ignore the terms not involving , so we yield the proportional result of posterior
167
distribution as follow.
168
169
P(λ|Y) ∝ (−( + ) + ( + − 1)log ) (11)
170
171
This expression represents the kernel of the gamma distribution with parameters (n + b) and
172
(n + ). In addition, by the characteristic of gamma distribution, the posterior mean and variance
173
of are and ( ) respectively. In Bayesian Poisson regression case, | is distributed
174
Poisson with mean = exp( ′ ), where is the parameter vector of Poisson regression. In our
175
research, (Y|x) is shown as (response keyword | explanatory keywords). Therefore, we get the
176
Bayesian count data modeling as follow.
177
178
| ~ ( ) (12)
179
180
= ( ′ ) + , ~ (0, ) (13)
181
182
P(β): Gamma prior density of β (14)
183
184
Using this modeling, we make a technology structure to understand the target technology from
185
the viewpoint of sustainability in Figure 3.
186
187
188
Figure 3. Technology structure of Bayesian count data modeling.
189
190
In our modeling, all keywords except response are used as explanatory keywords. In Figure 3,
191
the keyword at the beginning of the arrow indicates the explanatory variable, and the keyword at the
192
end of the arrow indicates the response variable. Also, each keyword is distributed to Poisson with
193
parameter . From the final result of Bayesian count data modeling, we get the regression
194
coefficients between response and explanatory variables (keywords). Using the , we build a
195
technological structure of target domain for sustainable technology management. Therefore, the
196
Bayesian count data modeling is based on the following concept.
197
198
Figure 4. Concept of Bayesian count data modeling.
200
201
In this paper, we try to combine the expert’s subjective knowledge and objective result from
202
patent data analysis. That is, the prior represents the domain knowledge of experts, and the likelihood
203
denotes the objective data based on patent documents. The result of multiplying prior and likelihood
204
is posterior, we use this as predictive model for finding technological sustainability.
205
Using this approach, we expect the improved performance of patent technology analysis for
206
sustainable technology. We illustrate how this research could be applied to practical problem by a
207
case study in next section.
208
4. Case Study
209
To show how this research could be applied to practical problem, we performed a case study
210
using the patent documents related to artificial intelligence (AI) technology. We collected the patents
211
applied and registered by 2016 from the WIPSON [21]. The total number of collected and valid
212
patents was 11,973 cases. First of all, we consulted the experts on AI and extracted the keywords
213
related to AI from the collected patent document data [22]. Next, using the text mining techniques,
214
we built structured patent data for performing our case study [7,17]. Our structured patent data is
215
shown in Figure 5.
216
217
218
Figure 5. Structured patent data.
219
The row and column of this data matrix are patents and keywords related to AI, and each cell of
220
this matrix represents occurrence frequency of each keyword on a patent. Based on the structured
221
data, we classified the AI technology as follow.
222
223
Table 1. Hierarchical structure of AI technology
224
Sub-technology Patent keywords
Learning Learning, inference, ontology, representation, analysis, data Behavior Behavior, awareness, situation, sentiment, mind, spatial, collaborative
Language Language, natural, understanding, morphological, dialogue, sentence, corpus, voice, speech, conversation, interface
Vision Vision, figure, object, video, image
Neuro Neuro, network, computing, feedback, pattern, recognition, cognitive
225
In Table 1, we denoted the AI technology to five sub-technologies as follow; learning, behavior,
226
language, vision, and neuro. In addition, we have shown the patent keywords belonging to each
sub-227
technology. We used this technology tree to retrieve the AI patents and analyze them. First, we
228
estimated the Poisson parameters for the patent keywords using maximum likelihood estimator
229
(MLE) by the frequency values of the keywords. Table 2 shows the estimates of Poisson parameters
230
for all patent keywords.
231
Table 2. Estimates of Poisson parameters for all keywords
233
Keyword Keyword Keyword
analysis awareness
behavior cognitive collaborative
computing conversation
corpus data dialogue feedback figure
0.0287 0.0008 0.0258 0.0001 0.0001 0.0010 0.0035 0.0123 0.8316 0.0009 0.0287 0.0007
image inference
interface language learning
mind morphological
natural network
neuro object ontology
0.2745 0.0019 0.0170 0.0426 0.0058 0.0004 0.0004 0.0011 0.2668 0.0014 1.3510 0.0044
pattern recognition representation
sentence sentiment
situation spatial speech understanding
video vision voice
0.1506 0.0211 0.0062 0.0103 0.0016 0.0060 0.0966 0.5527 0.0005 0.5114 0.0123 0.0153
234
We can compare the relative frequency between the patent keywords in Table 2. These estimates
235
are the MLE (maximum likelihood estimate) for Poisson parameters of AI keywords [18]. Figure 6
236
illustrates the MLEs for the Poisson parameters of all patent keywords.
237
238
239
Figure 6. MLEs of all patent keywords.
240
241
In this figure, we found the MLEs of ‘object’, ‘data’, ‘speech’, ‘video’, ‘image’, ‘network’, ‘pattern’,
242
‘spatial’, ‘language’, ‘analysis’, feedback’, ‘behavior’, ‘recognition’, ‘interface’, ‘voice’, ‘corpus’,
243
‘vision’, and ‘learning’ are relatively larger than other keywords. Using the result of Figure 6, we
244
determine the patent keywords that affect AI technology. A keyword with a larger MLE value will
245
have more impact on AI technology. We also carried out the Bayesian count data modeling on the
246
248
Table 3. Model parameters and weight
249
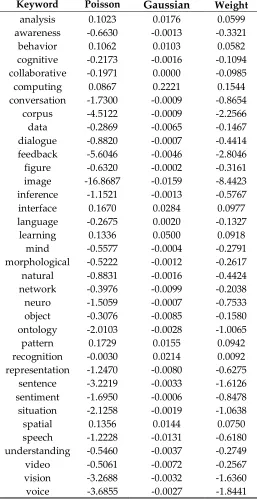
Keyword Poisson Gaussian Weight
analysis awareness behavior cognitive collaborative computing conversation corpus data dialogue feedback figure image inference interface language learning mind morphological natural network neuro object ontology pattern recognition representation sentence sentiment situation spatial speech understanding video vision voice 0.1023 -0.6630 0.1062 -0.2173 -0.1971 0.0867 -1.7300 -4.5122 -0.2869 -0.8820 -5.6046 -0.6320 -16.8687 -1.1521 0.1670 -0.2675 0.1336 -0.5577 -0.5222 -0.8831 -0.3976 -1.5059 -0.3076 -2.0103 0.1729 -0.0030 -1.2470 -3.2219 -1.6950 -2.1258 0.1356 -1.2228 -0.5460 -0.5061 -3.2688 -3.6855 0.0176 -0.0013 0.0103 -0.0016 0.0000 0.2221 -0.0009 -0.0009 -0.0065 -0.0007 -0.0046 -0.0002 -0.0159 -0.0013 0.0284 0.0020 0.0500 -0.0004 -0.0012 -0.0016 -0.0099 -0.0007 -0.0085 -0.0028 0.0155 0.0214 -0.0080 -0.0033 -0.0006 -0.0019 0.0144 -0.0131 -0.0037 -0.0072 -0.0032 -0.0027 0.0599 -0.3321 0.0582 -0.1094 -0.0985 0.1544 -0.8654 -2.2566 -0.1467 -0.4414 -2.8046 -0.3161 -8.4423 -0.5767 0.0977 -0.1327 0.0918 -0.2791 -0.2617 -0.4424 -0.2038 -0.7533 -0.1580 -1.0065 0.0942 0.0092 -0.6275 -1.6126 -0.8478 -1.0638 0.0750 -0.6180 -0.2749 -0.2567 -1.6360 -1.8441
250
We performed the Bayesian regression models by Gaussian as well as Poisson distributions. In
251
addition, the weight in Table 3 is the average value of Poisson and Gaussian parameters. In this paper,
252
we selected the keywords with larger weight values for finding technological sustainability in AI
253
technology. Using the result of Table 3, we show the patent keyword ranking that influences AI
254
technology in Figure 7.
255
257
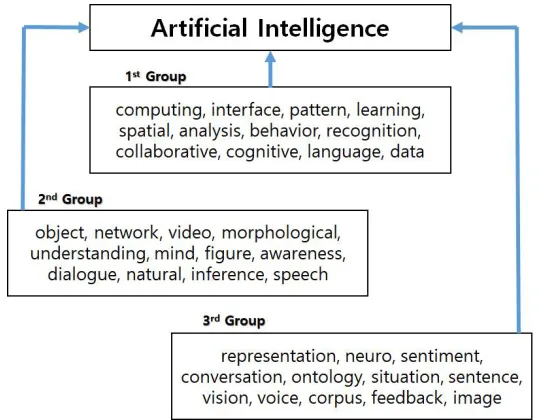
Figure 7. Patent keyword ranking that influences artificial intelligence.
258
259
The keywords in 1st Group have a greater impact on AI technology than 2nd Group or 3rd Group.
260
Using the experimental results of this paper, we made the following technological structure for
261
sustainable AI technology.
262
263
264
Figure 8. Technological structure for sustainable AI.
265
266
In this paper, we divided the AI technology into five sub-technologies (learning, behavior,
267
language, vision, neuro) in Table 1. In Figure 8, each sub-technology contains the keywords that can
268
represent its technology. For example, the keywords of learning, inference, ontology, representation,
269
analysis, and data describe the learning technology for AI. Each keyword is represented by bold or
270
underlined types depending on its importance from the results of Tables 2 and 3. The keywords in
271
bold type are those that have an impact to AI technology from the results of Poisson MLEs. Also, the
272
keywords with underlined lettering affect the AI technology by the Bayesian regression model. So,
273
we knew that the sub-technologies related to learning, behavior, language, and neuro influence to
274
the sustainability of AI technology. But we found that the sub-technology of vision has a relatively
275
small effect on the technological sustainability of AI compared to other sub-technologies. In this
276
interface’, and ‘recognition pattern’ are important things to continue the sustainability for AI
278
technology.
279
5. Conclusions
280
We proposed Bayesian count data modeling to find the technological sustainability. To know
281
the sustainable technology in given technological field is very important to improve the technological
282
competition of company and nation. Various researches have been conducted to find sustainable
283
technologies. Most of them carried out the statistical models not consider the characteristic of count
284
data from patent documents. But, most structured patent data have a count data structure. In order
285
to solve this discrepancy problem, Bayesian count data modeling is proposed in this study. In
286
addition, we applied the domain knowledge of experts to prior distribution of model parameter in
287
Bayesian regression model. To show the validity of proposed modeling and illustrate how our
288
approach could be applied to practical problem, we carried out a case study using the patent
289
documents related to AI technology. In the case study, we found the sub-technologies for the
290
sustainable technologies of AI. They were learning from data, spatial behavior, interface of language,
291
and pattern recognition technologies. Therefore, we should concentrate our research and
292
development on these sub-technologies to keep the sustainability of AI technology.
293
Our research can be applied to the research and development-related planning of companies
294
and research institutes. Also, this research will contribute to diverse technological fields as well as
295
AL technology. In this research, we considered only the patent keywords extracted from patent
296
documents for patent technology analysis using statistical modeling. Our future work will use more
297
diverse elements, as well as keywords, such as citations and claims, to find sustainable technologies
298
for specific technological domain.
299
300
Author Contributions: Sunghae Jun designed this study and collected the data for the experiment. He also
301
preprocessed the data and selected valid patents and analyzed the data to show the validity of the study and
302
wrote the paper and performed all the research steps.
303
Conflicts of Interest: The authors declare no conflict of interest.
304
305
References
306
1. Park, S.; Jun, S. Statistical Technology Analysis for Competitive Sustainability of Three Dimensional Printing.
307
Sustain. 2017, 9, 1142.
308
2. Choi, J.; Jun, S.; Park, S. A patent analysis for sustainable technology management. Sustain. 2016, 8, 1–13.
309
3. Roper, A.T.; Cunningham, S.W.; Porter, A.L.; Mason, T.W.; Rossini, F.A; Banks, Forecasting and Management
310
of Technology; John Wiley & Sons: Hoboken, NJ, USA, 2011.
311
4. Kim, J; Jun, S,; Jang, D.; Park, S. Sustainable Technology Analysis of Artificial Intelligence Using Bayesian
312
and Social Network Models. Sustain. 2018, 10, 115.
313
5. WIPO. World Intellectual Property Organization. Available online: www.wipo.org (accessed 2018).
314
6. WIPO IPC. International Patent Classification (IPC), World Intellectual Property Organization. Available
315
online: http://www.wipo.int/classifications/ipc/en (accessed 2018).
316
7. Feinerer, I.; Hornik, K. Package ‘tm’ Ver. 0.7-5, Text Mining Package, CRAN of R Project. 2018. Available
317
online: https://cran.r-project.org/web/packages/tm/tm.pdf (accessed on 1 August 2018).
318
8. Hilbe, J. M.; Modeling Count Data, Cambridge University Press: Cambridge, UK, 2014.
319
9. Cameron, A. C.; Trivedi, P. K. Regression Analysis of Count Data; Cambridge: New York, NY, USA, 2013.
320
10. Kim, S.; Jang, D.; Jun, S.; Park, S. A novel forecasting methodology for sustainable management of defense
321
technology. Sustain. 2015, 7(12), 16720–16736.
322
11. Park, S.; Lee, S.; Jun, S. A network analysis model for selecting sustainable technology. Sustain. 2015, 7(10),
323
13126–13141.
324
12. Jun, S.; Park, S. Examining technological innovation of Apple using patent analysis. Ind. Manage. Data Syst.
325
13. Kim, J.; Jun, S. Graphical causal inference and copula regression model for Apple keywords by text mining.
327
Adv. Eng. Inform. 2015, 29(4), 918–929.
328
14. Jun, S.; Park, S. Examining technological competition between BMW and Hyundai in the Korean car
329
market. Technol. Anal. Strateg. Manage. 2016 28(2), 156–175.
330
15. Grimaldi, M.; Cricelli, L.; Rogo, F. Valuating and analyzing the patent portfolio: the patent portfolio value
331
index. European J. of Innovation Manage. 2018 21(2), 174-205.
332
16. Kim, J.; Jun, S.; Jang, D.; Park, S. An Integrated Social Network Mining for Product-based Technology
333
Analysis of Apple. Ind. Manage. Data Syst. 2017 117(10), 2417-2430.
334
17. R Development Core Team. R: A Language and Environment for Statistical Computing; R Foundation for
335
Statistical Computing: Vienna, Austria. Available online: http://www.R-project.org, 2018.
336
18. Ross, S. M. Introduction to Probability and Statistics for Engineers and Scientists, 4th Edition; Elsevier: Seoul,
337
Korea, 2012.
338
19. Gelman, A.; Carlin, J.B.; Stern, H.S.; Dunson, D.B.; Vehtari, A.; Rubin, D.B. Bayesian Data Analysis, 3rd
339
Edition; Chapman & Hall/CRC Press: Boca Raton, FL, 2013.
340
20. Hogg, R. V.; McKean, J. M.; Craig, A. T. Introduction to Mathematical Statistics, 8th edition, Pearson: Upper
341
Saddle River, NJ, 2018.
342
21. WIPSON. WIPS Corporation. Available online: http://www.wipson.com, http://global.wipscorp.com (accessed
343
2018).
344
22. KISTA, Korea Intellectual Property Strategy Agency, Available online: http://www.kista.or.kr (accessed