Investigation of Formant Smoothening Using
Poly-Fitting on Male/Female Speech
Akshay Kumar1, Randhir Singh1, Parveen Lehana2#
Sri SAI College of Engineering & Technology, Punjab, India1 Dept. of Physics & Electronics, University of Jammu, Jammu, India 2
ABSTRACT: Speech is the most innate and fastest means of communication between humans. There has been a significant amount of research in the field of speech signal processing, and numerous models have been designed. The evolutionary origins of speech remain obscure. An algorithm is designed to modify various speech parameters with different frame size using linear, quadratic, and cubic fitting method. Various frame level ranging from 10 to 50 are taken for synthesis of male and female speech. Perceptual experiments were also conducted to assess the quality of the synthesized speech. Unique pattern of PESQ score is obtained for linear, quadratic, and cubic fitting of human speech.
KEYWORDS: Speech, Quality, PESQ, Poly-fitting.
I.INTRODUCTION
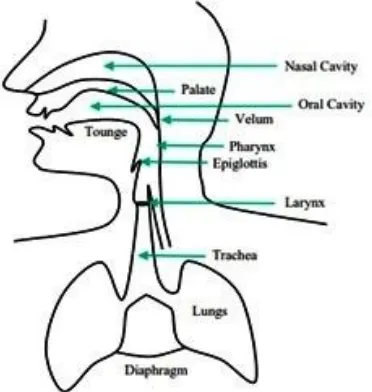
Speech is so familiar a feature of daily life that we rarely pause to define it. It seems as natural to human as walking, and only less so than breathing [1]. Speech is just the sound waves coming out of the human mouth and perceived through ears. It conveys different forms of information to the listener. Apart from language being spoken being spoken and the emotion, gender and the identity of the speaker also could be the part of information [2-5]. The process of speech production begins when the speaker formulates a message in his or her mind to communicate with the listener via speech. The next step would be Conversion of message into a language code, this involves converting the message into set of phonemes, comprising of correct sequence of words along with syntax, duration and loudness of sound. Figure 1 shows a different view of speech production [6-8]. The vocal tract is the space ranging from the opening between the vocal cords (glottis) to the lips. The vocal tract can be divided into the pharynx (from the esophagus to the mouth) and the oral cavity. For an average male, the length of the vocal tract is about 17 cm, and the cross-sectional area varies from zero to about 20 cm2 (depending of the positions of the tongue, lips, jaw, and velum) [9-12].
Fig. 1 The human speech production system.
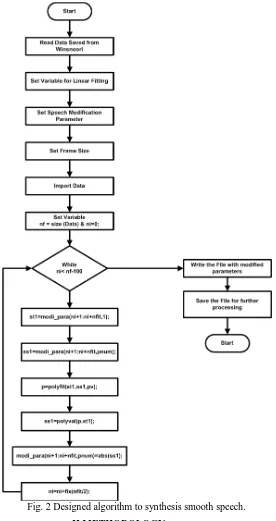
poly-fitting (i.e. linear, quadratic, and cubic) approximation. The synthesised speech is then analysed and quality is test using PESQ method [13].
Fig. 2 Designed algorithm to synthesis smooth speech.
II.METHODOLOGY
speech is compared with original recorded speech signal. The deviation between synthesized speech and original speech is evaluated using PESQ method.
III.RESULTS AND DISCUSSION
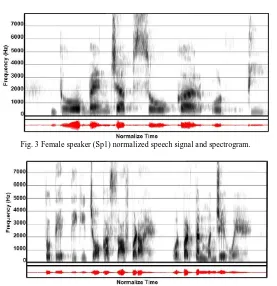
Spectrum Normalized female speech and their spectrogram are shown in Fig. 3 and Fig. 4 whereas Fig. 5 and Fig. 6 shows normalized male speech and their spectrogram. Table I, II, and III shows the computed PESQ score of synthesized smoothen speech having various frame size in linear, quadratic, and cubic fitting process with respect to original recorded speech signal of female and male speakers respectively. PESQ computed values it is concluded that for female speaker as the frame size is increased PESQ attains a constant value and the maximum value for Sp1 and Sp2 is 1.425 and 1.080 respectively. It is contrary for male speaker, as the frame size is increased PESQ score shows the random deviation and the maximum value for male speaker Sp3 and Sp4 are 1.439 and 1.413 respectively. In case of quadratic fitting linear increase in PESQ score. Contrary to linear and quadratic fitting, cubic fitting shows decrease in PESQ score for male and female speakers.
Table I. PESQ score of linear fit data of female and male speaker with various frame size.
Frame
Size
PESQ Score Linear Fit Data
Female Speaker Male Speaker
Sp1
Sp2
Sp3
Sp4
10
1.280 1.008 1.349 1.07520
1.425 1.080 1.329 1.23230
1.425 1.080 1.439 1.20640
1.425 1.080 1.349 1.16150
1.425 1.080 1.439 1.413Table II. PESQ score of quadratic fit data of female and male speaker with various frame size.
Frame
Size
PESQ Score Quadratic Fit Data
Female Speaker Male Speaker
Sp1
Sp2
Sp3
Sp4
10
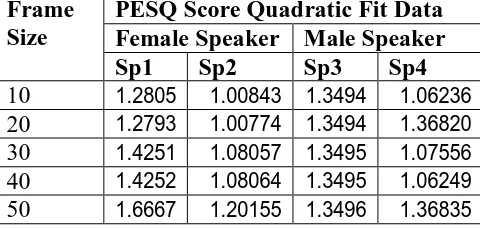
1.2805 1.00843 1.3494 1.0623620
1.2793 1.00774 1.3494 1.3682030
1.4251 1.08057 1.3495 1.0755640
1.4252 1.08064 1.3495 1.0624950
1.6667 1.20155 1.3496 1.36835Table III. PESQ score of cubic fit data of female and male speaker with various frame size.
Frame
Size
PESQ Score Cubic Fit Data
Female Speaker Male Speaker
Sp1
Sp2
Sp3
Sp4
10
1.4251 1.08058 1.4391 1.2060220
1.2806 1.00850 1.3480 1.2408530
1.2806 1.00844 1.3479 1.1604640
1.2804 1.00822 1.3496 1.16830Fig. 3 Female speaker (Sp1) normalized speech signal and spectrogram.
Fig. 4 Female speaker (Sp2) normalized speech signal and spectrogram.
Fig. 5 Male speaker (Sp3) normalized speech signal and spectrogram.
V.CONCLUSION
Thus Research work is carried out to investigate the linear fitting of signals on male/female Hindi language speaker. A phrase is recorded using high quality system and professional sound recording software. An algorithm is designed to fit the linear, quadratic as well as cubic data using poly fitting technique. In case of linear and quadratic fitting of male and female Hindi speech, PESQ score shows a linear increase. In contrary to this effect cubic fitting showed decrease in PESQ score of male and female Hindi speaker with increase in frame size.
REFERENCES
[1] A. R. Lameira1, M. E. Hardus, A. M. Bartlett, R. W. Shumaker, S. A. Wich1, S. B. J. Menken, Speech-Like Rhythm in a Voiced and
Voiceless Orangutan Call. New York: Cambridge University Press, 1984.
[2] A. A. Ghazanfar, D. Y. Takahashi, “Facial expressions and the evolution of the speech rhythm,” J Cogn Neurosci, Vol. 26, pp.1196–1207,
2014.
[3] Y. Pantazis and Y. Stylianou, “Improving the modeling of the noise part in the harmonic plus noise model of speech,” in Proc. IEEE Acoustics, Speech and Signal Processing, pp. 4609-4612, 2008.
[4] L. Rabiner and R. Schafer. Digital Processing of Speech Signals. Prentice Hall, 1978.
[5] T. Raitio, A. Suni, J. Yamagishi, H. Pulakka, J. Nurminen, M. Vainio, and P. Alku, “HMM-based speech synthesis utilizing glottal inverse
filtering,” IEEE Trans. Audio, Speech, and Language Processing, pp. 153-165, 2011.
[6] G. E. Peterson and H. L. Barney, “Control methods used in a study of vowels,” J Acoust Soc Am, Vol. 24, pp.175–184, 1952.
[7] T. M. Nearey, “Static, dynamic, and relational properties in vowel perception,” J Acoust Soc Am, Vol. 85, pp. 2088–2113, 1989.
[8] P. F. Assmann and W. F. Katz, “Time-varying spectral change in the vowels of children and adults,” J Acoust Soc Am, Vol. 108, pp.1856–
1866, 2000.
[9] G. Fant, Acoustic Theory of Speech Production. Mouton: The Hague, 1960.
[10] R. Carlson, B. Granstrom, and D. Klatt, “Vowel perception: the relative perceptual salience of selected acoustic manipulations,” Speech Transmission Laboratories Quarterly Progress Report, pp. 73–83, 1979.
[11] C. J. Darwin, “Perceiving vowels in the presence of another sound: constraints on formant perception,” J Acoust Soc Am, vol. 76, pp. 1636–
1647, 1984.
[12] M. Sommers and P. D. Kewley, “Modeling formant frequency discrimination of female vowels,” J Acoust Soc Am, Vol. 99, pp. 3770–3781,
1996.
[13] S. Pennock, “Accuracy of the perceptual evaluation of speech quality (PESQ) algorithm,” in Proc. Measurement of Speech and Audio Quality