1 | P a g e
POLYMER DRAG REDUCTION FOR SINGLE-PHASE WATER FLOW IN AND AROUND 180O BENDS
Paul Onubi Ayegba.1,2, Lawrence C. Edomwonyi-Otu2,3*, Abdulkareem Abubakar2, Nurudeen Yusuf4,
1Department of Mechanical Engineering University of California Berkeley, 94720 CA, USA. 2Department of Chemical Engineering Ahmadu Bello University, 810212 Zaria, Nigeria.
3Department of Chemical and Petroleum Engineering, Delta State University, 330106 Abraka, Nigeria. 4Department of Chemical and Petroleum Engineering, Bayero University, 700231 Kano, Nigeria.
*Corresponding Author: [email protected]
ABSTRACT
This paper presents an investigation into the influence of drag-reducing polymer (DRP) on the flow of water inside and around U-bends. The DRPs tested were partially hydrolysed polyacrylamide (HPAM) and two different molecular weight polyethylene oxides (PEO). The Reynolds number and in-situ concentration ranges of water and DRP were 5000 < 𝑅𝑒 < 40000 and 1 ≤ 𝐶 ≤ 20 𝑝𝑝𝑚 respectively. The test section was made up of clear polyvinyl chloride (CPVC) pipes that contained two U-bends with radii of curvature (R) of 100 and 200 mm as well as straight sections of 19-mm ID. Higher pressure gradient was recorded in the under-developed flow section after the bend. Drag reduction (DR) increased with in-situ concentration of the DRP and the flowrate up to some threshold values. The concentration and flowrate thresholds were about 20 ppm and 1.07 m/s respectively. DR differed among the different sections considered with the highest values recorded for developed flows upstream of the bend and the least values recorded in the bend. DR at station 1 (immediately after the bend) was generally lower than that at station 2 (further downstream). P-K Plots showed that, the DR envelop for developed flow in straight pipes did not apply to the bend and the under-developed flow section. DR increased with polymer molecular weight and ionic strength in straight sections. However, molecular weight (and polymer shearing) had limited effect on DR in the bends. DR characteristics at the bend suggested that there was a different or additional mechanism. The effect of bend curvature ratio on DR was predominant after the U-bend. The larger the ratio of pipe diameter to bend diameter, the lower the DR in the redeveloping sections after the bend. For R = 100 mm, the highest DR recorded for fully developed flows before bend, in the bend, at stations 1 and 2 were 57, 31, 36 and 33% respectively while that for R = 200 mm were 64, 28, 42 and 49% respectively.
Keywords: U-bends; polymer drag reduction; flow redevelopment; bend curvature; PEO; HPAM
NOMENCLATURE
DP Pressure drop
DPL Pressure gradient
DR Drag reduction
DRP Drag-reducing polymer
2 | P a g e
DRA Drag-reducing agent
R Radius of curvature of the bend
Re Reynolds number
d Pipe diameter
f Friction factor
1
INTRODUCTION
Fluid transport through tubes finds application in a large number of chemical, petroleum and process industry setups [1], [2]. The flow of fluids in pipelines are associated with frictional pressure losses (drag) which translates into high pumping requirements in addition to design and safety concerns [3]. The reduction of frictional losses (drag reduction, DR) in pipeline transport is an engineering problem and has attracted significant research interest. This is not unrelated to the obvious operational benefits associated with drag reduction, such as reduced pumping energy requirement, enhanced operational safety and flexibility among others [4]– [6]. DR techniques include surface modification and the use of additives. The surface modification approach may involve the use of baffles, dimples, wavering walls and amenable surfaces [7]–[12]. Drag reduction by additives include the use of heavy molecular weight polymers, surfactants and microbubble injection. After the ground-breaking work credited to Tom (1948) a number of investigations have been done with the view of studying the influence of drag-reducing agents (DRAs) on liquid flows in straight conduits of various flow configurations[14]–[17]. There is a general consensus that DR by additives is restricted to the turbulent (and sometimes extended laminar) flow regime. Similarly, the DR has been found to depend on in-situ polymer concentration, Reynolds number, geometry and orientation of the conduit, polymer molecular weight/bond structure and flow pattern (two-phase flow) [10], [11], [18]–[20]. In general, DR increases with both in-situ concentration of the DRA and fluid Reynolds number until certain threshold is attained. For polymer and surfactant drag-reducing flows, the flowrate threshold is constrained by some critical flowrate above which the polymer or surfactant begins to degrade. The limits imposed by concentration appears in the form of saturation of the vortex structure at the threshold concentration and beyond this threshold the rheological properties of the solution determine if additional increase in concentration results in same or diminished drag reduction. Several results have also been published on the influence of pipe geometry and flow configuration on drag reduction in straight and coiled conduits [10], [21]–[23].
3 | P a g e
reduction is proportional to turbulence suppression, its value would predictably be smaller for fully developed coiled conduit flows relative to flows in an equivalent length straight conduit for the same Reynolds number flow. Though there are some conflicting results on the effect of concentration on DR in coiled pipes, most of the reports appear to suggest that, similar to straight conduit flows, drag reduction increases with polymer or surfactant concentration until saturation is attained beyond which DR remains the same or reduces with further increase in concentration [22], [24], [26], [28]–[30]. The effect of concentration has also been reported to depend on tube diameter [21], [31]. According to them, higher concentrations resulted in lower drag reduction and even enhanced the drag at lower flow rates. In addition, higher concentration for the larger pipes delayed the onset of drag reduction [21], [31]. As with flows in straight conduits, polymer and surfactant drag reduction in coiled conduits generally increases with flowrate [21], [22]. Data on the influence of pipe diameter on drag reduction in coiled pipes is scanty and no concrete conclusion may be drawn from the published information. Existing data show that the effectiveness of DRPs in small diameter pipes is higher than in larger ones [21], [31]. For drag reduction in coiled pipes using DRP, the influence of curvature on percentage drag reduction has been reported to be more important in small diameter tubes [25].
A fingerprint of flows inside coils is the centrifugal-force-imposed secondary flows along with the bulk flow, while flows in pipe fittings such as elbow and U-bends demonstrate more complex characteristics. These complexities are linked to wakes resulting from flow separation in bends. The relatively short lengths of such common fittings mean there is inadequate flow development length within them so resulting in downstream flow fluctuation. Accounting for the additional complexities in DR studies in bends would give such investigation an engineering significance. An investigation of drag-reducing surfactant (DRS) solution flow in a 0.5-inch welded elbow as well as three 6-inch smooth elbow bends coupled in series was done by [32]. That elaborate study highlighted some effects of the DRS on DR, wakes, as well as flow redevelopment after elbow bends. According to them, the difference of note between the flow of water and DRS solution is the influence of viscoelasticity on wakes. They remarked that, for welded elbows with significant wake, there is DR before and after (fully developed flow section after the bend) the elbow, but no DR in the bend (or redeveloping section just after the bend) itself. They recorded enhanced pressure losses in the under-developed section after the bend for both water and DRS relative to hydrodynamically developed flows. In addition, longer flow development distance was required for the case of drag-reducing surfactant flow than that required for water. They remarked that the slower flow development of DRS solution relative to the solvent imposes additional pressure drop, which negates the surfactant’s drag-reducing action on the flow. They however, reported significant drag reduction for flow in smooth elbows with less flow separation. It should be remarked that, their study was carried out using DRS and for flow in 90o bends of large curvature ratios. There are limited studies on the influence of drag-reducing polymers on flows in bends and particularly 180o bends.
4 | P a g e
developed straight conduit flow. They stated that, the DRP was more effective in reducing frictional drag and less effective in reducing losses resulting from secondary flows in the bend as well as losses resulting from form drag downstream of the bend.
Several questions remain among which are the effect of bend curvature, the effect of polymer molecular weight, as well as the action of DRPs on various levels of flow development among others. This study, therefore, seeks to provide answers to some of these questions by investigating the flow of water with different DRPs in and around U-bends of different curvatures and for varying levels of flow development.
2
MATERIALS AND METHOD
2.1 Materials
Properties of the test fluid and the DRPs used for this investigation are shown in Table 1 and Table 2 respectively. 10,000 ppm master solutions of the DRPs were prepared by dissolving 100 g of the respective DRPs in 10 L of water.
Table 1: Properties of test fluid at 22 oC
Test fluid Density (kg/m3) Viscosity (mPa.s) Surface tension (mN/m)
Tap water 998.2 1.0016 72.50
Table 2: DRP types
DRP Trade name Manufacturer In-situ concentration
Partially hydrolysed polyacrylamide (HPAM)
Magnafloc 1011 BASF Chemicals
1 - 20 ppm
polyethylene oxide (PEO) PEO5M, PEO8M Sigma-Aldrich 1 - 20 ppm
2.2 Experimental flow loop
5 | P a g e
177.8 cm (114.3 cm apart) after the bend and used for measuring pressure drop at a second station further downstream of the bend (redeveloping flow, Station 2). The Foxboro DP transducer was mounted across two pressure ports situated at 12.7 cm before the bend and 434.3 cm after the bend and used for taking the overall pressure losses due to bend and redeveloping section. This transducer primarily served as a means of validating results from the other DP cells. All pressure taps were located at the base of the measurement section and the DP transducers were calibrated before use. A Coriolis flow meter (CMFS050M, 0-70 lbmin
-1) was installed before the test section for measuring the flowrate of the fluid. All the DP
transducers and the Coriolis flow meter were connected to measurement computing data acquisition device for data collection via LabVIEW. Standard resistors were connected across the DAQ channels for voltage measurements. The accuracy of the standard resistors was quoted at ±5%, but for consistency, direct voltage measurements were carried out across the DAQ terminals to establish a base line. These measurements were done using a digital multi-meter and the measurement were all within ±3.2% of expected voltage values across the DAQ terminals.
6 | P a g e
Figure 1: Schematic drawing of the loop, 1. Water tank 2. Discharge Tank 3. Centrifugal pump 4. Gate valves 5. Coriolis flow meter 6. Injection pump 7. CPVC test section 8. DP Transducer before bend 9. DP Transducer across bend 10. DP Transducer after bend 1 11. DP Transducer after bend 2 12. DP Transducer bend + redeveloping flow section
The following expression was used for computing DR:
𝐷𝑅(%) =𝑑𝑝−𝑑𝑝𝐷𝑅𝑃
𝑑𝑝 × 100% (1)
here 𝑑𝑝 is the pressure gradient before adding the DRP and 𝑑𝑝𝐷𝑅𝑃 is the pressure gradient with
DRP added.
Results of this study were also presented on Prandtl-Karman (P-K) plots which relates friction factor to the Reynolds number. The purpose of this was to describe the drag reduction characteristics in relation to the drag reduction envelop. The drag reduction envelop for straight pipes is bounded by curves for laminar, turbulent and maximum drag reduction asymptote (MDRA) [34].
Expressions for friction factor, laminar, turbulent and MDRA are given by;
𝑓 =∆𝑃
𝐿 𝐷
2𝜌𝑈2 (2)
1 √𝑓⁄ =𝑁𝑅𝑒√𝑓
16 Laminar flow (3)
1 √𝑓⁄ = 4 log10𝑁𝑅𝑒√𝑓 − 0.4 Turbulent flow (4)
7 | P a g e
1 √𝑓⁄ = 19 log10𝑁𝑅𝑒√𝑓 − 3.24 MDRA (5)
3
RESULTS AND DISCUSSION
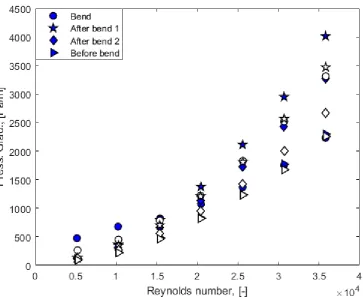
3.1 Pressure gradient distribution in and around U-bend
Error! Reference source not found. shows the measured pressure gradients for developed flow before U-bends (A), across U-bends (B) and at two redeveloping-flow sections after the bends (C). In all of these locations, pressure gradient increased with Reynolds number.
For bend with R = 100 mm, the pressure gradient at the bend was higher than that for fully developed flow before bend at lower Reynolds number. However, both pressure gradients converged at higher Reynolds number where turbulence dominated. This agrees with well-established flow behavior in bends [35]. In both bends, the difference in pressure gradient between fully developed flow and that for redeveloping flow increased with flowrate. This is because, in the redeveloping section, both skin and form drag increased with flowrate while in the fully developed flow section skin drag (which increased with Reynolds number) dominated. Interestingly, most of the pressure losses from the bend appeared to come from losses after the bend rather than losses within the bend itself. This suggest that there was higher form drag immediately after the bend relative to that in the bend. In addition, the pressure gradient at station 1 (just after the bend) was higher than that at station 2 (further downstream) and the difference increased slightly with Reynolds number. This is to be expected considering that the flow further away from the bend was more developed compared to flow immediately after the bend and thus there was less contribution from form drag. These results are also consistent with recent report of Ayegba et al. [33]
8 | P a g e
Figure 2: Comparison between pressure gradient at different locations of the test section. R = 100 mm (filled symbols) and R = 200 mm (hollow symbols).
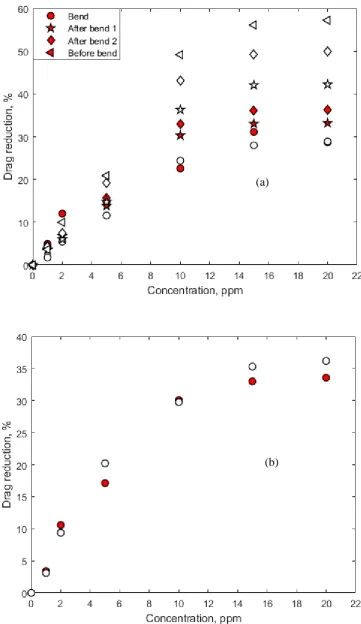
3.2 Influence of polymer concentration on drag reduction in around U-bend
Figure 3a shows drag reductions at various in-situ concentrations (0 to 20 ppm) in and around the two bends using HPAM polymer at a fixed flowrate of 1.34-m/s (Re ≈ 25600). Drag reduction for developed flow before the bends increased with DRP concentration up to a threshold concentration of 20 ppm. Although this type of trend had been reported in several works for horizontal straight pipe flow, a good number of them reported optimal values at lower polymer concentrations [10], [16], [36]–[39]. It suffices to say therefore that the higher concentration (10,000 ppm) of the polymer master solution used in this work might be partly responsible for the higher values of optimum concentration. Preparation of very high concentration of master solution (like in the present study) requires longer mixing time and this can result in polymer chain scission. If this is the case, the effectiveness of the polymer is greatly reduced resulting in the attainment of optimal values at higher polymer concentration. This reason was corroborated byAl-Yaari and co. [37], who linked the effect to increased formation of aggregates.
9 | P a g e
contributed to frictional drops after the bend; and only wall friction contributed to pressure drops before the bend (i.e. fully developed straight pipes flow). From the results, therefore, it can be stated that DRP was most effective in reducing skin drag and then, to a much lesser degree, flow disturbances. These results also show that DRP failed in substantially suppressing secondary flow that characterizes flow at the bend.
A plot of DR over a section consisting of the bend and 225 × 𝑑 after the bend was also shown (Figure 3b). It shows that DR occurred over the entire section affected by the presence of the U-bend, albeit to the lesser degree compared to fully developed flows in straight pipes. This is consistent with recent studies ofAyegba and co. [33]. Both bends showed similar DR over the range of concentrations tested. This is because the test was carried out at high Reynolds number where frictional drag was predominant.
10 | P a g e
Figure 3: Drag reduction versus polymer concentration; a. at different locations of the test section, b. bend + redeveloping flow section. R = 100 mm (filled symbols) and R = 200 mm (hollow symbols).
11 | P a g e
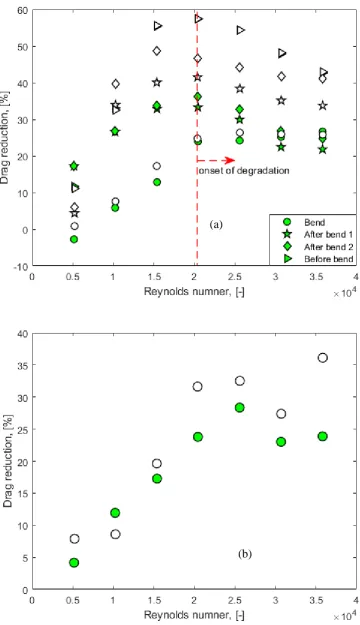
3.3 Influence of Reynolds number and bend curvature ratio on drag reduction in and around U-bends
Figure 4 shows plots of DR versus Reynolds numbers using polymer concentration of 10 ppm. Overall, DR for hydrodynamically developed straight pipe flow before the bend increased with Reynolds number. In this case, Reynolds number is only a function of fluid velocity since diameter, density and viscosity are fixed. The result agrees with results of previous investigations for straight conduit flows [40]. At higher Reynolds number, shear-induced degradation of the DRP occurred and further increase in flowrate resulted in lower drag reduction [10], [41]. Analogous to flow before the bend, drag reduction of polymer solution in the U-bends and at the two stations after the bend increased with Reynolds number until a polymer degradation sets in. However, the DR reported at the bend and at both stations after the bend were always less than that before the bend. Again, DR at the bend was the least, followed by that immediately after the bend and then that further downstream. These results are generally consistent with recent reports of Ayegba and co. [33]. The onset of polymer degradation appeared to be the same at all locations, though the impact of the degradation on DR before the bend and at the second station after the bend was more abrupt as seen by the sharp declination of DR. Interestingly, the impact of polymer degradation was least at the bend. This might suggest a different or additional effect of polymers on flows in U-bends. Polymer degradation often results from chain scission resulting in reduced molecular weight of the polymers. Since the reduction in molecular weight of the polymer did not have a significant impact on DR at the bend, then either of these two explanations suffice. The first is that the turbulence scales at the bends are relatively small, thereby smaller molecular weight polymer are adequate in inhibiting vortex stretching among other things. This is a likelihood considering the impact of secondary flows on streamwise flows. For example, in fully developed flows in coils, significant turbulence suppression occurs and there is also delay in the onset of turbulence relative to straight pipe flows [21]–[23], [28], [42]. This turbulence suppression translates into reduced turbulence scales. The second is that the effect of polymer on secondary flows is not significantly influenced by polymer molecular weights. This second hypothesis is very much linked to the first and experiments were conducted in this work to investigate the influence of polymer molecular weights on DR in U-bends (results presented in subsequent section). Results of Figure 4 also show that degradation effects were more pronounced after the smaller bend than the larger bend. This suggests that increase in bend curvature ratio resulted in increased polymer degradation.
12 | P a g e
Figure 4: Drag reduction versus flow velocity; a. at different locations of the test section, b. bend + redeveloping flow section. R = 100 mm (filled symbols) and R = 200 mm (hollow symbols).
(a)
13 | P a g e
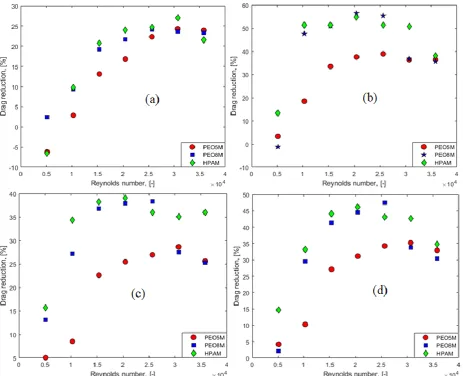
3.4 Influence of polymer types and molecular weight on drag reduction in and around U-bend
Drag reductions by 10-ppm solutions of PEO5M, PEO8M and HPAM in and around U-bend of curvature ratio d/R = 19/200 were determined and the results are presented in Figure 5. It should be stated that the HPAM solution used for this test was different from that used for the other test with regards to batch and age. In this case the preparation of the 10,000-ppm master solution was done at lower mixing speed and longer mixing time. Also, its age at the time of injection was 1-3 days as opposed to the age of HPAM used in the other test which was 7-21 days. Overall, the HPAM used in this test showed similar behavior as that used in previous test with only minor differences. One of such difference is the onset of polymer degradation which (though was the same for fully developed flow before the bend) moved to higher flowrate for redeveloping flow after the bend in this batch.
14 | P a g e
Figure 5: Drag reduction by different drag-reducing polymers at different locations. (a) fully-developed section before bend; (b) at the bend with R = 200 mm; (c) station 1 immediately after bend; (d) station 2 downstream of station 1.
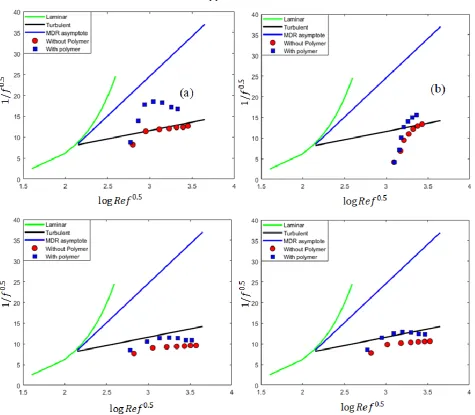
3.5 Prandtl-Karman (P-K) plots in and around U-bends
P-K plots as a function of location are presented in Figure 6. The data for water flow in straight pipe upstream of the bend follows the Prandtl-Karman law (Figure 6a), which provides validation of the experimental data. As expected, at lower Reynolds numbers, the data for the bend fell below that in straight pipe (that is the pressure gradient at the bend was higher than that in developed flows in straight pipes before the bend), but at higher flowrates they converge (turbulence become dominant). Both curves for flow after the bend fall below that of water, indicating higher pressure drops for the redeveloping sections after the bends. Figure 6b is the P-K plot for flow of 10-ppm DRP. The curves show reduced pressure drops in all the sections of the loop considered. The curve for fully developed flow before the bend agrees with that of Zadrazil and co. [44].
Comparison of P-K plots for flow without DRP and flow with 10-ppm HPAM at different locations are shown in Figure 7. This shows that, like straight pipe flows, DR in and after 180o
bends increased with Reynolds number but are markedly lower than that in straight sections. Interestingly, the drag reduction envelop for developed flow in straight pipes did not apply to the bend and the under-developed flow section. Yokohama and Tomita [45] also reported similar results in their study of the flow of PEO solution in a 360o bend.
15 | P a g e
Figure 6: P-K plots for flow with R = 100 mm. (a) water flow without DRP; (b) water flow with 10-ppm HPAM.
16 | P a g e
4
CONCLUSION
Experimental study of the flow of water and selected DRPs (PEO5M, PEO8M and HPAM) in and around two U-bends were carried out with the view of investigating the effect of the bend on drag reduction. Results of test carried out under different conditions of flowrates, polymer concentration, polymer molecular weight and bend curvature showed that:
✓ A higher percentage of the pressure losses associated with the bend occurred in the under-developed flow section after the bend (relative to the losses in the bend itself). ✓ In all the sections considered, DR generally increased with polymer concentration and
flowrates until some threshold value was reached. For concentration this threshold is constrained by the saturation of turbulence structures at certain polymer concentration while in the case of flowrate the threshold is determined by the critical shear.
✓ DR varied in the different sections considered with the highest values recorded for fully developed flows upstream of the bend and the least values recorded in the bend. DR at station 1 (immediately after the bend) was lower than that at station 2, further after the bend (where the flow is better developed) for all flowrates and concentrations tested. ✓ DR also increased with polymer molecular weight and ionic strength in straight sections
before and after the bend. However, molecular weight (and polymer shearing) appeared to have very limited effect on DR at the bends. The behavior of drag-reducing polymer solution at the bend suggest that there is a different or additional mechanism of DR in bends.
✓ Effect of bend curvature ratio on DR was predominant after the bend. The higher the curvature ratio, the lower the DR in the redeveloping section after the bend. In the bend itself, the effect of curvature was found to be dependent on the flowrate (which in turns determines the dominant contribution to pressure losses).
✓ The highest DR recorded for fully developed flows before bend, in the bend, at stations 1 and 2 downstream of the bend were 57%, 31%, 36% and 33% respectively for the case of U-bend with ratio d/2R = 19/200. That reported for U-bend with 2r/2R=19/400 were 64%, 28%, 42% and 49% respectively.
✓ P-K Plots showed that, the DR envelop for developed flow in straight pipes did not apply to the bend and the under-developed flow section.
ACKNOWLEDGEMENT
The Authors would also like to acknowledge the United States J.W. Fulbright Program/U.S. Department of State and Institute of International Education (IIE) for the funding provided for this research. The authors also wish to thank the Flow Group of University of California Berkeley and in particular Simo A. Mäkiharju, Eric Thacher and Daniel Grieb for the support provided for this research. The authors also wish to acknowledge the free donation of HPAM polymer for this research by BASF-Chemicals USA.
CONFLICT OF INTEREST.
The Authors wish to declare that there are no conflicts of interest with the publication of this manuscript.
17 | P a g e
REFERENCES
[1] P. O. Ayegba, M. Abdulkadir, V. Hernandez-Perez, I. S. Lowndes, and B. J.
Azzopardi, “Applications of artificial neural network (ANN) method for performance prediction of the effect of a vertical 90° bend on an air–silicone oil flow,” J. Taiwan Inst. Chem. Eng., vol. 0, pp. 1–6, 2017.
[2] P. O. Ayegba and M. Abdulkadir, “Prediction of Average Void Fraction and Pdf of Void Fraction in Vertical 90 O Bend for Air–Silicone Oil Flow Using Multilayer Perceptron (Mlp) Codes,” Int. J. Lean Think., vol. 7, no. 2, pp. 80–105, 2016.
[3] L. C. Edomwonyi-Otu and P. Angeli, “Pressure drop and holdup predictions in
horizontal oil-water flows for curved and wavy interfaces,” Chem. Eng. Res. Des., vol. 93, pp. 55–65, 2015.
[4] L. C. Edomwonyi-Otu and P. Angeli, “Separated oil-water flows with drag reducing polymers,” Exp. Therm. Fluid Sci., vol. 102, no. September 2017, pp. 467–478, 2019.
[5] L. C. Edomwonyi-Otu and D. O. Adelakun, “Effect of heavy molecular weight
polymer on quality of drinking water,” Mater. Today Commun., vol. 15, no. February, pp. 337–343, 2018.
[6] P. O. Ayegba and L. C. Edomwonyi-Otu, “Turbulence statistics and flow structure in fluid flow using PIV technique: A review,” Eng. Reports, no. August 2019, pp. 1–49, 2020.
[7] J. Chen, C. Tsai, Y. Kehr, L. Horng, K. Chang, and L. Kuo, “An experimental study of drag reduction in a pipe with superhydrophobic coating at moderate Reynolds
numbers,” in EPJ Web of Conferenece 6, 2010, vol. 19005, pp. 1–8.
[8] S. Mäkiharju, B. R. Elbing, A. Wiggins, D. R. Dowling, M. Perlin, and S. L. Ceccio, “Perturbed Partial Cavity Drag Reduction at High Reynolds Numbers,” in 28th Symposium on Naval Hydrodynamics Pasadena, California, 2010, no. September, pp. 12–17.
[9] S. A. Mäkiharju, M. Perlin, and S. L. Ceccio, “On the energy economics of air lubrication drag reduction,” Inter J Nav Arch. Oc Engng, vol. 4, pp. 412–422, 2012.
[10] A. Abubakar, T. Al-Wahaibi, Y. Al-Wahaibi, A. R. Al-Hashmi, and A. Al-Ajmi, “Roles of drag reducing polymers in single- and multi-phase flows,” Chem. Eng. Res. Des., vol. 92, no. 11, pp. 2153–2181, Nov. 2014.
[11] H. A. Abdulbari, A. Shabirin, and H. N. Abdurrahman, “Bio-polymers for improving liquid flow in pipelines-A review and future work opportunities,” J. Ind. Eng. Chem., vol. 20, no. 4, pp. 1157–1170, Jul. 2014.
[12] S. A. Makiharju and S. L. Ceccio, “On multi-point gas injection to form an air layer for frictional drag reduction,” Ocean Eng., vol. 147, no. October 2017, pp. 206–214, 2018.
[13] B. A. Tom, “Some observations on the flow of linear polymer solutions through straight tubes at large Reynolds numbers,” in First International Congress on Rheology, 1948, vol. 2, pp. 135–141.
18 | P a g e
horizontal oil – water flow,” Chem. Eng. Res. Des., vol. 90, no. 8, pp. 1019–1030, 2012.
[15] T. Al-Wahaibi et al., “Experimental investigation on the performance of drag reducing polymers through two pipe diameters in horizontal oil-water flows,” Exp. Therm. Fluid Sci., vol. 50, pp. 139–146, 2013.
[16] L. C. Edomwonyi-Otu, M. Chinaud, and P. Angeli, “Effect of drag reducing polymer on horizontal liquid–liquid flows,” Exp. Therm. Fluid Sci., vol. 64, pp. 164–174, 2015.
[17] A. Abubakar, T. Al-Wahaibi, A. R. Al-Hashmi, Y. Al-Wahaibi, A. Al-Ajmi, and M. Eshrati, “Influence of drag-reducing polymer on flow patterns, drag reduction and slip velocity ratio of oil–water flow in horizontal pipe,” Int. J. Multiph. Flow, vol. 73, pp. 1–10, 2015.
[18] M. M. Gimba, L. C. Edomwonyi-Otu, A. Abubakar, and N. Yusuf, “Synergistic Effect of Polymer-Polymer Mixtures as Drag Reducing Agents in Turbulent Pipeline Water Flow,” Niger. Res. J. Eng. Environ. Sci., vol. 3, no. 2, pp. 560–570, 2018.
[19] K. D. Magit, L. C. Edomwonyi-Otu, N. Yusuf, and A. Abubakar, “Effect of
temperature variation on the effectiveness of partially hydrolyzed polyacrylamide in drag reduction,” Niger. Res. J. Eng. Environ. Sci., vol. 4, no. 2, pp. 569-577., 2019.
[20] I. A. Dosumu, L. C. Edomwonyi-Otu, N. Yusuf, and A. Abubakar, “Guar Gum as Flow Improver in Single-Phase Water and Liquid–Liquid Flows,” Arab. J. Sci. Eng., vol. 45, pp. 1–7, 2020.
[21] S. N. Shah and Y. Zhou, “An experimental study of drag reduction of polymer solutions in coiled tubing,” SPE J., no. August, pp. 7–8, 2003.
[22] Y. Zhou, S. N. Shah, and P. V. Gujar, “Effects of coiled-tubing curvature on drag reduction of polymeric fluids,” SPE Prod. Oper., vol. 21, no. 1, pp. 134–141, 2004.
[23] S. N. Shah, K. Ahmed, and Y. Zhou, “Drag reduction characteristics in straight and coiled tubing - An experimental study,” J. Pet. Sci. Eng., vol. 53, no. 3–4, pp. 179– 188, 2006.
[24] S. N. Shah and Y. Zhou, “Maximum drag reduction asymptote of polymeric fluid flow in coiled tubing,” J. Fluids Eng., vol. 131, no. January 2009, pp. 1–9, 2009.
[25] K. B. Fox, M. S. Bainum, and C. Chemical, “A new synthetic polymer provides improved drag reduction in coiled-tubing operations in North Louisiana,” in SPE /ICoTA Coiled Tubing & Well Intervention Conference (the Woodlands, Tx, 3/23-24/2010) Proceedings, 2010, no. 201029, pp. 1–8.
[26] A. H. A. Kamel, “Drag reduction behavior of polymers in straight and coiled tubing at elevated temperature,” Electron. Sci. J. Oil Gas Bus., vol. 1, no. 1, pp. 107–128, 2011.
[27] M. Weber, A. S. Steiff, and P. M. Weinspach, “Heat transfer and pressure loss in flow of surfactant solutions in coiled pipes,” Forsch. im Ingenieurwes., vol. 4, no. 57, pp. 112–118, 1991.
[28] F. Gallego and S. N. Shah, “Friction pressure correlations for turbulent flow of drag reducing polymer solutions in straight and coiled tubing,” J. Pet. Sci. Eng., vol. 65, no. 3–4, pp. 147–161, 2009.
19 | P a g e
[29] H. Inaba, W. I. A. Aly, N. Haruki, and A. Horibe, “Flow and heat transfer
characteristics of drag reducing surfactant solution in a helically coiled pipe,” Heat Mass Transf., vol. 41, pp. 940–952, 2005.
[30] W. I. A. Aly, H. Inaba, N. Haruki, and A. Horibe, “Drag and heat transfer reduction phenomena of drag-reducing surfactant solutions in straight and helical pipes,” Trans. ASME, vol. 128, no. August 2006, pp. 800–810, 2006.
[31] S. N. Shah and Y. Zhou, “An experimental study of drag reduction of polymer solutions in coiled tubing,” Soc. Pet. Eng., vol. SPE 68416, pp. 1–14, 2001.
[32] K. Gasljevic and E. F. Matthys, “Friction and heat transfer in drag-reducing surfactant solution flow through curved pipes and elbows,” Eur. J. Mech. / B Fluids, vol. 28, no. 5, pp. 641–650, 2009.
[33] P. O. Ayegba, L. C. Edomwonyi-Otu, N. Yusuf, and A. Abubakar, “Experimental and neural network modelling of polymer drag reduction in 180 bends,” Results Mater., vol. 1, pp. 1–11, 2019.
[34] P. S. Virk, “Drag Reduction Fundamentals,” AlChE J., vol. 21, no. 4, pp. 625–656, 1975.
[35] I. Y. Chen, C. C. Wang, and S. Y. Lin, “Measurements and correlations of frictional single-phase and two-phase pressure drops of R-410A flow in small U-type return bends,” Int. J. Heat Mass Transf., vol. 47, no. 10–11, pp. 2241–2249, 2004.
[36] T. Al-Wahaibi, M. Smith, and P. Angeli, “Effect of drag-reducing polymers on horizontal oil – water flows,” J. Pet. Sci. Eng., vol. 57, pp. 334–346, 2007.
[37] M. Al-Yaari, A. Soleimani, B. Abu-Sharkh, U. Al-Mubaiyedh, and A. Al-Sarkhi, “Effect of drag reducing polymers on oil – water flow in a horizontal pipe,” Int. J. Heat Fluid Flow, vol. 35, no. June 2009, pp. 516–524, 2009.
[38] L. C. Edomwonyi-Otu and P. Angeli, “Effects of polymer addition on pressure drop and interfacial waves in horizontal oil-water flows,” Pet. Technol. Dev. J., vol. 2, no. July, pp. 41–48, 2014.
[39] T. Al-Wahaibi et al., “Experimental study on the effect of drag reducing polymer on flow patterns and drag reduction in a horizontal oil–water flow,” Int. J. Heat Fluid Flow, vol. 37, pp. 74–80, Oct. 2012.
[40] C. White and M. G. Mungal, “Mechanics and Prediction of Turbulent Drag Reduction with Polymer Additives,” Annu. Rev. Fluid Mech., vol. 40, no. 1, pp. 235–256, Jan. 2008.
[41] J. W. Hoyt, D. M. In:Busnell, and J. M. (Eds. . Hefner, Drag reduction by Polymers And Surfactants, Viscous Drag Reduction in Boundary Layers. 1989.
[42] S. N. Shah, Y. Zhou, and N. Goel, “Flow behavior of fracturing slurries in coiled tubing,” Soc. Pet. Eng., vol. SPE 74811, pp. 1–14, 2002.
[43] L. C. Edomwonyi-Otu, “Drag Reduction in Oil-Water Flows,” University College London, UK, 2015.
20 | P a g e
142–154, Apr. 2012.
[45] T. Yokoyama and Y. Tomita, “Flow of dilute polymer solutions through curved bends,” Bull. JSME, vol. 252, no. 29, pp. 1740–1745, 1986.