OPTIMIZATION OF UPVC MATERIAL VORTEX TUBE FOR MANUFACTURING COST REDUCTION AND THERMAL EFFICIENCY IMPROVEMENT
G B Pokale1, S B Yadav2
1
Assistant Professor, D Y Patil School of Engineering, Pune, India-411015
2
Alumni, P.D.E.A’s COEM, Pune, India - 412307
Abstract
Vortex tube is the device that separates the flow of compressed air into two streams. Separated streams have temperature difference with respect of inlet compressed air temperature. The compressed air enters in the vortex tube, tangential to internal diameter and gets whirling motion. It travels from one end of the tube to other end and is partially reflected back by the valve. The free and forced vortex, gives rise to hot stream and cold stream coming out of either end of the tube. The phenomenon of the heat transfer between two streams is complex because of variation of pressure inside the tube, three dimensional velocity vectors, formation of turbulent eddies etc. the change in the physical parameter also varies the performance of the tube to great extent.
Keywords: vortex tube, coefficient of performance, refrigerating effect, cold mass fraction
1. Introduction
Vortex tube is a device that separates compressed air into two streams simultaneously, separated streams comprises temperature differences at different ends of vortex tube with respect to inlet temperature.
Compressed air is introduced into a tube open at both ends through tangential inlet positioned about quarter of the tube’s length away from one end. A strongly swirling flow, vortex flow, results and the air proceeds along the tube. The outer regions of the flow are found to be warmer than the inlet air, while air towards the centre of the tube found to be cooler.
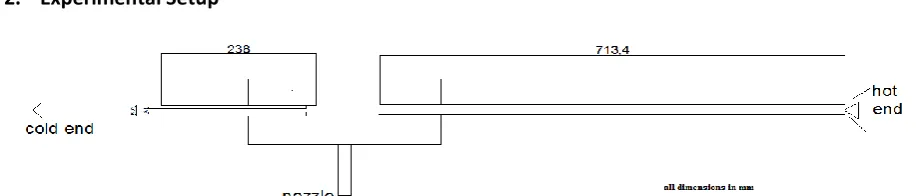
2. Experimental Setup
Counter flow vortex tube, which is made of U-P.V.C material, is used to study the vortex tube phenomenon. The main bush contains the orifice plate and the nozzle bush. The main tube and the cold pipe are fixed to the main bush at its either ends, the conical valve is placed at open end of the main tube. The thermocouple TH and TC are placed near the conical valve and orifice plate to measure the hot and the cold temperature of the air leaving the vortex tube. Air from the compressor is fed to main tube through nozzle. The nozzle diameter is varied such as 5.15mm, 4.12mm and 3.20mm to analyze its effect on the performance of the vortex tube. The air gets tangential entry in the tube. As it expands it gets swirl. Air travels towards the valve side end. The valve is having conical shape hence it can be adjusted to control the mass flow rate of the air, because of the partial opening of the valve some of the air escapes out and remaining is reflected back towards the nozzle through the core of the tube. The orifice at another end controls the back flow of the air. Cold side pipe do not have any effect on the performance of the vortex tube but just the guide the cold mass flow. The geometrical data of the vortex tube is as follows:
Inner diameter of the main tube (D)
19.5 mm
Length of the tube (50 D) 952.5 mm
Orifice diameter 5.0 mm
The literature review shows that tube works best in this range of 3 to 6 mm diameter of orifice. Certain modifications have been made in the design. The spiral chamber is as shown in figure. The hole is made tangential to the inner circle of the coupling.
3. Results and Discussion
From the observations we have to plot the graphs in following manner:
Temp. difference Vs Pressure Cold end temp. Vs Pressure Refrigerating effect Vs Pressure COP Vs Pressure
3.1 Temp. Difference Vs Pressure
Graph 3.1.1: Temp. Difference Vs Pressure (N=5.15 mm)
Graph 3.1.2: Temp. Difference Vs Pressure (N=4.12 mm)
0 5 10 15 20
0.5 1 1.5 2 2.5 3 3.5 4 4.5
Pressure(bar) Vs Th-Tc (°C )
Th-Tc
Th
-Tc
pressure nozzle dia 5.15mm
0 2 4 6 8 10 12 14 16 18
0.5 1.5 2.5 3.5 4.5
pressure(bar) Vs Th-Tc ( °C )
TH - TC ( °C )
pressure
Th
-Tc
Graph 3.1.3: Temp. difference Vs Pressure (N=3.20 mm)
3.2 Cold end temperature Vs Pressure
Graph 3.2.1: Cold temperature Vs Pressure (N=5.15 mm)
Graph 3.2.2: Cold temperature Vs Pressure (N=4.12 mm)
Graph 3.2.3: Cold temperature Vs Pressure (N=3.20 mm)
3.3 Refrigerating effect Vs Pressure
Graph 3.3.1: Refrigerating effect Vs Pressure (N=5.15 mm)
Graph 3.3.2: Refrigerating effect Vs Pressure (N=4.12 mm)
0 5 10 15 20
0.5 1.5 2.5 3.5 4.5
Pressure(bar) Vs Th-Tc (°C )
TH - TC ( °C )
pressure Th
-Tc
nozzle dia3.20 mm
0 10 20 30 40
0.5 1.5 2.5 3.5 4.5
pressure (bar) Vs Tc( °C )
cold end temp ( °C ) nozzle dia5.15mm
pressure TC
(
oC)
0 5 10 15 20 25 30 35
0.5 1.5 2.5 3.5 4.5
pressure (bar) Vs Tc( °C )
cold end temp ( °C ) nozzle dia4.12mm
pressure TC
0 5 10 15 20 25 30 35
0.5 1.5 2.5 3.5 4.5
pressure (bar) Vs TC( °C )
cold end temp ( °C ) nozzle
dia3.20mm
pressure TC
0 2 4 6 8 10 12 14
0.5 1 1.5 2 2.5 3 3.5 4 4.5
pressure (bar) Vs RE (KJ/Kg)
RE (KJ/Kg)
pressure
RE
nozzle dia 5.15mm
0 2 4 6 8 10 12
0.5 1 1.5 2 2.5 3 3.5 4 4.5
pressure(bar) Vs RE (KJ/Kg)
RE (KJ/Kg) nozzle dia
4.12mm
pressure
Graph 3.3.3: Refrigerating effect Vs Pressure (N=3.20 mm)
3.4 COP Vs Pressure
Graph 3.4.1: COP Vs Pressure (N=5.15 mm)
Graph 3.4.2: COP Vs Pressure (N=4.12mm)
Graph 3.4.3: COP Vs Pressure (N=3.20 mm) 4. Conclusion
Based on the experimental results following conclusions are drawn
1] The cold side temperature decrease with increase in inlet pressure,
2] The refrigerating effect increases with increase in inlet pressure.
3] There is variation in the cold fraction with increase in pressure. It suggests that there is optimum diameter of orifice.
4] The tube can be set in two positions either for maximum temperature drop or for maximum refrigerating effect. Maximum temperature drop does not give maximum refrigerating effect.
5] The COP of the tube is higher for nozzle dia.3.20 mm.
6] The lowest temperature recorded in the system is 22.3°C, when inlet pressure and ambient temperature was 5bar and 34.2°C.Nozzle diameter 4.12 mm.
7] Refrigerating effect, cold air temperature and temperature difference increases with increase in the inlet pressure.
8] The COP of the vortex tube shows variations with increase in the inlet pressure. Further increment in the inlet pressure, COP tends to increase.
0 2 4 6 8 10 12 14
0.5 1.5 2.5 3.5 4.5
pressure(bar) Vs RE (KJ/Kg)
RE (KJ/Kg)
pressure
RE
nozzle dia.3.20m m
0 0.01 0.02 0.03 0.04 0.05 0.06 0.07
0.5 1 1.5 2 2.5 3 3.5 4 4.5
pressure (bar) Vs COP
COP nozzle dia 5.15mm
pressure
C
O
P
0 0.02 0.04 0.06 0.08 0.1
0.5 1 1.5 2 2.5 3 3.5 4 4.5
pressure(bar) Vs COP
COP nozzle dia
4.12mm
pressure
C
O
P
0 0.02 0.04 0.06 0.08 0.1
0.5 1 1.5 2 2.5 3 3.5 4 4.5
pressure(bar) Vs COP
COP
pressure
C
O
P
5. References
1] Modification and experimental research on vortex tube by Y.T. Wu, Y. Ding, Y.B. Ji, C.F. Ma, M.C. G.
2] Experimental study of vortex tube by prof. Nitin b. Kardekar.
3] ‘The vortex tube as classical thermodynamic refrigeration cycle’ by Boye K. Ahlborn and Jeffery Gordon.
4] “Analysis of flow and energy separation in turbulent vortex,”, by R.G.Deissler and M.perlmutter vol 11 pp-173-191 pergmon press 1960.
5] “ Refrigeration and Air Conditioning” by C.P.Arora.
6] www.exair.com.
7] “Effect of orifice and pressure of counter flow vortex tube”, by J. Prabakaran, IJST, April 2010.
8] “Experimental study on the Ranque-Hilsch Vortex Tube”, by Chengming Gao, Ph.D Thesis.
9] “Effect of Diameter of Orifice and Nozzle on the performance of Counter flow Vortex tube”, by PRABAKARAN.J, IJEST Journal, 2010.
10] “Experimental investigation and exergy analysis of the performance of a counter flow Ranque-Hilsch vortex tube with regard to nozzle cross-section areas”, by K.Dincer, Elsevier Journal, April 2010.