Copyright2001 by the Genetics Society of America
Nonclinality of Molecular Variation Implicates Selection in Maintaining a
Morphological Cline of
Drosophila melanogaster
Julia Gockel,* W. Jason Kennington,* Ary Hoffmann,
†David B. Goldstein* and Linda Partridge*
*Galton Laboratory, Department of Biology, University College, London NW1 2HE, United Kingdom and†Centre for Environmental Stress and Adaptation Research, La Trobe University, Bundoora, Victoria 3083, Australia
Manuscript received October 17, 2000 Accepted for publication February 15, 2001
ABSTRACT
One general approach for assessing whether phenotypic variation is due to selection is to test its correlation with presumably neutral molecular variation. Neutral variation is determined by population history, the most likely alternative explanation of spatial genetic structure, whereas phenotypic variation may be influenced by the spatial pattern of selection pressure. Several methods for comparing the spatial apportionment of molecular and morphological variation have been used. Here, we present an analysis of variance framework that compares the magnitudes of latitudinal effects for molecular and morphological variation along a body size cline in Australian Drosophila populations. Explicit incorporation of the rele-vant environmental gradient can result in a simple and powerful test of selection. For the Australian cline, our analysis provides strong internal evidence that the cline is due to selection.
D
ROSOPHILA melanogaster populations from sev- whetherQstandFstmaintained proportionality in acom-parison of population pairs. This formulation allowed eral continents show a positive relationship
be-tween body size and latitude (Coyne and Beecham for population structure, reflected by the degree of mo-lecular and morphological difference between different 1987;Capyet al.1993;Imashevaet al.1994;van’t Land
et al.1999). The repetition of body size clines provides population pairs. For some situations, however, appor-tioning diversity withF-statistics is not ideal. For exam-evidence that they are due to selection as opposed to
population history. Body size clines in Drosophila, there- ple, in the case of clinal variation, we should like to include in our test the hypothesis of a specific environ-fore, present an attractive context for evaluating
meth-ods for detecting selection on the basis of internal evi- mental gradient (e.g., altitude or latitude) responsible for the spatial variation in selection pressure. Such a dence from single clines. Here, we describe a method for
determining if latitudinal variation in a trait (in this in- measure of “clinality” was used byBerryandKreitman (1993) to describe latitudinal variation of haplotype fre-stance body size) is a likely consequence of natural
se-lection, or, instead, of demographic history, the main quencies at the Adh locus. Similar to this approach, we provide a test for natural selection by comparing the competing hypothesis. We compare latitudinal effects
on microsatellite allele frequency and on wing area (a magnitudes of latitudinal effects for molecular and mor-phological variation along a body size cline in Australian trait highly correlated with body size) in populations of
D. melanogasterpreviously reported to show a latitudinal D. melanogasterpopulations. cline in body size in Eastern Australia (Jameset al. 1995,
1997).
ANALYSIS AND RESULTS
Previous studies (Prout and Barker 1993; Spitze
1993;LongandSingh1995;PodolskyandHoltsford In this study, we analyzed populations of flies collected 1995;Lynchet al. 1999) have employed a test for natural
at 11 different latitudes from a 2000-km north–south tran-selection that was developed byProutandBarker(1993).
sect along the east coast of Australia in January 2000 This test relied on a comparison ofFstvalues, based on (Table 1). One to four locations (0.005–35 km apart)
(neutral) molecular and (possibly adaptive)
morpholog-were sampled from each latitude. Latitudinal sites varied ical variation, denoted, respectively, Fst and Qst (Lande in spacing along the transect and were densely clustered
1992). In this approach, selection was implicated if
in a section (32.6–37.5⬚S) where the steepest slope of the confidence intervals forQstandFst differed.Long morphological change had been observed previously
andSingh(1995) generalized this approach by testing
(James et al. 1995). The southernmost samples were derived from the island of Tasmania (43⬚S) and were therefore necessarily more distant from their nearest
Corresponding author:Linda Partridge, Department of Biology, Gal- continental neighbor (37.5⬚S). Altitudinal differences ton Laboratory, Wolfson House, University College, 4 Stephenson
between populations were minimized by sampling at
Way, London NW1 2HE, United Kingdom.
E-mail: [email protected] coastal sites as close to sea level as possible. Isofemale
TABLE 1
Location, latitude, and the number of populations and isofemale lines measured for wing area, and wild females typed for microsatellite variation at each site
Wing area Microsatellites Latitude Longitude
Site Code (⬚S) (⬚E) Populations Lines Populations Lines
Cape Tribulation MEG 16.85 145.46 2 20 4 20
Townsville TOW 19.37 146.00 2 19 4 20
Rockhampton ROC 23.40 150.49 2 14 4 20
Coolangata COO 28.29 153.53 2 20 4 20
Belmont BEL 32.60 151.16 2 17 2 20
Picton PIA 34.11 150.34 1 10 1 20
Milton MIL 35.18 150.27 1 10 1 11
Termeil UPB 35.30 150.13 1 10 2 16
Melbourne KOC/YY 37.48 145.27 2 14 3 20
Hounville HUO 43.09 147.04 2 20 2 20
Tasmania SCR 43.04 147.04 2 18 2 20
lines were set up from wild-caught flies and, after two Molecular variation in these populations was as-sessed using 19 polymorphic microsatellite loci, distrib-to three generations in the laboradistrib-tory, lines were
cul-tured at a standard larval density (50 larvae per vial) at uted across the second and third chromosomes (Table 2; further information can be obtained from the microsatel-25⬚using methods described inJames et al. (1995). A
single vial was cultured for each isofemale line, and lite database at http://www.ucl.ac.uk/biology/goldstein/ mlist1.htm). Due to the fact that these loci were specifi-10–20 lines were cultured from each latitude. From each
vial, the right wings of five randomly selected individuals cally selected for a high number of repeat units, some markers show variances in repeat number that are un-of each sex were removed and the area was determined
using methods described inGilchristandPartridge usually high forD. melanogaster. Genotypes at these loci were scored from DNA extracted from individual wild-(1999).
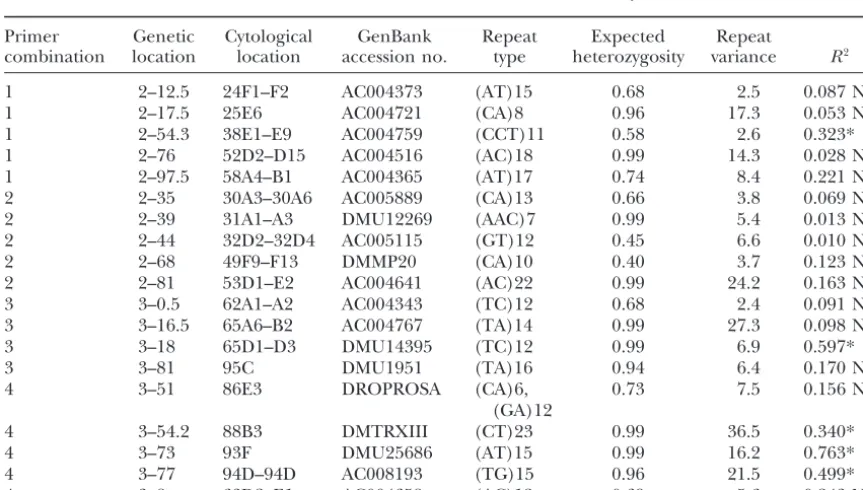
TABLE 2
Details of 19 microsatellite loci used in this study
Primer Genetic Cytological GenBank Repeat Expected Repeat
combination location location accession no. type heterozygosity variance R2
1 2–12.5 24F1–F2 AC004373 (AT)15 0.68 2.5 0.087 NS
1 2–17.5 25E6 AC004721 (CA)8 0.96 17.3 0.053 NS
1 2–54.3 38E1–E9 AC004759 (CCT)11 0.58 2.6 0.323*
1 2–76 52D2–D15 AC004516 (AC)18 0.99 14.3 0.028 NS
1 2–97.5 58A4–B1 AC004365 (AT)17 0.74 8.4 0.221 NS
2 2–35 30A3–30A6 AC005889 (CA)13 0.66 3.8 0.069 NS
2 2–39 31A1–A3 DMU12269 (AAC)7 0.99 5.4 0.013 NS
2 2–44 32D2–32D4 AC005115 (GT)12 0.45 6.6 0.010 NS
2 2–68 49F9–F13 DMMP20 (CA)10 0.40 3.7 0.123 NS
2 2–81 53D1–E2 AC004641 (AC)22 0.99 24.2 0.163 NS
3 3–0.5 62A1–A2 AC004343 (TC)12 0.68 2.4 0.091 NS
3 3–16.5 65A6–B2 AC004767 (TA)14 0.99 27.3 0.098 NS
3 3–18 65D1–D3 DMU14395 (TC)12 0.99 6.9 0.597*
3 3–81 95C DMU1951 (TA)16 0.94 6.4 0.170 NS
4 3–51 86E3 DROPROSA (CA)6, 0.73 7.5 0.156 NS
(GA)12
4 3–54.2 88B3 DMTRXIII (CT)23 0.99 36.5 0.340*
4 3–73 93F DMU25686 (AT)15 0.99 16.2 0.763*
4 3–77 94D–94D AC008193 (TG)15 0.96 21.5 0.499*
4 3–8 63D2–E1 AC004658 (AC)12 0.69 5.6 0.243 NS
type flies (Glooret al.1993). Per latitude, 11–20 flies were genotyped. Multiplex-PCR reactions were performed in prealiquoted plates (Advanced Biotechnologies, Surrey, UK), each containing 0.2 mmdNTP, 1.5 mmMgCl2, 75
mmTris-HCL, 20 mm(NH4)2SO4, 0.01% Tween 20, and
0.31 units of Taq polymerase. Primer combinations are listed in Table 2. One microliter each of DNA extract and primer mix were added for a final reaction volume of 13 l. Concentrations for each primer pair in the mix were adjusted and final concentrations in the PCR reactions ranged from 0.04 to 0.54g/l. All amplifica-tions were carried out in a GeneAmp PCR 9700 system (Applied Biosystems, Foster City, CA) using the follow-ing cycle profile: 94⬚, 4 min; (94⬚, 30 sec; 53⬚, 30 sec; 72⬚, 30 sec)⫻25; 72⬚, 8 min. For specificity and sensitivity of the PCR reaction, amplifications were prepared in the
Figure1.—Mean wing area and standard deviation of flies
following order: DNA was pipetted into the lids of 96- from each population and linear regression with latitude; (䊉) well plates (0.2 ml); primer mix was added to the preali- females,y⫽1.061⫹0.008x; (䊊) males,y⫽0.825⫹0.007x.
quoted PCR reaction mix; lids were attached, and the plate was centrifuged 1 min at 1000 rpm and placed in the preheated thermocycler (“hot start” PCR). Allele
similar latitudes that were collected in 1993 and main-sizes were scored on an automated sequencer (ABI 377)
tained in the laboratory as cage populations and found by using GeneScan 2.1 and Genotyper 2.5 software
(Per-that latitude explained 63.0% (males) and 64.2% (fe-kin-Elmer). The results of this survey revealed a high
males) of the variation among population means along degree of variability within loci. Expected
heterozygosi-the cline. The lower proportion of variation explained ties ranged between 0.40 and 0.99 and populations
by latitude in the earlier study may reflect the lower shared 44% of their alleles on average.
intensity of sampling over the latitudes where morphol-The relationship between population mean body size
ogy showed the greatest clinal variation. The proportion and latitude was assessed by employing a simple linear
of variation explained by latitude for the 19 microsatel-regression model (Y⫽b0⫹b1Lat⫹ε). To estimate the
lite loci ranged from 1% (AC005115) to 76% (DMU25686), proportion of the total microsatellite variation
ex-with a mean of 21% (Table 2). After correction for plained by latitude, frequencies of the most common
multiple comparisons, latitude explained a significant allele (MCA) were calculated for each locus and used
proportion of the total variation for loci DMU14395, as dependent variables in linear regression. Although
AC008193, AC004759, DMTRXIII, and DMU25686. only the MCA was scored for each locus it is still possible
To test the null hypothesis of morphological variation to detect clinality, as the majority of alleles at each locus
according to neutral expectations, the overall explana-are at such low frequency that they do not show a clinal
tory power of latitude for morphological and molecular pattern. In an analysis of an arbitrary set of three loci
variation was compared. Confidence limits for the mor-the inclusion of mor-the full set of alleles did not increase mor-the
phological coefficients of determination (R2) were
cal-apparent clinality. Distributions of the residuals resulting
culated for an empirical distribution obtained by boot-from these regression models (body size measurements
strapping. In each of 1000 iterations, observed residuals and MCA frequencies) did not show deviations from
from the linear model were drawn at random and used to normality (Kolmogorov-Smirnov test, allP⬎0.05). All
calculate new regression coefficients. Upper and lower regression models were analyzed using the software
pack-95% confidence limits (CLs) were determined for both age STATISTICA (5.5 A; StatSoft, Tulsa, OK). Nested
morphological datasets (males and females) and the analysis of molecular variance (AMOVA) was carried out
molecular markers. A total of 1000R2values over
lati-using the software package ARLEQUIN (version 2.0;
tude were obtained for each of 19 loci. Finally, mean Schneideret al. 2000).
R2values over all loci were calculated and 95% CLs were
Apportioning variances due to latitude revealed highly
determined for these 1000R2means. The upper CL for
contrasting results between the molecular and
morpho-the microsatellite R2 was 0.28. In contrast, the lower
logical data. The amount of variation explained by
lati-CLs for wing area were considerably higher in both sexes tude for wing area was 81 and 82% (P⬍0.001) for males
(females, 0.75; males, 0.76). AMOVA revealed 1.95% of and females, respectively. Flies from extreme northern
variation between populations that were grouped by populations were typically 15% (3–4 standard deviations)
latitude. In an analogous analysis, 56% (females) and smaller than those from the southernmost population
56.5% (males) of the total wing area variation were (Figure 1). These results can be compared with the
envi-ronmental gradient (in this case latitude) had a much particularly useful for this kind of study. If a trait is in-fluenced by the environmental gradient, while the mi-greater impact on the distribution of morphological
compared to molecular variation. The data also confirm crosatellites are primarily influenced by demographic fac-tors such as migration and colonization history, then we the presence of the body size cline in two independent
would expect the explanatory value of the environmental samples collected 7 years apart.
gradient to be statistically distinguishable for the two types of data. However, five loci (DMU14395, AC008193, AC004759, DMTRXIII, and DMU25686) showed
signif-CONCLUSIONS
icant variation due to latitude. It will be interesting to The test for natural selection along an environmental see if one or more of these loci are linked to a quantita-cline, suggested byProutandBarker(1993) and later tive trait locus associated with changes in body size. modified by Longand Singh(1995), was based on a Clinality of markers such as observed for ACO04759 comparison of population structures between quantita- could be due to linkage disequilibrium with a linked tive characters, on which selection may act, and molecu- quantitative trait locus (QTL) that it is under clinal lar markers that are assumed to evolve at a neutral rate. selection. In this case one would expect a window of However, this method does not explicitly incorporate clinality involving multiple markers surrounding a QTL. the relevant environmental variable. The difference be- The expected size of such a window of clinal markers tween the methods can be illustrated by an example in would depend on many factors, including the pattern which we imagine a sampling regime with spatially clus- of linkage disequilibrium in the founding population tered populations along a gradient, which might reflect and the strength and timing of clinal selection, and is the situation of most field collections.QstandFstvalues impossible to predicta priori. Nonetheless, the
observa-from all populations would then contribute equally to tion of clinality for multiple closely linked markers would the dataset. However, for selection pressures that change strengthen considerably the case for a linked QTL under systematically along a cline, neighboring populations are clinal selection. This could be the case for loci DMU25686 predicted to be more similar to each other than to and AC008193, which are located in close proximity on distant ones. We expect the greatest mismatches be- the third chromosome (cytological locations 93F and tween the molecular and morphological diversity for the 94D, respectively).
greatest separations along the environmental gradients, Variation along the cline can be explained by two al-exactly as observed in this study. For the example of ternative hypotheses: First, both morphology and molec-latitudinal variation in body size in eastern Australia, ular variation may have been shaped by demographic populations were not sampled at equal distance, but processes, including the colonization process, indepen-more densely in the south, and with the natural gap dent of any selective effects on the phenotypic variation. between the southernmost continental and Tasmanian Second, the morphological variation may have been sites. To account for this gradually varying dependency shaped by selection, in which case it would not be ex-of samples within the dataset, one should test for the pected to be correlated with molecular variation that is influence of the environmental variable (in this case influenced only by demography. On the basis of the latitude) on the morphological and molecular variation clear difference in variance explained by the environ-between populations. By investigating size changes mental gradient between molecules and morphology, along a predefined latitudinal transect we add apost hoc we reject the first hypothesis. It should be noted,
how-component to our statistical analysis. However, the main ever, that rejecting a common demographic explana-focus of this study was to carry out two specific tests: tion for both the molecules and the morphology does First, is there a significant relationship between the mor- not rule out a nonequilibrium configuration of the mo-phological trait and the environmental gradient and, lecular data. In particular, analyses of genetic structure second, is there a relationship with neutral molecular along the cline show some support for at least two differ-markers along the same gradient? Hence, we do not entiated populations, which could reflect multiple colo-address the question of whether this trait is under direct nization events (data not shown).
selection pressure. Future work is needed to clarify We were able to show that the magnitude of the mor-whether body size is a direct target of selection or geneti- phological cline and its shape has been conserved over cally correlated with another trait under direct selec- a time period of at least 7 years. Even local variations tion. As the main focus of this study is a comparison of such as the slight increase in body size at the sample the proportion of variation explained by an environ- site in Bowen (20.01⬚S) in the 1993 sample are rediscov-mental gradient between two different sets of data, we ered in the recent collection at Townsville (19.37⬚S). deliberately chose a simple linear regression model. Although population fluctuations or colonization pat-However, to describe the shape of the cline in more terns along the cline are unknown, we conclude that detail, different slope-fitting models could be employed. the overall evolutionary response is not only predictable Microsatellites provide high resolution of population (Huey et al. 2000) but also well conserved over long
in wing length in Eurasian natural population ofDrosophila
melano-We thank Scott D. Pletcher for help with the bootstrap program. gaster.Heredity72:508–514.
This work was supported by Natural Environment Research Council James, A. C., R. B. R. AzevedoandL. Partridge, 1995 Cellular basis grant GST/02/1872. and developmental timing in a size cline ofDrosophila melanogaster.
Genetics140:659–666.
James, A. C., R. B. R. AzevedoandL. Partridge, 1997 Genetic and environmental responses to temperature ofDrosophila melano-gasterfrom a latitudinal cline. Genetics146:881–890.
Lande, R., 1992 Neutral theory of quantitative genetic variance in LITERATURE CITED
an island model with local extinction and colonization. Evolution
Berry, A., andM. Kreitman, 1993 Molecular analysis of an allozyme 46:381–389.
cline: alcohol dehydrogenase in Drosophila melanogasteron the Long, A. D., andR. S. Singh, 1995 Molecules versus morphology: east coast of North America. Genetics134:869–893. the detection of selection acting on morphological characters
Capy, P., E. Plaand J. R. David, 1993 Phenotypic and genetic along a cline inDrosophila melanogaster.Heredity74:569–581. variability of morphometrical traits in natural populations ofDro- Lynch, M., M. Pfrender, K. Spitze, N. Lehman, J. Hickset al.,
sophila melanogasterandDrosophila simulans.1. Geographic varia- 1999 The quantitative and molecular genetic architecture of a subdivided species. Evolution53:100–110.
tions. Evolution25:517–536.
Podolsky, R. H., andT. P. Holtsford, 1995 Population structure
Coyne, J. A., andE. Beecham, 1987 Heritability of two
morphologi-of morphological traits in Clarkia dudleyana.I. Comparison of cal characters within and among natural populations ofDrosophila
FSTbetween allozymes and morphological traits. Genetics140:
melanogaster.Genetics117:727–737.
733–744.
Gilchrist, A. S., and L. Partridge, 1999 A comparison of the
Prout, T., andJ. S. Barker, 1993 Fstatistics inDrosophila buzzatii: genetic basis of wing size divergence in three parallel body size
selection, population size and inbreeding. Genetics134:369–375. clines ofDrosophila melanogaster.Genetics153:1775–1787.
Schneider, S., D. RoessliandL. Excoffier, 2000 Arlequin: A
Soft-Gloor, G. B., C. R. Preston, D. M. Johnson-Schiltz, N. A. Nassif,
ware for Population Genetics Data Analysis, Ver. 2.000. Genetics
R. W. Philliset al., 1993 Type I repressors ofP-element
mobil-and Biometry Lab, Department of Anthropology, University of ity. Genetics135:81–95.
Geneva.
Goldstein, D. B., G. W. Roemer, D. A. Smith, D. E. Reich, A.
Spitze, K., 1993 Population structure inDaphnia obtusa: quantitative
Bergmanet al., 1999 The use of microsatellite variation to infer genetic and allozymic variation. Genetics135:367–374. patterns of population structure and demographic history in a van’t Land J., P. vanPutten, B. Zwaan, A. KampingandW. vanDel-natural model system. Genetics151:797–801. den, 1999 Latitudinal variation in wild populations ofDrosophila
Huey, R. B., G. W. Gilchrist, M. L. Carlson, D. BerriganandL. melanogaster: heritabilities and reaction norms. J. Evol. Biol.12: Serra, 2000 Rapid evolution of a geographic cline in size in 222–232.
an introduced fly. Science287:308–309.