Multi-Axis Loading Test on RC Shear Walls
Overview and Outline of Two Directional Horizontal Loading Test
Terazaki Hiroshi 1), Kitada Yoshio 1), Nishikawa Takao 2), Takiguchi Katsuki 3), Watanabe Hideyoshi 4), and Korenaga Takeyoshi 4)
1) Nuclear Power Engineering Corporation (NUPEC), Seismic Engineering Center, Japan 2) Tokyo Metropolitan University, Japan
3) Tokyo Institute of Technology, Japan
4) Taisei Corporation, Technology Center, Japan
A B S T R A C T
Nuclear Power Engineering Corporation (NUPEC) has been conducting a project entitled "Model Tests of Multi-Axis Loading on RC Shear Walls" to clarify the elasto-plastic characteristics of an RC seismic shear wall, and to develop a method of evaluating restoring force characteristics under multi-directional seismic loading conditions. This paper provides a summary of the two-directional horizontal loading test, which was performed as a part of the project from fiscal 1999 to 2001. Shear wall specimens of box type and cylinder type were tested by applying orthogonal horizontal loads in the specimens X- Y directions. The load applied in each X and Y direction for three box type specimens forms patterns of rectangular, cross and diagonal cross. For the cylindrical shear wall, a rectangular form of load was applied in the X-Y plane.
I N T R O D U C T I O N
In the current seismic design of nuclear power plant (NPP) buildings in Japan, seismic design loads in the two orthogonal, horizontal directions are obtained independently by seismic response analyses, whereas actual seismic forces jolt the buildings in three directions simultaneously. Therefore, it is important to grasp the seismic response characteristics of an NPP building for three-dimensional earthquake excitation up to the NPP building ultimate state to evaluate the seismic margin properly. Nuclear Power Corporation (NUPEC) has therefore been conducting a project entitled "Model Tests of Multi-Axis Loading on RC Shear walls" since 1994 to clarify the effects of multi-directional forces on the ultimate strength of reinforced concrete (RC) seismic shear walls under multi-directional loading. The project is commissioned by the Ministry of Economy, Trade and Industry (METI) of Japan. In the test, we firstly accumulate the static and dynamic test data by the multi-directional loading test, and secondly we develop the evaluation method of restoring force characteristics of an RC seismic shear wall subjected to multi-directional dynamic loads. The project consists of a series of five tests. Three of them already completed are the element test for the RC shear plates [1][2], diagonal loading test for box type RC shear walls [3][4], and the simultaneous horizontal and vertical loading test for box-type RC shear walls. The other tests currently on-going are the horizontal loading test for box type and cylindrical RC shear walls and Dynamic loading test for box type and cylindrical RC shear walls. This paper provides a summary of the two directional horizontal loading tests, which were categorized a static test, performed in fiscal 1999 and 2000.
TEST C O N D I T I O N S
Test Specimens
The shape of shear walls and loading patterns are the major parameters of the test. Four specimens were identified by the name, SB-B-01, box type for the rectangular loading test, SB-B-02; box type for the cross loading test, SB-B-03; box type for the diagonal cross loading test, and SB-C-01; cylindrical type for the rectangular loading test. Table 1 shows the specimen names and their test parameters. Fig. 1 and 2 show the shapes and dimensions of the test specimens of the box type and the cylindrical RC shear walls. The shear wall thickness of each specimen is 75mm. The loading points are the center of the loading slab at 1200mm from the top of the base slab, and the clear span height of the shear wall is 1000mm. The width of shear wall of the box type specimen is 1,575mm. The shear wall diameter of the cylindrical wall is 1910mm, which was determined to have nearly the same effective shear area (and nearly the same ultimate shear strength) of that of the box type specimen. So the shear span ratio of each type of specimens are M/Qd=0.8 (box type) and M/Qd=0.63 (cylindrical type), respectively. Fig. 3 and 4 show the reinforcement arrangement in the shear walls. The reinforcing bars of D6 (6 milimeters in diameter) are deployed in the vertical and transverse directions with double-fold in 70mm pitch except for the corner part of the box type wall. The anchorage length of the vertical reinforcing bar is 300mm (=50d) at the upper part (within the loading slab) and 500mm at the lower part (within the base slab). Horizontal reinforcing bars placed both inside and outside of each wall are lapped at the joint part with length longer than 210mm (=35d). The wall-reinforcement ratio is approximately 1.2% for both types of specimen. Pea gravel concrete with coarse aggregate (maximum dimension of 10mm) is used for the wall part of the specimen. Table 2 shows the concrete material test results at the tested time. Table 2 shows material test results of concrete. The concrete strength of the specimens, SB-B-01 and SB-B-02, were about 15% higher than the others, because they were fabricated four months earlier than the other specimens. Table 3 shows the material test result of the reinforcing bar
SMiRT 16, Washington DC, August 2001 Paper # 1274
(D6).
Loading Setup
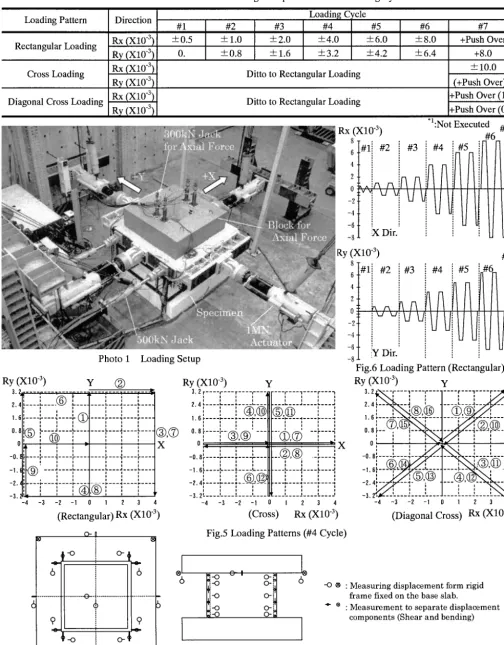
The loading setup is shown in photo 1. The specimens are fixed on the test floor of a laboratory with PC steel bars. One directional horizontal shear force is applied by a set of push-pull 1MN actuators, which are mounted on both sides of the loading slab. Such forces are applied both in the X and Y directions, respectively. Furthermore, a couple of torsion forces are applied by two 500kN jacks to prevent rotation of the loading slab in the X-Y plane. The axial force is applied by four 30kN jacks with PC steel bars through a block installed to deploy axial force, which is installed on the upper part of the loading slab. The axial stress applied is ov=l.47MPa. This axial stress is determined by taking into account the value applied to the RC shear wall at the lowest story of actual NPP buildings.
Loading Pattern
As shown in Table 1, we adopt three types of loading procedure, i.e., a rectangular loading, a cross loading and a diagonal cross loading for three box type specimens, and a rectangular loading for the cylindrical specimen. These loading procedures are determined by considering the results of seismic response analysis performed by using typical earthquake ground motion records in three directions. The shape of response acceleration orbit of a structure can be represented typically as the combination of a circular or elliptical orbit and a radial orbit. The rectangular and cross loading patterns are determined by simplifying the acceleration orbit to be a circular or elliptical orbit and a radial orbit respectively as for the static loads to be applied the static load in the testing. In order to confirm whether these loading patterns are effective or not, pre-test analyses [5] using three-dimensional non-linear FEM programs were carried out in fiscal 1999.
In the test runs, the applied load is controlled by the deformation angles, Rx and Ry. These angles are calculated from lateral displacements Dx and Dy measured at the bottom of the loading slab by dividing by the height of the shear wall (=1000mm: clear height of wall). Table 4 summarizes maximum amplitudes of deformation angles at each loading cycle in both directions of X and Y for three types of loading. In each loading cycle peak, a ratio of the maximum amplitude of Rx to that of Ry for all loading patterns are controlled to be Rx : Ry = 1.0 : 0.8 to clarify the effect of each directional load on the damage and/or severe deformation of the specimen.
Fig. 5 shows typical loading procedures (path) by exemplifying cycle #4 for each of the loading patterns. Fig. 6 shows time histories of the loads for the rectangular loading test applied in the axes of loading directions X and Y. The loading at cycle #1 is the loading cycle to grasp initial stiffness of the specimen in the X direction.
The rectangular loading produces a rectangular orbit, and it enables us to examine the effect of the orthogonal loading not only on the shear wall damage but also on the orthogonal deformation. On the other hand, the cross loading pattern produces a radial response, which enables us to study the orthogonal loading effect on shear wall damages. The rectangular loading is thought of as a one of the most severe two directional loading patterns for RC shear walls. Therefore, the rectangular loading will be effective to check adequacy of a nonlinear analysis code, which is designed to analyze a multi- directional loading problem. The diagonal cross loading pattern is considered to be a variation of cross loading. At the peak load point of each loading cycle, the difference of the loading path will be examined by comparing the test results of diagonal cross loading with those of the rectangular loading.
Measurement Plan
The horizontal load applied to a specimen in each of directions X and Y is measured with a load cell attached to the actuator. Specimen deformation is measured by specially equipped rigid frames, which are installed on the base slab at four corners of the specimen walls and by displacement gauges attached to bolts buried in the specimen. Fig. 7 shows the positions of deformation measuring points. To separate deformation components, vertical displacements of the wall are measured at six levels in the four corners of the box type shear wall and in four corners of the base mat around the cylindrical wall.
The strains on shear wall reinforcements in the horizontal and vertical directions were measured on horizontal and vertical bars at the middle height of each wall. The vertical strains on the vertical bar were also measured on the vertical bars at the boundary of the base and top slabs and the shear walls.
TEST RESULTS
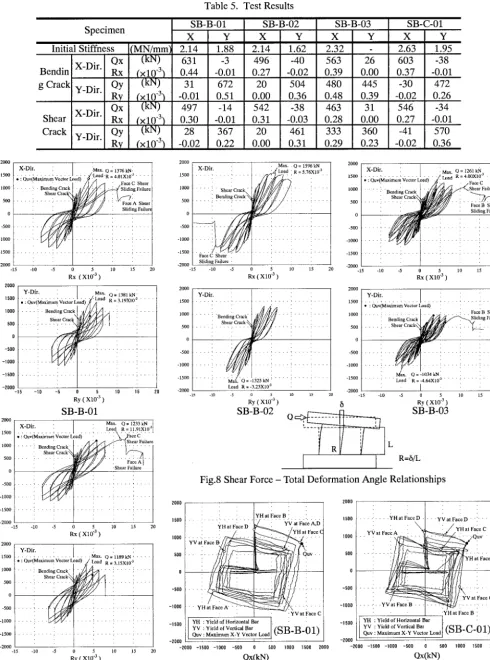
To identify the four faces of box type shear wall specimens, the faces of the wall are named A and C for the X direction shear wall, and B and D for Y direction shear wall (see Fig. 10 of crack pattern). For convenience, each quarter portion of the cylindrical wall is also given the same naming as that of the box type shear wall specimen. In this paper, each shear force in X and Y direction is called Qx and Qy respectively. Furthermore, in order to consider the combined shear force of Qx and Qy in the X-Y loading plane, a vector load of Qv is introduced. Table 5 summarizes the initial stiffness and the first crack occurrence loads for both bending and shear cracks of each specimen.
Shear Force - Shear Deformation Angle Relationships
occurrence points of bending and shear cracks and maximum load are also shown in the figure. Both bending and shear cracks in the X and Y directions occurred under the deformation angles smaller than 5xl03radians. The test results of each specimen are summarized as follows;
• SB-B-01 (box wall for the rectangular loading): Maximum shear forces in the X and Y directions were Qux=1376kN (Rx=4.01xl0 -3) and Quy=1381kN (Ry=3.19xl0 -3) respectively. After reaching the maximum vector force of Quv=1600kN, which occurred simultaneously with the maximum value of Qux, the shear force decreased gradually with the applied load increase. In loading cycle #7, shear slip failures occurred in face C wall at Rx =11.1x10 3 and in face A wall at Rx =14.6
X10 3 together with the rapid decrement in shear force.
• SB-B-02 (box wall for the cross loading): Maximum shear forces in the X and Y directions were Qux=1596kN (Rx=5.76x10 3) and Quy=-13251kN (Ry=-3.23x10 -3) respectively. The maximum vector force Quv is equivalent to Qux because of the cross loading nature. This specimen failed in loading cycle #7 in the face C wall at Rx = -9.14x10 3. After the failure, rapid shear force decrement occurred.
• SB-B-03 (box wall for the diagonal cross loading): Maximum shear force in the X and Y directions were Qux=1261kN (Rx=4.00xl0 3) and Quy=-1034kN (Ry=-4.64x10 3) respectively, The maximum vector force was Quv=1588kN which occurred simultaneously with the maximum value of Qux. In loading cycle #7, shear force began to decrease at the total deformation angle of Rx=10.89x10 3 together with the shear crack beginning to open widely in face C wall. The shear force decreased rapidly after the occurrence of the shear slip failure in face B wall at Rx = 16.36x10 -3 and Ry=13.14x10 -3. • SB-C-01 (cylinder wall for rectangular loading): Maximum shear force in the X and Y directions were Qux=1223kN
(Rx=ll.91xl0 3) and Quy=1189kN (Ry=3.15xl0 3) respectively. In the last loading cycle, #7, the shear failure occurred in the face C wall at Rx=12.91x10 -3, and the shear slip failure occurred in the face A wall in the middle height at Rx=17.39x10 3. After the failure, rapid shear force decrement occurred.
As for a feature of the restoring force loop obtained by the rectangular loading (SB-B-01 and SB-C-01), shear force on the unloading curve decreased remarkably. For this reason, it is considered that the crack closing path (=unloading path) in X-Y loading plane is different from the crack opening path (=loading path) in the case of rectangular loading, thus additional energy consumption were taken as compared to the other loading case, where the loading and unloading process took the same loading path and cracks opened in the loading process were closed without any additional energy consumption.
Qx-Qy Relationships
Fig. 9 shows the relationships between orthogonal in-plane lateral shear forces of Qx and Qy extracted from the test result of rectangular loading, SB-B-01 and SB-C-01. The occurrence points of reinforcing bar yielding and that of maximum value of Qv are also shown in the figure. The orbit tends to be convex for the box type wall and to be concave for the cylindrical wall.
Crack Pattern
The final crack pattern of each specimen is shown in Fig. 10 by unfolding all four faces A through D. Under the horizontal two directional loading, each wall alternatively plays the role of web and flange according to the change of dominant loading axis. Therefore horizontal and shear cracks appeared together in all faces of specimens. In the test results of three box type specimens, major differences in generated crack patterns appear in horizontal cracks (bending crack). In the crack pattern of SB-B-02 of cross loading, horizontal cracks distributed to all parts of wall faces B and D. For the rectangular loading and the diagonal cross loading, web wall resists to the shear force and the flange wall resists the axial force generated in the wall. For this reason the positive and negative diagonal shear crack combined together to form an edge of a saw. Thus combined cracks became dominant instead of horizontal bending cracks under the rectangular and the diagonal cross loading cases.
Envelope Curves
We superimposed the envelope curves of the restoring force characteristics for three patterns of loading for the box type specimens in each X and Y direction respectively. The result is shown in Fig. 11. The results include a 15% difference of concrete compression strength among the specimens. From the figure, we can find out that the envelope curve of the diagonal cross loading result is similar to that of rectangular loading test result. The fact implies that a loading path (process) of multi- axis loads applied to shear walls does not affect the restoring force characteristics. Therefore our hypotheses that the rectangular loading might be the most severe case had been denied by the test results. It should be noted that the envelope curve of the cross loading case which does not have an orthogonal loading component became lager than that of other loading test results.
Deformation Components
Maximum Shear Force in the X-Y Plane
Maximum vector forces of Quv for all test specimens are shown in Fig. 13 of the X-Y loading plane. To eliminate the difference in concrete strengths, Quv values are normalized by one directional maximum shear force value
cQJEAG
calculated based on JEAG[6], a Japanese design guideline for NPP structures and components. The test results of the diagonal loading test for SD-08-00, SD-08-26 and SD-08-45 specimens (the same size specimen tested by the diagonal loads in 0, 26.4 and 45. degree to the normal axes) [3][4] together with a referencing Quv=l.0 arc. From the figure, for all test results of box type specimens, they have closed but somewhat larger values than the referencing arc. This means the influence of the loading path is not so effective on an absolute value of Quv.C O N C L U D I N G R E M A R K S
In this paper, we introduced interim results of the horizontal two directional loading tests. The brief summaries of the results are as follows. (1) The diagonal cross loading result is similar to that of the rectangular loading result in the envelope curves of restoring forces, Qx-Rx and Qy-Ry. This means a difference of the loading path does not influence the envelope curves. (2) In the case of cross loading which has no orthogonal loading component, the envelope curve becomes lager than in the case of the other loadings. (3) In regards to the absolute value of maximum vector force Quv in the X-Y loading plane, test results of all box type specimens are near the value of test results of the diagonal loading tests. In fiscal 2001-2003, NUPEC has further test plans on this project, i.e. two directional horizontal loading tests (two specimens) and multi- directional shaking table tests (three specimens). Using the accumulated results of all tests, the evaluation method of restoring the force characteristic of an RC seismic shear wall subjected to multi-directional loads will be evaluated comprehensively in fiscal 2002-2003.
A C K N O L W D G M E N T S
Technical issues presented in this paper have been discussed in the advisory committee on the "Model Test of Multi-axis Loading on RC Shear Walls" project established by NUPEC (Chairperson: Professor Dr. T. Nishikawa, an author). The authors wish to express thanks to all the committee members for their valuable opinions on discussions in the meetings. N O M E N C L A T U R E
d Dx,Dy M/Qd Rx,Ry
cQJEAG
Quv
= equivalent area of reinforcing bar
= total lateral deformation in X,Y direction measured at bottom level height of loading slab = shear span ratio (calculated from geometrical shape of specimen)
= total lateral deformation angle in X,Y direction = maximum shear force calculated by JEAG[6] = maximum vector force in X-Y loading plane Qux,Quy = maximum lateral shear force in X,Y direction
Qv = vector force in X-Y loading plane, Qv = sqrt( Qx 2 + Qy2 ) Qx,Qy = lateral shear force in X,Y direction
Ov = vertical(axial) stress of shear wall
REFERENCES
1. Kitada, Y., Nishikawa, T., Maekawa, K., Umeki, K., Yamada, M. and Kamimura, K., "Shear Behavior of Pre-Craked RC Plates Subject to Combined Axial and Shear",SMiRT-15, 1999, H08/2, pp.VI-325 - 332.
2. Habasaki, A., Kitada, Y., Nishikawa T., Maekawa K., Umeki K., Yamada M. and Kamimura K. et al, "Shear Transfer Mechanizm of Pre-Cracked PC Panels", 12WCEE, 2000, No.1493.
3. Habasaki, A., Nishikawa, T., Takiguchi, K., Kitada, Y. and Torita, H.,"Multi-Axial Loading Test for RC Wall of Reactor Building",SMiRT-15, 1999, H03/3, pp.VI-107 - 114.
4. Habasaki, A., Kitada, Y., Nishikawa T. Takiguchi K. and Torita H., "MULTI-DIRECTIONAL LOADING TEST FOR RC SEISMIC SHEAR WALLS", 12WCEE, 2000, No.454.
5. Ono, H., Yoshimura M., Maekawa K., Kitada, Y. and Oguro, E., "Pretest Analysis of Shear Walls Subjected to Horizontal Two-directional Loading", SMiRT-16,2001
6. Japan Electric Association, "Technical Guidelines for Aseismic Design of Nuclear Power Plants", JEAG-4601-1991 Supplement, 1991.
Table 1. Test Specimens Specimen
SB-B-01 SB-B-02 SB-B-03 SB-C-01
Wall Shape
Box Type
Cylindorical Type
M/Qd
0.80
0.63
Loading Pattern Rectangular Loading__._
Cross L o a d i n g . . . ~ Diagonal Cross Loading
Rectangular Loading
Loading Slab
i Wall
!
Ii
~50o
Base Slab 2700
(mm)
75
~5oo
I
2700
n
I
2700
Loading Slab ] ,~-w Wall
1910
Base Slab 2700
Fig.1 Box Type Wall Specimen
Loading Slab
iiiiiiiiii /
l l ' ' ' L , t : u l[ Vertical Bar
i iiiii!ii l 0on,a, ar
.
i !
Base Slab
~°Ar °
3 ¢
3 {
1 r s
\Horizontal Bar D6-@70
',Vertical Bar D6-@70 Box Type
Fig.2 Cylindrical Type Wall Specimen
zontal Bar D6-@70
~ / / "Vertical Bar D6-@70
Cylindrical Type
15T5 ! (Unit:m)
Fig.3 Bar Arrangement (Box type)
Fig.4 Bar Arrangement (detail)
Table 2. Material Property of Concrete
Item Unit Specimen
SB-B-01 SB-B-02
Young's modulus : Ec Gpa 30.7 30.7
Compressive strength : ob Mpa 41.3 39.7
Peak Strain" ~c ~t 2060 2022
Poisson's Ratio:v 0.18 0.17
Tensile Strength .1 • Ft Mpa 1.74 1.70
"1: Calculated Using Eq. Ft = 0.73"0.20"ob 2/3
Table 3. Material Property of Reinfocing bar
SB-B-03 32.0
SB-C-01 31.9
34.9 34.3
1817 0.19 1.56
1896 0.20 1.54
Item Unit D6 (at Wall )
Yield Strength : oy Mpa 375
Young's Modulus :Es Gpa 200
Tensile Strength : Fb Mpa 493
Tensile Strain at Flucture % 28
t t 3
Loading Pattern
Rectangular Loading
Cross Loading
Diagonal Cross Loading
Ry ( X l 0 "3)
3.
2. ' I . L . ~ ' , .
', I , I
1 • 'I i i . . . . i
, "I r
i i i
O. 't"~ t.___, . . . . ' @ '
! !
; ; I
! i
-0 . . . I 1 I . . .
(~) ---'~ -t
! i
._. ;. __" _-_
- 3 . ' ' '
- 4 - 3
Table 4 Maximum Deformaion Angle Amplitude for Each Loading Cycle
7
Direction Rx (Xl0 3) Ry (X 10 3) Rx (Xl0 3) Ry (Xl0 -3) Rx (Xl0 -3)
Ry ( X l 0 3 )
#1 +0.5
Photo 1
.
Loading Setup
#2 ---1.0
Y @
r - - - r - - - ~ ' .... ;--~
#3 +---2.0
Loading C]lcle
#4 #5 #6
---4.0 ---6.0 ---8.0 + 0.8 +--- 1.6 --- 3.2
Ditto to Rectangular Loading
#7 +Push Over
+4.2 +6.4 +8.0
+ 10.0
Ditto to Rectangular Loading
R x ( X l 0 "3)
® , ~
(+Push Over) *] +Push Over (1.0) +Push Over (0.8) *1:Not Executed
#6 #7~
8 6 4 2 0 -2 -4 -6 -8
#1 #2 #3 #4 i # 5
N Dir. i i
.... L " .... L
I I I
.... ~. • .... •
I I I
. . . I. .i . . . . I. , i i , , i I , I
I I I
-i- 4 ....
' I I
I
l i , l , ,
. . . . i -
® ! , ,
- 2 - 1 0 1 2 3 4
(Rectangular) Rx (Xl0 "3)
t
~-o o - ~
u--g
o-0 , 0
- o ! 0 o -
0
$
X
Ry (X10 -3) y
3 . 2 r . . . . r - - - r . . . . r - - r - - - 1 . . . . r - - l
: : : II II II I I
. ~. _ a ,. . . , - - - - . , . . . . , - - - - . . , . . . . , - - - - . . ,
i ' i
I I ' I
1.6 ; .... r . . . ", ... , ," .... ,
i i i i i i i i
uo"."' . . . ' '
r . . . . f - ' @ @ . . . ( " ~ ) m - - r - - - ~
0 I . . . .. .. .. .. .. .. ..
4 1
. . . . ® ® ,-~ ',
- 0 8 ' - - • - - i - ' . . . . 1 " - - - ' ' i - . . . ., . . . -,
i i i i i i i i
i i i i
. ! , . . . . ,_ L : ._.___J
-1 6 . . . . ! - - - , . . . , - - - , - - , ,
-~ ~i . . . . " . . .i . . . : i - - - i : . . . . : i - - - - . - i :
i i i i i
i i i i r I I I I I
- 3 . 2 ' - - ' ' ' . . . ' ' '
- 4 - 3 - 2 -1 0 I 2 3 4
(Cross) Rx (Xl0 "3)
Ry (Xl0 -3)
8
#1 #2 #3 #4 #5
6
4
- 2
- 4
-6 iY Dir.
- 8
#7
u
X
Fig.6 Loading Pattern (Rectangular)
Ry (X10 3) y
3 . 2 k , ~ q - r - - - ~ ' . . . . r - - l . . . . r - - - I r 7 2
. . . ~'---~,"--! ~ . " - - ~ - - ~ c ~ - - , x . - ~ ~ ~ ~ ' ' x / , ,
' ° i--~-dg'%~,,"-- ~ i
O : : : '. \ , _ ~ , ' , , , " I '. I I v
~i . . . . , : - - - i - - . 2 / / - ~ ~ - - , : . . . . :----"
- 0 . i i i
,
t
1---
- 4 - 3 - 2 -1 0 1 2 3 4
(Diagonal Cross) Rx(x10.3) Fig.5 Loading Patterns (#4 Cycle)
6 6
- 0 ® • M e a s u r i n g d i s p l a c e m e n t f o r m r i g i d
frame fixed on the base slab.
÷ ® • Measurement to separate displacement components (Shear and bending)
oVcdmc. Initial Stiffness
X-Dir. Qx
Bendin Rx
g Crack Y-Dir. QY Ry
X-Dir. Qx
Shear Rx
Crack Y-Dir. QY Ry
(MN/mm) (kN) ( x l 0 "3)
(kN) ( x l 0 "3)
( ~ )
( x l 0 -3)
(ki)
( x l 0 -3)
X - D i r . • .Max. Q = 1376 kN.
1500 • : Ouv(Maximum Vector Loadi "f~'/:~ L ° a d ' R = 4"01X10"3 • ' / I / I . . a ' Face C Shear 1000 . . . . ! - Bending C r a c k - d / / } / ' - ~ 1. j " : ~ - q / ' S l i d i n g Failure
500 : : ' ' ' " ~.j~,~__//ff" / / ":. - " F a ~ A Shear : : ~ ~ / / . ~ / / : Sliding Failure 0
-500 . . . . . .
-10O0 : : :
. , .
-1500 •
-2000
-15 -10 -5 0 5
R x ( X 1 0 "3 )
2000 1500 1000 500 0 -500 -1000 -1500 -2000
Y - D i r . : Max. Q '1381 kN :
. . . . - Z Load = -3 • : Quv(Maximum Vector Load)/~f ~. R = 3.19X10 .
. . . . : - - B e n d i n g C r a c k "A//~',~/~'A " ! .... !
: Shear Cracl~ " ~//]/j/'z~/~ .~"/¢1/ I : :
~ . I v / l k / V J ' l f t
1500 1000 500 0 -500 -1000 -1500 -2000
-15 -10 -5 0 5 10 15
R y ( X 1 0 "3 )
SB-B-01
X - D i r . Max. Q = 1233 kN
Load R = ll.91X10 "3 x
• : Quv(Maximum ' Vector Load) i ' ' ~ , ~ y a c e C
! B e s d i : g Crack. , / / ~ / ~ , ~ " 1 . Shear Fa'.dure
. Shear Failure
. . . .
-15 -10 - 5 0 5
R x ( X l 0 "3 )
Y - D i r .
15oo Max. Q = 1189 kN
• : Ouv(Maximum Vector Load) d / L o a d R = 3.15X10 "3
" ! Bending_ Crack" . 2 / ~ . . . . / l .
1000 m
-500 . . . . . .
-1000 : : :
. . . .
-1500
-2000
-15 -10 -5 0 5 10 15
R y ( X l 0 3 )
SB-C-01
Table 5. Test Results
SB-B-01 X 2.14 631 0.44 31 -0.01 497 0.30 28 -0.02 Y 1.88 -3 -0.01 672 0.51 -14 -0.01 367 0.22 SB-B-02
X Y
2.14 1.62
496 -40
0.27 -0.02
20 504
0.00 0.36
542 -38
0.31 -0.03
20 461
0.00 0.31
SB-B-03 X 2.32 563 0.39 480 0.48 463 0.28 333 0.29 Y 26 0.00 445 0.39 31 0.00 360 0.23 SB-C-01 X 2.63 603 0.37 -30 -0.02 546 0.27 -41 -0.02 Y 1.95 -38 -0.01 472 0.26 -34 -0.01 570 0.36 2000 1500 1000 500 0 -500 -1000 -1500 -2000
" " Max. " 1596 kN R = 5.76X10 "3.
,
: " "Shear Crack." Bending Crack'S\
' .
' ~ . .
f ~ _ _ . . . ~
. ,
Shdmg Failure
-15 -10 -5 0 5 10 15
R x ( X 1 0 -3 )
~ . 0 0 0 . . . . .
X - D i r . . • Max O = 1261 k N
• Vector Load) , ~ " 0OXIO~ [500 • : Quv(Maximum / " Load R = 4. - - -
t000 '- ' . . . . / ~ " ~ / ~ - "~"~-Shear Failure ' Bending Crack d ¢ ' / ~ ' / / ~ " ~ " " ~ _ _ ' Shear Crack-,\ .d1//!//~l///,dff ' ~--71~---
'- . . . - \ ~ F / ~ / / - :-- i - ..- .. '-/ .. . . .
500
: i f ~ V Z x / / / . Face B Shear . . ~ p r ~ ~ " . Sliding Failur,
o ~ i 1 ~ . -
-500 . . . .
LO00 " :
' . . • .
L500
. .
-2000
-15 -10 -5 0 5 10 15
R x ( X 1 0 "3 )
2000 1500 i000 500 0 -500 -1000 -1500 -2000 -15
Y-Dir. •
, ,
M a : d Q ~ 323ZqxkN 3
'°0 "°ir
. . .l
1
;00 • : Ouv!Maximu m V e c t o r Load) i i i ] . . . .. . . . . I . . . . . . . . : . . Face B Shear
,oo i Bending Crac i[ ~ ~ ; Shdmg Fall r ue
;oo .... , . . s . . . 0
i00
)o0
: Mrax. O = : ~ ' : :
i00 . . . Load " R = 4.64XI0 "3 . . . : . . . .
)00 i
0 5 10 15 20 -15 -10 -5 0 05 " 10 15
R y ( X 1 0 "3 ) ~ R y ( X 1 3 )
I
I
L
R =5/L
Fig.8 Shear Force - Total Deformation Angle Relationships
2000 1500 1000 500 0 -500 -1000 -1500 -2000
~ ' H at F a c e D
. . .
Y H at F a c e B .
Q . . . .
':, . ' Y V at F a c e C Y H : Yield o f H o r i z o n t a l B a r
Y V : Y i e l d o f Vertical B a r
Q u v M a x i m u m X - Y V e c t o r L o a d (SB-B-01)
- 000 -1500 -1000 -500 0 500 1000 1 5 0 0 2000
Qx(kN)
. . . . ' . . . . ~ ' H at F a c e D . . . . Y V at F a c e D
Y V at ~ a t ; a c e C
- Our- - -
Fac . ~ "YH at F a c e t
/
. . . ~
' F a c e C Y V at F a c e B
' Y H at F a c e B Y t t : Yield o f H o r i z o n t a l B a r
Y V : Y i e l d o f Vertical B a r (SB-C-01) Q u v M a x i m u m X - Y V e c t o r L o a d
t
-2000 -1500 -1000 -500 0 500 1000 1 5 0 0 2000
A B C D
II Vq~NIN, I ..':M,.~,.-:k".~'i.£,, X_,:;~l I INN, , ~ ~" $~tta'_l';.';,ll I :&,."~M'~)K,,~ z1 ~. .,~'~t"/,,~*1P,2,t'~ 1 ~ ~ ' ~ , ~ 7 ~ j~'L/zl/_11
~
,'~"'~K~k'k~ ~ ~ - , g 4 ~ .; ' : " "SB-B-01
C
A'
i IX,. lX x M ~ . . 4 , / l , . . , : z 4 1 ~ .'Ix",, IN~-,.,.~'lb--~t .~.~ - I _..':,IL.,;il IX.'q ~ - ~ ' t ~ " A"//,,L,A tk\'t,. '.11. / I I
~ 3 ~ " H F ~ ~ ~ ; : ~ ~ . ~ / , # ~' . .
- ~ , ,E~,,II&~ . ~ Q ~ j ~ U C : T ¢ , . .- .. -_ . . . c
l I N I S l ~ . . ' ~ ~ , ~ ~ l ~ ~ ' - , . " - ~ . , ~ . , 1 ~ " D" t ~ t -,,
S B - B - 0 2
J [ ' . ~ '~k'x.'l..'..Nl~ f;~',," ~ . ' : - ~ I " M ~ - 5 1 N _ ~ ~ " .3,<'~/IN'~'.'~:Z 5,r~;xV.~lx~l'..~/J~l~ i1~ " I ~ ~ %,4"t~L..K~'M2,.;~!
~ ~ < I N ~ . ~ , ~ . . N ~ ~
. . .i . " 7 - . . ~ ~ ~ . , . . . - - - : -.:, - c
. / • " . .. I ~ I ~ I ~ , . ' ~ . ' . . . .
A'
Fig.10 Final Crack Pattern
2000
SB-B-03
k Y J - A I I M / ~ ~ /K,,"t...xe4,~
SB-C-01
c
@
D B
A
1500
X-Dir. (Positive) Cross Loading
, (SB-B-02)
. . . . __~___ i
. . . ~ ; . . . . ~',r -L ~ ' : ' " ' " " " " , S " ~- ~, ' '
1000
500
100
80
60
4 0
2 0
2 4 6 8 10 12
R x ( X 10 -3 )
2000
1500
1000
500
Y - D i r . (Positive)
Cross Loading
' (SB-B-02) . . .
Rectan~,ular Loading /
~ " /;'" [~3o~3alaC)ross Lo " g
2 4 6 8 10
R y ( X 1 0 3 )
Fig.11 E n v e l o p e Curves (Box Type S p e c i m e n s )
D R o t a t i o n a l def. D R o t a t i o n a l def.
D F l e x u r a l def. UI F l e x u r a l def.
l l S h e a r def.
l l S h e a r def. 100
80
60
40
20
0
-1 2 -2 4 -4 6 -6 8 -8 0.8 - 0 . 8 1.6 -1.6 3 . 2 - 3 . 2 4 . 8 - 4 . 8 6 . 4 - 6 . 4
R x ( X 1 0 3 ) R y ( X 1 0 "3)
F i g . 1 2 D e f o r m a t i o n C o m p o n e n t s o f S B - B - 0 1
1.2
1.0
0.8
0.6
0.4
0.2
0.0 0.0
O Diagonal Loading Test (M/Qd=0.8) • SB-B-01 (Box : Rectangular) • SB-B-02 (Box :Cross) ~ " " i " • SB-C-01 (Cylinder : Rectangular) "
: \
i
i
. . i ' • i
0.2 0.4 0.6 0.8 1.0
O x/c QJEAO
Fig.13 M a x i m u m Shear Force