Volume 2007, Article ID 16921,10pages doi:10.1155/2007/16921
Research Article
Robust In-Car Speech Recognition Based on
Nonlinear Multiple Regressions
Weifeng Li,1Kazuya Takeda,1and Fumitada Itakura2
1Graduate School of Information Science, Nagoya University, Nagoya 464-8603, Japan
2Department of Information Engineering, Faculty of Science and Technology, Meijo University, Nagoya 468-8502, Japan
Received 31 January 2006; Revised 10 August 2006; Accepted 29 October 2006
Recommended by S. Parthasarathy
We address issues for improving handsfree speech recognition performance in different car environments using a single distant microphone. In this paper, we propose a nonlinear multiple-regression-based enhancement method for in-car speech recogni-tion. In order to develop a data-driven in-car recognition system, we develop an effective algorithm for adapting the regression parameters to different driving conditions. We also devise the model compensation scheme by synthesizing the training data using the optimal regression parameters and by selecting the optimal HMM for the test speech. Based on isolated word recognition experiments conducted in 15 real car environments, the proposed adaptive regression approach shows an advantage in average relative word error rate (WER) reductions of 52.5% and 14.8%, compared to original noisy speech and ETSI advanced front end, respectively.
Copyright © 2007 Weifeng Li et al. This is an open access article distributed under the Creative Commons Attribution License, which permits unrestricted use, distribution, and reproduction in any medium, provided the original work is properly cited.
1. INTRODUCTION
The mismatch between training and testing conditions is one of the most challenging and important problems in au-tomatic speech recognition (ASR). This mismatch may be caused by a number of factors, such as background noise, speaker variation, a change in speaking styles, channel effects, and so on. State-of-the-art ASR techniques for removing the mismatch usually fall into the following three categories [1]: robust features, speech enhancement, and model compensa-tion. The first approach seeks parameterizations that are fun-damentally immune to noise. The most widely used speech recognition features are the Mel-frequency cepstral coeffi -cients (MFCCs) [2]. MFCC’s lack of robustness in noisy or mismatched conditions has led many researchers to inves-tigate robust variants or novel feature extraction algorithm. Some of these researches could be perceptually based on, for example, the PLP [3] and RASTA [4], while other approaches are related to the auditory processing, for example, gamma-tone filter [5] and EIH model [6].
Speech enhancement approach aims to perform noise reduction by transforming noisy speech (or feature) into an estimate that more closely resembles clean speech (or feature). Examples falling in this approach include spec-tral subtraction [7], Wiener filter, cepstral mean
cepstral domain. Therefore, a nonlinear transformation or compensation is more appropriate.
The use of a neural network allows us to automatically learn the nonlinear mapping functions between the refer-ence and testing environments. Such a network can han-dle additive noise, reverberation, channel mismatches, and combinations of these. Neural-network-based feature en-hancement has been used in conjunction with a speech recognizer. For example, Sorensen used a multilayer net-work for noise reduction in the isolated word recogni-tion under F-16 jet noise [13]. Yuk and Flanagan em-ployed neural networks to perform telephone speech recog-nition [14]. However, the feature enhancement they im-plemented was performed in the ceptral domain and the clean features were estimated using the noisy features only.
In previous work, we proposed a new and effective multimicrophone speech enhancement approach based on multiple regressions of log spectra [15] that used multi-ple spatially distributed microphones. Their idea is to ap-proximate the log spectra of a close-talking microphone by effectively the combining of the log spectra of dis-tant microphones. In this paper, we extend the idea to single-microphone case and propose that the log spec-tra of clean speech are approximated through the nonlin-ear regressions of the log spectra of the observed noisy speech and the estimated noise using a multilayer percep-tron (MLP) neural network. Our neural-network-based fea-ture enhancement method incorporates the noise informa-tion and can be viewed as a generalized log spectral subtrac-tion.
In order to develop a data-driven in-car recognition sys-tem, we develop an effective algorithm for adapting the re-gression parameters to different driving conditions. In order to further reduce the mismatch between training and testing conditions, we synthesize the training data using the optimal regression parameters, and train multiple hidden Markov models (HMMs) over the synthesized data. We also develop several HMM selection strategies. The devised system results in a universal in-car speech recognition framework including both the speech enhancement and the model compensation. The organization of this paper is as follows: inSection 2, we describe the in-car speech corpus used in this paper. In
Section 3, we present the regression-based feature enhance-ment algorithm, and the experienhance-mental evaluations are out-lined inSection 4. InSection 5, we present the environmen-tal adaptation and model compensation algorithms. Then the performance evaluation on the adaptive regression-based speech recognition framework is reported inSection 6. Fi-nallySection 7concludes this paper.
2. IN-CAR SPEECH DATA AND SPEECH ANALYSIS
A data collection vehicle (DCV) has been specially designed for developing the in-car speech corpus at the Center for Integrated Acoustic Information Research (CIAIR), Nagoya University, Nagoya, Japan [16]. The driver wears a headset with a close-talking microphone (#1 inFigure 1) placed in it.
1 3 4
5 6
7 9 10 11 12
1
3
4 5
6 7
9 10 11 12
Figure1: Side view (top) and top view (bottom) of the arrangement of multiple spatially distributed microphones and the linear array in the data collection vehicle.
Five spatially distributed microphones (#3 to #7) are placed around the driver. Among them, microphone #6, located at the visor location to the speaker (driver), is the closest to the speaker. The speech recorded at this microphone (also named “visor mic.”) is used for speech recognition in this paper. A four-element linear microphone array (#9 to #12) with an interelement spacing of 5 cm is located at the visor position.
The test data includes Japanese 50 word sets under 15 driving conditions (3 driving environments×5 in-car states
= 15 driving conditions as listed inTable 1).Table 2shows the average signal-to-noise ratio (SNR) for each driving con-dition. For each driving condition, 50 words are uttered by each of 18 speakers. A total of 7000 phonetically balanced sentences (uttered by 202 male speakers and 91 female speak-ers) were recorded for acoustical modeling. (3600 of them were collected in the idling-normal condition and 3400 of them were collected while driving the DCV on the streets near Nagoya University (city-normal condition).)
Noisy speech
Clean speech
log MFB analysis log MFB analysis
log MFB analysis
Feature vector (log MFB)
X(L)(m,l) feature vectorEstimated
N(L)(m,l)
Regression-based estimation
S(L)(m,l)
S(L)(m,l) Approximation Noise
estimation
Figure2: Concept of regression-based feature enhancement.
Table1: Fifteen driving conditions (3 driving environments×5 in-car states).
Driving environments In-car states
Idling “i” City driving “c” Expressway driving “e”
Normal “n” CD player on “s”
Air conditioner (AC) on at low level “l”
Air conditioner (AC) on at high level “h”
Window (near the driver) open “w”
Table2: The average SNR values (dB) for 15 driving conditions (“i-n” indicates the idling-normal condition, and so on).
Cond. SNR Cond. SNR Cond. SNR
i-n 13.41 c-n 9.58 e-n 7.24
i-s 8.82 c-s 8.13 e-s 7.16
i-l 9.56 c-l 8.92 e-l 7.30
i-h 6.84 c-h 6.49 e-h 5.92
i-w 8.87 c-w 6.55 e-w 4.29
3. ALGORITHMS
3.1. Regression-based feature enhancement
Lets(i),n(i), andx(i), respectively, denote the reference clean speech (referred to the speech at the close-talking micro-phone in this paper), noise, and observed noisy signals. By applying a window function and analysis using short-time discrete Fourier transform (DFT), in the time-frequency do-main we have S(k,l), N(k,l), and X(k,l), where k and l
denote frequency bin and frame indexes, respectively. The hat aboveN denotes the estimated version. After the Mel-filter-bank (MFB) analysis and the log operation, we obtain
S(L)(m,l),X(L)(m,l), andN(L)(m,l), that is,
S(L)(m,l)=log
k
rm,kS(k,l),
X(L)(m,l)=log
k
rm,kX(k,l),
N(L)(m,l)=log
k
rm,k N(k,l),
(1)
whererm,k denotes the weights of themth filter bank. The idea of the regression-based enhancement is to approximate
S(L)(m,l) with the combination ofX(L)(m,l) andN(L)(m,l),
as shown inFigure 2. LetS(L)(m,l) denote the estimated log
MFB ouput of themth filter bank at framel, and it can be obtained from the inputs ofX(L)(m,l) andN(L)(m,l). In
par-ticular,S(L)(m,l) can be obtained using the linear regression,
that is,
S(L)(m,l)=b
m+wm(x)X(L)(m,l) +w(mn)N(L)(m,l), (2)
where the parametersΘ = {bm,wm(x),wm(n)}are obtained by minimizing the mean-squared error:
E(m)= L
l=1
S(L)(m,l)−S(L)(m,l)2, (3)
over the training examples. Here,Ldenotes the number of training examples (frames).
On the other hand,S(L)(m,l) can be obtained by
apply-ing multilayer perceptron (MLP) regression method, where a network with one hidden layer composed of 8 neurons is used,1that is,
S(L)(m,l)
=fX(L),N(L)
=bm+
8
p=1
wm,ptanh bm,p+w(mx,)pX(L)+w(mn,)pN(L)
, (4)
where the filter bank index m and the index frame l are dropped for compactness. tanh(·) is the tangent hyperbolic activation function. The parametersΘ={bm,wm,p,wm(x,)p,wm(n,)p, bm,p}are found by minimizing (3) through the back-prop-agation algorithm [17].
The proposed approach is cast into single-channel meth-odology because once the optimal regression parameters are obtained by regression learning, they can be utilized in the test phase, where the speech of the close-talking microphone is no longer required. Multiple regressions mean that regres-sion is performed for each Mel-filter bank. The use of min-imum mean-squared error (MMSE) in the log spectral do-main is motivated by the fact that log spectral measure is more related to the subjective quality of speech [18] and that some better results have been reported with log distortion measures [19].2
Although neural networks have been employed for fea-ture enhancement (e.g., [13,14]) in cepstral domain, the in-put used for the estimation of the clean feature in their al-gorithms is the noisy feature only. The proposed method in-corporates the noise information through the noise estima-tion, and can be viewed as a generalized log spectral subtrac-tion. In this paper,|N(k,l)|is estimated using the two-stage noise spectra estimator proposed in [20]. Based on our previ-ous studies, the incorporation of the noise information con-tributed a significant performance gain of about 3% absolute improvement in recognition accuracies, compared to that us-ing the noisy feature only.
3.2. Comparison with the spectral subtraction
Thespectral subtraction(SS) [7] is a simple but effective tech-nique for cleaning the speech from the additive noise. It was originally developed for the speech quality enhancement. However, they may also serve as a preprocessing step for the speech recognition. Let the corrupted speech signalx(i) be represented as
x(i)=s(i) +n(i), (5)
wheres(i) is the clean speech signal andn(i) is the noise sig-nal. By applying a window function and the analysis using short-time discrete Fourier transform (DFT), we have
X(k,l)=S(k,l) +N(k,l), (6)
wherekandldenote frequency bin and frame indexes, re-spectively. For compactness, we will drop bothk andl. As-suming that the clean speechsand the noisenare statistically independent, the power spectrum of clean speech|S|2can be
estimated as
|S|2= |X|2− |N| 2, (7)
2In [19], Porter and Boll found that for speech recognition, minimizing the mean-squared errors in the log|DFT|is superior to using all other DFT functions and to spectral magnitude subtraction.
where|N| 2is the estimated noise power spectrum. To reduce
the annoying “musical tone” artifacts, SS can be modified as [21]
|S|2= ⎧ ⎨ ⎩
|X|2−α|N| 2 if|X|2> β|N| 2,
β|N| 2 otherwise, (8)
by introducing the subtraction factor α and the spectral flooring parameterβ. SS can be also implemented in the am-plitude domain and the subband domain [22].
Although the proposed regression-based method and SS are implemented in the different domains, both of them es-timate the features of the clean speech using those of noisy speech and estimated noise. In (8), the SS method results in a simple subtraction of the weighted noise power spectra from the noisy speech power spectra. In most literatures, the parametersαandβare usually determined experimentally. Compared with SS, the regression-based method employs more general nonlinear models, and can benefit from the re-gression parameters, which are statistically optimized. More-over, the proposed method makes no assumption about the independence of speech and noise, and can deal with more complicated distortions rather than the additive noise only.
3.3. Comparison with the log-spectra amplitude (LSA) estimator
Thelog-spectra amplitude(LSA) estimator [23], proposed by Ephraim and Malah, also employs minimum mean-squared errors (MMSEs) cost function in the log domain. However, this approach explicitly assumes a Gaussian distribution for the clean speech and the additive noise spectra. Under this assumption, by using the MMSE estimation on log-spectral amplitude, we can obtain the estimated amplitude of clean speech as
|S| = ξ
1 +ξexp
1 2
∞
v e−t
t dt
· |X|, (9)
where the a priori and a posteriori SNRs are defined by
ξ = E{|S|2}/E{|N| 2} andγ = E{|X|2}/E{|N| 2},
respec-tively, whereE{·}denotes the expectation operator.vis de-fined by
v= ξ
1 +ξγ. (10)
To reduce he “musical tone” artifacts, the dominant param-eter, the a priori SNRξ, is calculated using the smoothing technique, that is, the “decision-directed” method [24].
HMM training (293 speakers, 7000 sentences) Close-talking
mic. speech
log MFB analysis
log MFB analysis log MFB analysis log MFB analysis
log MFB analysis log MFB analysis
Feature
transform HMM Regression model training (12 speakers, 600 words)
Visor mic. speech
Noise estimation
Regression training Close-talking
mic. speech
Test data (6 speakers, 300 words) Visor mic.
speech
Noise estimation
Estimation transformFeature Recognition
Figure3: Diagram of regression-based speech recognition for a particular driving condition.
method makes no assumptions regarding the additive noise model, nor about the Gaussian distributions of speech and noise spectra. All the regression parameters in the proposed regression method are obtained through the statistical opti-mization.
4. REGRESSION-BASED SPEECH RECOGNITION EXPERIMENTS
4.1. Experimental setup
We performed isolated word recognition experiments on the 50 word sets under 15 driving conditions as listed inTable 1. In this section, we assume that the driving conditions are known as a priori, and the regression parameters are trained for each condition. For each driving condition, the data ut-tered by 12 speakers (6 males and 6 females) is used for learn-ing the regression models, and the remainlearn-ing words uttered by 6 speakers (3 males and 3 females) are used for recogni-tion. A diagram of the in-car regression-based speech recog-nition for a particular driving condition is given inFigure 3. The structure of the hidden Markov models (HMMs) used in this paper is fixed, that is,
(1) three-state triphones based on 43 phonemes that share 1000 states;
(2) each state has 32-component mixture Gaussian distri-butions;
(3) the feature vector is a 25-dimensional vector (12CMN-MFCC+12ΔCMN-MFCC +Δlog energy).3
3The regression is also performed on the log energy parameter. The esti-mated log MFB and the log energy outputs are first converted into CMN-MFCC vectors using DCT and mean normalization. Then the derivatives are calculated.
For comparison, we performed the following experi-ments:
original: recognition of the original noisy speech (#6 in Fig-ure1) speech using the corresponding HMM;
SS: recognition of the speech enhanced using the spectral subtraction (SS) method with (8);
LSA: recognition of the speech enhanced using the log-spectra amplitude (LSA) estimator;
linear regression: recognition of the speech enhanced using the linear regression with (2);
nonlinear regression: recognition of the speech enhanced us-ing the nonlinear regression with (4).
Note that the acoustic models, used for the “SS,” “LSA,” and the regression method, are trained over the speech at the close-talking microphone (#1 inFigure 1).
4.2. Speech recognition results
75 80 85 90
Cor
re
ct
(%
)
Original SS LSA Linear
regression
Nonlinear regression Figure4: Recognition performance of different speech enhance-ment methods (averaged over 15 driving conditions).
speech [27].4Therefore, the nonlinear regression method is
used in the following experiments.
5. ENVIRONMENTAL ADAPTATION AND MODEL COMPENSATION
5.1. Adaptive enhancement of an input speech signal
In the regression-based recognition systems described above, each driving condition was assumed to be known as a prior information and the regression parameters were trained within each driving condition. To develop a data-driven in-car recognition system, regression weights should be adapted automatically to different driving conditions. In this sec-tion, we discriminate in-car environments by using the infor-mation of the nonspeech signals. In our experiments, Mel-frequency cepstral coefficients (MFCCs) are selected for the environmental discrimination because of their good discrim-inating ability, even in audio classification (e.g., [28,29]). The MFCC features are extracted frame by frame from non-speech signals (preceding the utterance by 200 milliseconds, i.e., 20 frames), their means in one noisy signal are com-puted, and they are then concatenated into a feature vector:
R=c1,. . .,c12,e
, (11)
whereciandedenoteith-order MFCC and log energy, re-spectively. The upper bar denotes the mean values of the fea-tures. Since the variances among the elements inRare diff er-ent, each element is normalized so that their mean and vari-ance are 0 and 1, respectively. The prototypes of the noise clusters are obtained by applying theK-means-clustering al-gorithm [30] to the feature vectors extracted from the train-ing set of the nonspeech signals.
The basic procedure of the proposed method is as fol-lows. (1) Cluster the noise signals (i.e., short-time nonspeech segments preceding the utterances) into several groups. (2)
4In our previous work [27], we generated the enhanced speech signals by performing the regressions in the log spectral domain (for each frequency bin).
For each noise group, train optimal regression weights us-ing the speech segments. (3) For unknown input speech, find a corresponding noise group using the nonspeech segments and perform the estimation with the optimal weights of the selected noise group, that is, the log MFB outputs of clean speech can be estimated by
S(L)=fk
X(L),N(L), (12)
where X(L) and N(L) indicate the log MFB vector
ob-tained from noisy speech and estimated noise, respectively.
fk(·) corresponds to the nonlinear mapping function in
Section 3.1, where the cluster IDkis specified by minimizing the Euclidian distance betweenRand the centroid vectors.
In our experiments, the vectorsRs, exacted from the first 20-frame nonspeech part of the signals by 12 speakers, are used to cluster the noise conditions, and those by another six speakers are used for testing, as shown inFigure 5.
5.2. Regression-based HMM training
In our previous work [27], we generated the enhanced speech signals, by performing the regressions in the log spectral domain (for each frequency bin). Though few “musical tone” artifacts were found in the regression-enhanced sig-nals compared to those obtained using spectral subtraction-based methods, some noise still remained in the regression-enhanced signals. We believe there will exist a mismatch between training and testing conditions, if we use HMM trained over clean data to test the regression-enhanced speech. In order to reduce the mismatch and incorporate the statistical characteristics of the test conditions, we adopt the
Ksets of optimal weights obtained from each clustered group to synthesize 7000-sentence training data, that is, we simu-lated 7000×Ksentences based onKclustered noise environ-ments. ThenKHMMs are trained over each of the synthe-sized 7000-sentence training data, as shown inFigure 5.
5.3. HMM selection
For the recognition of an input speech signalx, an HMM is selected fromK HMMs based on the following two strate-gies.
(1) ID-based strategy
This strategy tries to select an HMM trained over the simu-lated training data, which are close to the test noise environ-ment, that is,
H(x)=
K
k=1
δD(x),DHk
Hk, (13)
where theKronecker deltafunctionδ(·,·), has value 1 if its two arguments match, and value 0 otherwise [30].D(x) and
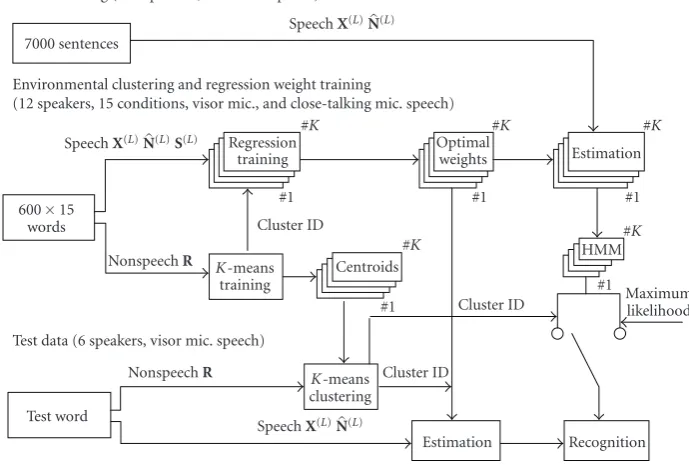
HMM training (293 speakers, visor mic. speech) 7000 sentences
SpeechX(L)N(L)
Environmental clustering and regression weight training
(12 speakers, 15 conditions, visor mic., and close-talking mic. speech) SpeechX(L)N(L)S(L) Regression
training
Optimal
weights Estimation 60015
words
NonspeechR K-means training
Centroids
HMM
Maximum likelihood Cluster ID
Test data (6 speakers, visor mic. speech)
NonspeechR K-means clustering Test word
Cluster ID Cluster ID
Estimation Recognition SpeechX(L)N(L)
#K #K #K
#K #K
#1 #1 #1
#1
#1
Figure5: Diagram of adaptive regression-based speech recognition.X(L),N(L), andS(L)denote the log MFB outputs obtained from observed noisy speech, estimated noise, and reference clean speech, respectively.Rdenotes the vector representation of the driving environment using (11).
(2) Maximum-likelihood- (ML-) based strategy
This strategy tries to select the HMM that outputs maximum likelihood (likelihood selection [31]), that is,
H(x)=arg max H
Px|H1
,. . .,Px|HK
, (14)
whereP(x|Hk) indicates the log likelihood of an input sig-nalxby using thekth HMMHk.
5.4. Analysis of the proposed framework
There are some common points in the stereo-based piecewise linear compensation for environments (SPLICE) method [32,33] and our feature enhancement inSection 5.1. Both of them are stereo-based and consist of two steps: find-ing the optimal “codeword” and performfind-ing the codeword-dependent compensation (see (12)). However, the proposed enhancement method does not need any Gaussian assump-tion required in SPLICE and turns out to be a general non-linear compensation. Synthesizing the training data using the optimal regression weights obtained in the test environments is similar to training data contaminations [1], but the pro-posed one incorporates the information of test environments implicitly. Regression-based HMM training and HMM selec-tion can be viewed as a kind of nonlinear model compen-sation, which can incorporate the information of the test-ing environments. A combination of feature enhancement and HMM selection results in a universal speech recognition framework where both the noisy features and the acoustic models are compensated.
81 83 85 87 89 91 93
Cor
re
ct
(%
)
1 cluster 2 clusters 4 clusters 8 clusters
ID-based ML-based Clean-HMM
Figure 6: Recognition performance for different clusters using adaptive regression methods (averaged over 15 driving conditions).
6. PERFORMANCE EVALUATION
Input Output
x1(n) x2(n) x3(n) x4(n)
τ1 τ2 τ3 τ4
w1 w2 w3 w4
Delay yb f(n) + y0(n) ya(n)
Blocking matrix
u1(n) u2(n) u3(n)
FIR 1 FIR 2 FIR 3
Figure7: Block diagram of generalized sidelobe canceller.
above) yield a degradation of the recognition performance. Although the two adaptive regression-based recognition sys-tems perform almost identically in the two-cluster case, “ID-based” yields a more stable recognition performance across the numbers of clusters, and the best recognition perfor-mance is achieved using “ID-based” and with four clusters.
For comparison, we also performed recognition experi-ments based on the ETSI advanced front end [34], and an adaptive beamformer (ABF). The acoustic models used for the ETSI advanced front end and the adaptive beamform-ing were trained over the trainbeamform-ing data they processed. For the adaptive beamformer, the generalized sidelobe canceller
(GSC) [35] is applied to our in-car speech recognition. Four linearly spaced microphones (#9 to #12 inFigure 1) with an interelement spacing of 5 cm at the visor position are used. The architecture of the GSC used is shown inFigure 7. In our experiments,τiis set equal to zero since the speakers (drivers) sit directly in front of the array line, whilewiis set equal to 1/4. The delay is chosen as half of the adaptive filter order to ensure that the component in the middle of each of the adaptive filters at timencorresponds toyb f(n). The block-ing matrix takes the difference between the signals at the ad-jacent microphones. The three FIR filters are adapted sample by sample using the normalized least-mean square (NLMS) method [36].
Figure 8 shows the recognition performance averaged over the 15 driving conditions. “original” cites fromFigure 4
and “proposed” cites the best recognition performance achieved in Figure 6. It is found that all the enhancement methods outperform the original noisy speech. Recalling
Figure 4, ETSI advanced front end yields higher recognition accuracy than the LSA estimator. The proposed method sig-nificantly outperforms ETSI advanced front end and even performs better than adaptive beamforming, which uses as many as four microphones. Recalling Figure 6, it is found that the regression-based method with even one cluster out-performs ETSI advanced front end. This clearly demon-strates the superiority of the adaptive regression method.
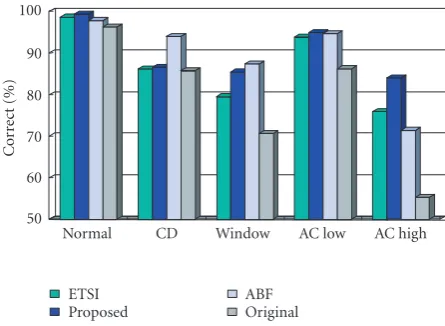
We also investigated the recognition performance aver-aged over five in-car states as listed in Table 1. The results are shown in Figure 9. It is found that the adaptive regres-sion method outperforms ETSI advanced front end in all the five in-car states, especially when AC is on at high level and
75 80 85 90 95
Cor
re
ct
(%
)
Original ETSI Proposed ABF
Figure8: Recognition performance of different speech enhance-ment methods (averaged over 15 driving conditions).
50 60 70 80 90 100
Cor
re
ct
(%
)
Normal CD Window AC low AC high
ETSI Proposed
ABF Original
Figure9: Recognition performance for five in-car states by using different methods. Each group represents one in-car state listed in
Table 1. Within each group, the bars represent the recognition ac-curacy by using different methods: ETSI-ETSI advanced front end; proposed—the best performance inFigure 6; ABF-adaptive beam-former; original—recognition of the original noisy speech (no pro-cessing).
when the window near the driver is open. Adaptive beam-forming is very effective when the CD player is on and when the window near the driver is open. This suggests that adap-tive beamforming with multiple microphones can suppress the noise coming from undesired directions quite well due to its spatial filtering capability. However, in the remaining three in-car states (diffuse noise cases), it does not work as well as the adaptive regression method. Because the proposed method is based on statistical optimization and the present noise estimation cannot track the rapidly changing nonsta-tionary noise, it can be found from this figure that the pro-posed method works rather well under the stationary noise (e.g., air conditioner on), but has some problems in the non-stationary noise (e.g., CD player on).
7. CONCLUSIONS
recognition. In the proposed method, the log Mel-filter-bank (MFB) outputs of clean speech are approximated through the nonlinear regressions of those obtained from the noisy speech and the estimated noise. The proposed feature en-hancement method incorporates the noise estimation and can be viewed as generalized log-spectral subtraction. Com-pared with the spectral subtraction and the log-spectral am-plitude estimator, the proposed one statistically optimizes the model parameters and can deal with more complicated dis-tortions.
In order to develop a data-driven in-car recognition sys-tem, we have developed an effective algorithm for adapting the regression parameters to different driving conditions. We also devised the model compensation scheme by synthesiz-ing the trainsynthesiz-ing data ussynthesiz-ing the optimal regression parame-ters and by selecting the optimal HMM for the test speech. The devised system turns out to be a robust in-car speech recognition framework, in which both feature enhancement and model compensation are performed. The superiority of the proposed system was demonstrated by a significant im-provement in recognition performance in the isolated word recognition experiments conducted in 15 real car environ-ments.
InSection 5, a hard decision is made for environmen-tal selection. However, when the system encounters a new noise type, a soft or fuzzy logic decision is desirable, and should be one of future work. The present speech recogni-tion system has not addressed the problem of interference by rapidly changing nonstationary noise. For example, our experiments confirmed that the present recognition system did not work well when CD player was on. In the nonsta-tionary noise cases, the accuracy of noise estimation is very important in successful applications of denoising schemes. Some recursive noise estimation algorithm such as “iterated extended Kalman filter” [37] may be helpful for our speech recognition system.
ACKNOWLEDGMENT
This work is partially supported by a Grant-in-Aid for Scien-tific Research (A) (15200014).
REFERENCES
[1] Y. Gong, “Speech recognition in noisy environments: a sur-vey,”Speech Communication, vol. 16, no. 3, pp. 261–291, 1995. [2] S. B. Davis and P. Mermelstein, “Comparison of paramet-ric representations for monosyllabic word recognition in con-tinuously spoken sentences,”IEEE Transactions on Acoustics, Speech, and Signal Processing, vol. 28, no. 4, pp. 357–366, 1980. [3] H. Hermansky, “Perceptual linear predictive (PLP) analysis of speech,”The Journal of the Acoustical Society of America, vol. 87, no. 4, pp. 1738–1752, 1990.
[4] H. Hermansky and N. Morgan, “RASTA processing of speech,” IEEE Transactions on Speech and Audio Processing, vol. 2, no. 4, pp. 578–589, 1994.
[5] B. Gold and N. Morgan,Speech and Audio Signal Processing: Processing and Perception of Speech and Music, John Wiley & Sons, New York, NY, USA, 1999.
[6] O. Ghitza, “Auditory models and human performance in tasks related to speech coding and speech recognition,”IEEE Trans-actions on Speech and Audio Processing, vol. 2, no. 1, pp. 115– 132, 1994.
[7] S. F. Boll, “Suppression of acoustic noise in speech using spec-tral subtraction,”IEEE Transactions on Acoustics, Speech, and Signal Processing, vol. 27, no. 2, pp. 113–120, 1979.
[8] X. Huang, A. Acero, and H.-W. Hon, Spoken Language Processing—A Guide to Theory, Algorithm, and System Devel-opment, Prentice-Hall, Englewood Cliffs, NJ, USA, 2001. [9] A. Acero,Acoustical and environmental robustness in automatic
speech recognition, Ph.D. thesis, Carnegie Mellon University, Pittsburgh, Pa, USA, 1990.
[10] C. J. Leggetter and P. C. Woodland, “Maximum likelihood linear regression for speaker adaptation of continuous den-sity hidden Markov models,”Computer Speech and Language, vol. 9, no. 2, pp. 171–185, 1995.
[11] S. Sagayama, Y. Yamaguchi, and S. Takahashi, “Jacobian adap-tation of noisy speech models,” inProceedings of IEEE Work-shop on Automatic Speech Recognition and Understanding, pp. 396–403, Santa Barbara, Calif, USA, December 1997. [12] R. Sarikaya and J. H. L. Hansen, “Improved Jacobian
adapta-tion for fast acoustic model adaptaadapta-tion in noisy speech recog-nition,” inProceedings of the 6th International Conference on Spoken Language Processing (ICSLP ’00), pp. 702–705, Beijing, China, October 2000.
[13] H. B. D. Sorensen, “A cepstral noise reduction multi-layer neu-ral network,” inProceedings of IEEE International Conference on Acoustics, Speech and Signal Processing (ICASSP ’91), vol. 2, pp. 933–936, Toronto, Ontario, Canada, May 1991.
[14] D. Yuk and J. Flanagan, “Telephone speech recognition using neural networks and hidden Markov models,” inProceedings of IEEE International Conference on Acoustics, Speech and Signal Processing (ICASSP ’99), vol. 1, pp. 157–160, Phoenix, Ariz, USA, March 1999.
[15] W. Li, K. Takeda, and F. Itakura, “Adaptive log-spectral regres-sion for in-car speech recognition using multiple distributed microphones,”IEEE Signal Processing Letters, vol. 12, no. 4, pp. 340–343, 2005.
[16] N. Kawaguchi, S. Matsubara, H. Iwa, et al., “Construction of speech corpus in moving car environment,” inProceedings of the 6th International Conference of Spoken Language Processing (ICSLP ’00), pp. 362–365, Beijing, China, October 2000. [17] S. Haykin, Neural Networks—A Comprehensive Foundation,
Prentice-Hall, Englewood Cliffs, NJ, USA, 1999.
[18] S. R. Quackenbush, T. P. Barnwell, and M. A. Clements, Ob-jective Measures of Speech Quality, Prentice-Hall, Englewood Cliffs, NJ, USA, 1988.
[19] J. E. Porter and S. F. Boll, “Optimal estimators for spectral restoration of noisy speech,” inProceedings of IEEE Interna-tional Conference on Acoustics, Speech and Signal Processing (ICASSP ’84), vol. 2, pp. 18A.2.1–18A.2.4, San Diego, Calif, USA, 1984.
[20] W. Li, K. Itou, K. Takeda, and F. Itakura, “Two-stage noise spectra estimation and regression based in-car speech recogni-tion using single distant microphone,” inProceedings of IEEE International Conference on Acoustics, Speech and Signal Pro-cessing (ICASSP ’05), vol. I, pp. 533–536, Philadelphia, Pa, USA, March 2005.
International Conference on Acoustics, Speech and Signal Pro-cessing (ICASSP ’79), vol. 4, pp. 208–211, Washington, DC, USA, April 1979.
[22] J. Chen, K. K. Paliwal, and S. Nakamura, “Sub-band based ad-ditive noise removal for robust speech recognition,” in Pro-ceedings of the 7th European Conference on Speech Communi-cation and Technology (EUROSPEECH ’01), pp. 571–574, Aal-borg, Denmark, September 2001.
[23] Y. Ephraim and D. Malah, “Speech enhancement using a min-imum mean-square error-log-spectral amplitude estimator,” IEEE Transactions on Acoustics, Speech, and Signal Processing, vol. 33, no. 2, pp. 443–445, 1985.
[24] Y. Ephraim and D. Malah, “Speech enhancement using a min-imum mean-square error short-time spectral amplitude esti-mator,”IEEE Transactions on Acoustics, Speech, and Signal Pro-cessing, vol. 32, no. 6, pp. 1109–1121, 1984.
[25] O. Cappe and J. Laroche, “Evaluation of short-time spectral attenuation techniques for the restoration of musical record-ings,”IEEE Transactions on Speech and Audio Processing, vol. 3, no. 1, pp. 84–93, 1995.
[26] R. Martin, “Speech enhancement using MMSE short time spectral estimation with Gamma distributed speech priors,” inProceedings of IEEE International Conference on Acoustics, Speech and Signal Processing (ICASSP ’02), vol. 1, pp. 253–256, Orlando, Fla, USA, May 2002.
[27] W. Li, K. Itou, K. Takeda, and F. Itakura, “Subjective and objec-tive quality assessment of regression-enhanced speech in real car environments,” inProceedings of the 9th European Con-ference on Speech Communication and Technology, pp. 2093– 2096, Lisbon, Portugal, September 2005.
[28] M. J. Carey, E. S. Parris, and H. Lloyd-Thomas, “A comparison of features for speech, music discrimination,” inProceedings of IEEE International Conference on Acoustics, Speech and Signal Processing (ICASSP ’99), vol. 1, pp. 149–152, Phoenix, Ariz, USA, March 1999.
[29] V. Peltonen, J. Tuomi, A. Klapuri, J. Huopaniemi, and T. Sorsa, “Computational auditory scene recognition,” inProceedings of IEEE International Conference on Acoustics, Speech and Signal Processing (ICASSP ’02), vol. 2, pp. 1941–1944, Orlando, Fla, USA, May 2002.
[30] R. O. Duda, P. E. Hart, and D. G. Stork,Pattern Classification, John Wiley & Sons, New York, NY, USA, 2nd edition, 2001. [31] Y. Shimizu, S. Kajita, K. Takeda, and F. Itakura, “Speech
recognition based on space diversity using distributed multi-microphone,” inProceedings of IEEE International Conference on Acoustics, Speech and Signal Processing (ICASSP ’00), vol. 3, pp. 1747–1750, Istanbul, Turkey, June 2000.
[32] L. Deng, A. Acero, M. Plumpe, and X. Huang, “Large-vocabu-lary speech recognition under adverse acoustic environments,” inProceedings of the 6th International Conference of Spoken Language Processing (ICSLP ’00), pp. 806–809, Beijing, China, October 2000.
[33] J. Droppo, L. Deng, and A. Acero, “Evaluation of the SPLICE algorithm on the Aurora2 database,” inProceedings of the 7th European Conference on Speech Communication and Technol-ogy (EUROSPEECH ’01), pp. 217–220, Aalborg, Denmark, September 2001.
[34] “Speech processing, transmission and quality aspects (STQ); distributed speech recognition; advanced frontend feature ex-traction algorithm; compression algorithm,” ETSI ES 202 050 v1.1.1, 2002.
[35] L. J. Griffiths and C. W. Jim, “An alternative approach to lin-early constrained adaptive beamforming,”IEEE Transactions on Antennas and Propagation, vol. 30, no. 1, pp. 27–34, 1982. [36] S. Haykin,Adaptive Filter Theory, Prentice-Hall, Englewood
Cliffs, NJ, USA, 2002.
[37] J. M. Mendel,Lessons in Estimation Theory for Signal Process-ing, Communications, and Control, Prentice-Hall, Englewood Cliffs, NJ, USA, 1995.
Weifeng Lireceived the B.E. degree in me-chanical electronics at Tianjin University, China, in 1997. He received the M.E. and Ph.D. degrees in information electronics at Nagoya University, Japan, in 2003 and 2006. Currently, he is a Research Scientist at the IDIAP Research Institute, Switzerland. His research interests are in the areas of machine learning, speech signal processing, and ro-bust speech recognition. He is a Member of the IEEE.
Kazuya Takeda received the B.S. degree, the M.S. degree, and the Dr. of Engineer-ing degree from Nagoya University, in 1983, 1985, and 1994, respectively. In 1986, he joined Advanced Telecommunication Re-search Laboratories (ATR), where he was in-volved in the two major projects of speech database construction and speech synthesis system development. In 1989, he moved to KDD R&D Laboratories and participated in
a project for constructing voice-activated telephone extension sys-tem. He has joined Graduate School of Nagoya University in 1995. Since 2003, he has been a Professor at Graduate School of Infor-mation Science at Nagoya University. He is a Member of the IEICE, IEEE, and the ASJ.
Fumitada Itakura earned undergraduate and graduate degrees at Nagoya Univer-sity. In 1968, he joined NTT’s Electrical Communication Laboratory in Musashino, Tokyo. He completed his Ph.D. in speech processing in 1972. He worked on isolated word recognition at Bell Labs from 1973 to 1975. In 1981, he was appointed as Chief of the Speech and Acoustics Research Section at NTT. In 1984, he took a professorship at