Improved Pronunciation Features for Construct-driven Assessment of
Non-native Spontaneous Speech
Lei Chen, Klaus Zechner, Xiaoming Xi
Educational Testing Service Princeton, NJ, USA
{LChen,KZechner,XXi}@ets.org
Abstract
This paper describes research on automatic as-sessment of the pronunciation quality of spon-taneous non-native adult speech. Since the speaking content is not known prior to the assessment, a two-stage method is developed to first recognize the speaking content based on non-native speech acoustic properties and then forced-align the recognition results with a reference acoustic model reflecting native and near-native speech properties. Features related to Hidden Markov Model likelihoods and vowel durations are extracted. Words with low recognition confidence can be excluded in the extraction of likelihood-related fea-tures to minimize erroneous alignments due to speech recognition errors. Our experiments on the TOEFLRPractice Online test, an
En-glish language assessment, suggest that the recognition/forced-alignment method can pro-vide useful pronunciation features. Our new pronunciation features are more meaningful than an utterance-based normalized acoustic model score used in previous research from a construct point of view.
1 Introduction
Automated systems for evaluating highly pre-dictable speech (e.g. read speech or speech that is quite constrained in the use of vocabulary and syntactic structures) have emerged in the past decade (Bernstein, 1999; Witt, 1999; Franco et al., 2000; Hacker et al., 2005) due to the growing matu-rity of speech recognition and processing technolo-gies. However, endeavors into automated scoring
for spontaneous speech have been sparse given the challenge of both recognizing and assessing spon-taneous speech. This paper addresses the develop-ment and evaluation of pronunciation features for an automated system for scoring spontaneous speech. This system was deployed for the TOEFLRPractice
Online (TPO) assessment used by prospective test takers to prepare for the official TOEFLRtest.
A construct is a set of knowledge, skills, and abil-ities measured by a test. The construct of the speak-ing test is embodied in the rubrics that human raters use to score the test. It consists of three key cat-egories: delivery, language use, and topic devel-opment. Delivery refers to the pace and the clar-ity of the speech, including performance on into-nation, rhythm, rate of speech, and degree of hesi-tancy. Language use refers to the range, complex-ity, and precision of vocabulary and grammar use. Topic development refers to the coherence and full-ness of the response. Most of the research on spon-taneous speech assessment focuses on the delivery aspect given the low recognition accuracy on non-native spontaneous speech.
The delivery aspect can be measured on four di-mensions: fluency, intonation, rhythm, and pronun-ciation. For the TPO assessment, we have defined pronunciation as the quality of vowels, consonants and word-level stress (segmentals). Intonation and sentence-level stress patterns (supra-segmentals) are not defined as part of pronunciation. Pronuncia-tion is one of the key factors that impact the intelli-gibility and perceived comprehensibility of speech. Because pronunciation plays an important role in speech perception, features measuring
tion using speech technologies have been explored in many previous studies. However, the bulk of the research on automatic pronunciation evaluation con-cerns read speech or highly predictable speech (Witt, 1999; Franco et al., 2000; Hacker et al., 2005), where there is a high possibility of success in speech recognition. Automatic pronunciation evaluation is challenging for spontaneous speech and has been under-explored.
In this paper, we will describe a method for extracting pronunciation features based on sponta-neous speech that is well motivated by theories and supported by empirical evaluations of feature per-formance. In conceptualizing and computing these features, we draw on the literature on automatic pro-nunciation evaluation for constrained speech. As de-scribed in the related work in Section 2, the widely used features for measuring pronunciation are (1) likelihood (posterior probability) of a phoneme be-ing spoken given the observed audio sample that is computed in a Viterbi decoding process, and (2) phoneme length measurements that are compared to standard references based on native speech.
However, we have also come up with unique solu-tions to address the issue of relatively low accuracy in recognizing spontaneous speech. Our methods of feature extraction are designed with considerations of how to best capture the quality of pronunciation given technological constraints.
The remainder of the paper is organized as fol-lows: Section 2 reviews the related research; Sec-tion 3 describes our method to extract a set of fea-tures for measuring pronunciation; Section 4 de-scribes the design of the experiments, including the questions investigated, the data, the speech process-ing technologies, and the measurement metrics; Sec-tion 5 reports on the experimental results; SecSec-tion 6 discusses the experimental results; and Section 7 summaries the findings and future research planned.
2 Related work
There is previous research on utilizing speech recog-nition technology to automatically assess non-native speakers’ communicative competence (e.g., fluency, intonation, and pronunciation). Witt (Witt, 1999) developed the Goodness of Pronunciation (GOP) measurement for measuring pronunciation based on
Hidden Markov Model (HMM) log likelihood. Us-ing a similar method, Neumeyer et al. (Neumeyer et al., 2000) designed a series of likelihood related pro-nunciation features, e.g., the local average likelihood and global average likelihood. Hacker et al. (Hacker et al., 2005) utilized a relatively large feature vector for scoring pronunciation.
Pronunciation has been the focus of assessment in several automatic speech scoring systems. Franco et al. (Franco et al., 2000) presented a system for au-tomatic evaluation of pronunciation quality on the phoneme level and the sentence level of speech by native and non-native speakers of English and other languages (e.g., French). A forced alignment be-tween the speech read by subjects and the ideal path through the HMM was computed. Then, the log posterior probabilities for a certain position in the signal were computed to achieve a local pronunci-ation score. Cucchiarini et al. (Cucchiarini et al., 1997a; Cucchiarini et al., 1997b) designed a system for scoring Dutch pronunciation along a similar line. Their pronunciation feature set was more extensive, including various log likelihood HMM scores and phoneme duration scores. In these two systems, the speaking skill scores computed on features by ma-chine are found to have good agreement with scores provided by humans.
A limited number of studies have been conducted on assessing speaking proficiency based on sponta-neous speech. Moustroufas and Digalakis (Mous-troufas and Digalakis, 2007) designed a system to automatically evaluate the pronunciation of foreign speakers using unknown text. The difference in the recognition results between a recognizer trained on speakers’ native languages (L1) and another recog-nizer trained on their learned languages (L2) was used for pronunciation scoring. Zechner and Be-jar (Zechner and BeBe-jar, 2006) presented a system to score non-native spontaneous speech using fea-tures derived from the recognition results. Follow-ing their work, an operational assessment system, SpeechRaterTM, was implemented with further im-provements (Zechner et al., 2007).
ex-ample, the acoustic model (AM) that was used to es-timate a likelihood of a phoneme being spoken was well-fitted to non-native speech acoustic properties. Further, other important aspects of pronunciation, e.g., vowel duration, have not been utilized as a fea-ture in the current SpeechRaterTMsystem. Likeli-hoods estimated on non-words (such as silences and fillers) that were not central to the measurement of pronunciation were used in the feature extraction. In addition, mis-recognized words lead to wrong like-lihood estimation. Our paper attempts to address all of these limitations described above.
[image:3.612.318.537.190.614.2]3 Extraction of Pronunciation Features
Figure 1 depicts our new method for extracting an expanded set of pronunciation features in a more meaning way.
Figure 1: Two-stage pronunciation feature extraction
We used two different AMs for pronunciation fea-ture extraction. First, we used an AM optimized for speech recognition (typically an AM adapted on non-native speech to better fit non-native speak-ers’ acoustics patterns) to generate word hypotheses; then we used the other AM optimized for pronun-ciation scoring (typically trained on native or near-native speech to be a good reference model reflect-ing expected speech characteristics) to force align the speech signals to the word hypotheses and to compute the likelihoods of individual words being spoken and durations of phonemes; finally new pro-nunciation features were extracted based on these measurements.
Some notations used for computing the pronunci-ation features are listed in Table 1. Based on these notations, the proposed new pronunciation features are described in Table 2. To address the limita-tions of previous research on automated assessment of pronunciation, which was described in Section 2, our proposed method has achieved improvements on (1) using the two-stage method to compute HMM
likelihoods using a reference acoustic model trained on native and near-native speech, (2) expanding the coverage of pronunciation features by using vowel duration shifts that are compared to standard norms of native speech, (3) and using likelihoods on the audio portions that are recognized as words and ap-plying various normalizations.
Table 1: Notations used for pronunciation feature extrac-tion
Variable Meaning
L(xi) the likelihood of word xi being spo-ken given the observed audio signal
ti the duration of word i in a response
Ts the duration of the entire response
T
n
X
i=1
ti, the summation of the duration
of all words, whereT ≤Ts
n the number of words in a response
m the number of letters in a response
R Tm
s, the frequency of letters (as the rate
of speech)
vi voweli
Nv the total number of vowels
Pvi the duration of vowelvi
¯
P the average vowel duration (across all
vowels in the response being scored)
Dvi the standard average duration of
vowel vi (estimated on a native speech corpus)
¯
D the averaged vowel duration (on all
vowels in a native speech corpus)
Svi |Pvi −Dvi|, duration shift of vowel
vi (measured as the absolute value of the difference between the duration of vowelviand its standard value)
Snvi |
Pvi
¯
P − Dvi
¯
D |, normalized duration shift of vowelvi(measured as the absolute value of the normalized difference be-tween the duration of vowelviand its standard value)
4 Experiment design
[image:3.612.83.294.310.376.2]Table 2: A list of proposed pronunciation features
Feature Formula Meaning
L1
n
X
i=1
L(xi) summation of likeli-hoods of all the indi-vidual words
L2 L1/n average likelihood
across all words
L3 L1/m average likelihood
across all letters
L4 L1/T average likelihood
per second
L5
n
X
i=1
L(xi)
ti
n average likelihood density across all words
L6 L4/R L4normalized by the
rate of speech
L7 L5/R L5normalized by the
rate of speech
¯
S
Nv X
i=1
Svi
Nv average vowel
dura-tion shifts
¯
Sn
Nv X
i=1
Snvi
Nv average normalized
vowel duration shifts
different acoustic models fitted to non-native and ex-pected speech respectively. Finally, we describe the evaluation criterion used in the experiment.
4.1 Research questions
In order to justify that the two-stage method for ex-tracting pronunciation features is a valid method that provides useful features for assessing pronunciation, the following questions need to be answered:
Q1: Can the words hypothesized be used to approx-imate the human transcripts in the forced align-ment step?
Q2: Are the new pronunciation features effective for assessment?
Q3: Can the likelihood-related features be im-proved when using only words correctly
recog-nized?
4.2 Data
Table 3 lists the data sets used in the experiment. Non-native speech collected in the TPO was used in training a non-native AM. For feature evaluations, we selected1,257responses from the TPO data
col-lected in 2006. Within this set,645responses were transcribed. Holistic scores were assigned by human raters based on a score scale of1(the lowest profi-ciency) to4(the highest proficiency).
In the TOEFLRNative Speaker Study, native
speakers of primarily North American English (NaE) took the TOEFLRtest and their speech files
were collected. This TOEFLRnative speech data
and some high-scored TPO responses were used in the adaptation of an AM representing expected speech properties. In addition, 1,602responses of native speech, which had the highest speech profi-ciency scores in NaE, were used to estimate standard average vowel durations.
Type Function Source Size
non-native speech
AM training TPO ∼30hrs feature
evalua-tion TPO col-lected in 2006
1,257
responses (645 with tran-scripts) native
or near-native speech
AM adaptation TPO and TOEFL Native
∼ 2,000
responses
estimation of standard vowel durations
TOEFL Native
1,602
[image:4.612.315.549.354.532.2]re-sponses
Table 3: Data sets used in the experiment
4.3 Speech technologies
For speech recognition and forced alignment, we used a gender-independent fully continuous HMM speech recognizer. Two different AMs were used in the recognition and forced alignment steps respec-tively.
and mixed with a large general-domain language model (trained from the Broadcast News (BN) cor-pus (Graff et al., 1997) of the Linguistic Data Con-sortium (LDC)). In the pronunciation feature extrac-tion process depicted in Figure 1, this AM was used to recognize non-native speech to generate the word hypotheses.
The AM used in the forced alignment was trained on native speech and high-scored non-native speech. It was trained as follows: starting from a generic recognizer, which was trained on a large and var-ied native speech corpus, we adapted the AM using batch-mode MAP adaptation. The adaptation corpus contained about2,000responses with high scores in
previous TPO tests and the TOEFLRNative Speaker
Study. In addition, this AM was used to estimate standard norms of vowels as described in Table 1.
4.4 Measurement metric
To measure the quality of the developed features, a widely used metric is the Pearson correlation (r)
computed between the features and human scores. In previous studies, human holistic scores of per-ceived proficiency have been widely used in esti-mating the correlations. In our experiment, we will use the absolute value of Pearson correlation with human holistic scores (|r|) to evaluate the features. Given the close relationship between pronunciation quality and overall speech proficiency, |r| is ex-pected to approximate the strength of its relationship with the human pronunciation scores.
5 Experimental Results
5.1 Results for Q1
When assessing read speech, the transcription of the spoken content is known prior to the assess-ment and used to forced-align the speech for fea-ture extraction. However, when assessing sponta-neous speech, we do not know the spoken content and cannot provide a correct word transcription for the forced alignment with imperfect speech recogni-tion. A practical solution is to use the recognition hypothesis to approximate the human transcript in the forced alignment. Since the recognition word ac-curacy on non-native spontaneous speech is not very high (for example, a word accuracy of about50%on the TPO data was reported in (Zechner et al., 2007)),
it is critical to verify that the approximation can pro-vide good enough pronunciation features compared to the ones computed in an ideal scenario (by using the human transcript in the forced alignment step).
We ran forced alignment on 645TPO responses with human transcriptions, using both the manual transcription and the word hypotheses from the rec-ognizer described in Section 4.3. Then, based on these two forced alignment outputs, we extracted the pronunciation features as described in Section 3.
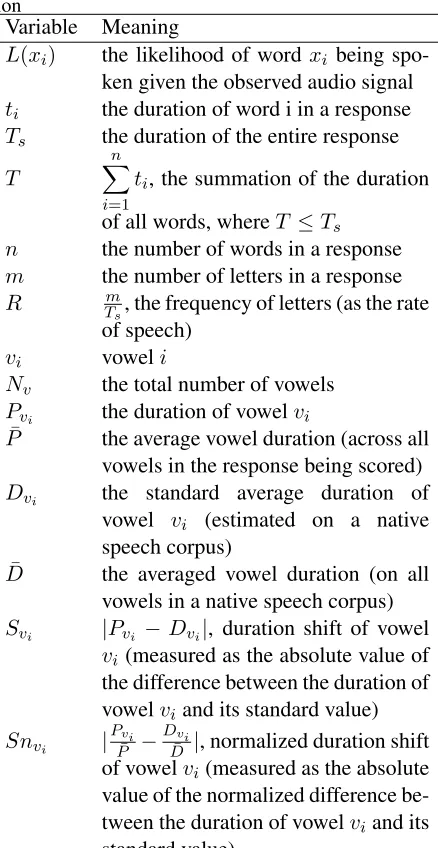
Table 4 reports the |r|s between the proposed pronunciation features and human holistic scores when using the forced alignment results from ei-ther transcriptions or recognition hypotheses. The relative|r|reduction (defined as(|r|transcriptions−
|r|hypotheses)/|r|transcriptions ∗ 100) is reported to
measure the magnitude reduction.
Based on the results shown in Table 4, we find that the pronunciation features computed based on the forced alignment results using transcriptions have higher|r|s with the human holistic scores than the
corresponding features computed based on the FA results using the recognition hypotheses. This is not surprising given that only50% ∼60% word accu-racy can be achieved when recognizing non-native spontaneous speech. However, the pronunciation features computed using the recognition hypothe-ses that is feasible in practice show some promising correlations to human holistic scores. For example,
L3, L6, and L7 have |r|s larger than 0.45 andSn¯
has an |r|larger than 0.35. Compared to the
cor-responding features computed using the FA results based on transcriptions, these promising pronuncia-tion features that can be obtained practically, show some reduction in quality (from 13.4% to 21.1%)
but are still usable. Therefore, our proposed two-stage method for pronunciation feature extraction is proven to be a practical way for the computation of features that have acceptable performance.
5.2 Result for Q2
Although our proposed modifications described in Section 3 have improved the meaningfulness of the features, an empirical study is needed to examine the actual utility of these features for the assessment of pronunciation.
Feature |r| using transcrip-tion
|r| using recog-nition hypothesis
relative |r| reduction (%)
L1 0.216 0.107 50.5
L2 0.443 0.416 6.1
L3 0.506 0.473 6.5
L4 0.363 0.294 19
L5 0.333 0.287 13.8
L6 0.549 0.475 13.5
L7 0.546 0.473 13.4
¯
S 0.396 0.296 25.3
¯
Sn 0.451 0.356 21.1
Table 4: |r|between the pronunciation features and hu-man holistic scores under two forced alignment input conditions (using transcriptions vs. using recognition hy-potheses) and relative|r|reduction
¯
Sn) show promising correlations to human holistic
scores. To check the quality of the newly developed pronunciation features, we compared these four fea-tures with the amscorefeature used in (Zechner et al., 2007) on the TPO data set collected in 2006 (with1,257responses). We first ran speech
recog-nition using the recognizer designed for non-native speech. The recognition results were used to com-pute the amscore, which is calculated by dividing the likelihood over an entire response by the number of letters. Then, we used the recognition hypothe-ses to do the forced alignment using the other AM trained on the native and near-native speech to ex-tract those four pronunciation features. Finally, we calculated the correlation coefficients between fea-tures and the human holistic scores. The results are reported in Table 5.
feature |r|to human holistic scores
amscore 0.434
L3 0.369
L6 0.444
L7 0.443
¯
[image:6.612.73.294.59.238.2]Sn 0.363
Table 5: A comparison of new pronunciation features to amscore, the one used in SpeechRaterTM
Compared to the feature amscore, L6 and L7
have slightly higher |r|s with the human holistic
scores. This suggests that our construct-driven ap-proach yields pronunciation features that are empiri-cally comparable or even better than theamscore. In addition,Sn¯ , a new feature representing the vowel
production aspect of pronunciation, shows a rela-tively high correlation with human holistic scores. This suggests that our new pronunciation feature set has an expanded coverage of pronunciation.
It is interesting to note thatL3has a lower|r|with
human holistic scores than the amscore does. Al-though the computation ofL3is quite similar to that
ofamscore, the major difference is that likelihoods of non-word portions (such as silences and fillers) are used to computeamscorebut notL3. This
sug-gests that likelihood-related pronunciation features that involve information related to non-words may perform better in predicting human holistic scores. For example, foramscore, the likelihoods measured on those non-word units were involved in the feature calculation; forL6andL7, the temporal information
of those non-word units (e.g., duration of units) was involved in the feature calculation1.
5.3 Result for Q3
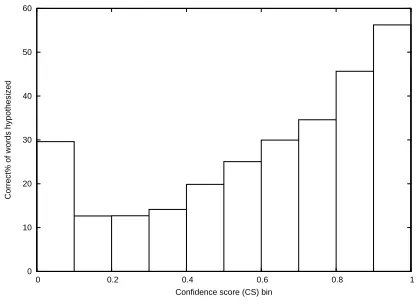
In the feature extraction, we used the words hy-pothesized by the speech recognizer as the input for the forced alignment. Since a considerable num-ber of words are recognized incorrectly (especially for non-native spontaneous speech), a natural way to further improve the likelihood related features is to only consider words which are correctly nized. A useful metric associated with the recog-nition performance is the confidence score (CS) out-put by the recognizer, which reflects the recognizer’s estimation about the probability that a hypothesized word is correctly recognized. The recognized words with high confidence scores tend to be correctly rec-ognized. Therefore, focusing on words recognized with high confidence scores may reduce the negative impact caused by recognition errors on the quality of the likelihood related features.
On the TPO data with human transcripts, we used the NIST’ssclitescoring tool (Fiscus, 2009) to mea-sure the percentage of correct words (correct%), which is defined as the ratio of the number of words
1L
6andL7useR, which is computed asTms, whereTs
correctly recognized given the number of words in the reference transcript. On all words (correspond-ing to confidence scores rang(correspond-ing from0.0to1.0), the
correct% is 53.3%. Figure 2 depicts the correct%
corresponding to ten confidence score bins ranging from0.0to1.0. Clearly, with the increase of the
con-fidence score, more words tend to be accurately rec-ognized. Therefore, it is reasonable to only use like-lihoods estimated on the hypothesized words with high confidence scores for extracting likelihood re-lated features.
0 10 20 30 40 50 60
0 0.2 0.4 0.6 0.8 1
Correct% of words hypothesized
[image:7.612.326.527.58.198.2]Confidence score (CS) bin
Figure 2: Correct% of words recognized across10 confi-dence score bins
On the TPO data set collected in 2006, we com-puted three likelihood related features (includingL3,
L6, and L7) only on words whose SC is equal to
or higher than a threshold (i.e., 0.5, 0.6, 0.7, 0.8,
and0.9) and measured the|r|of a feature with the human holistic scores. Table 6 lists the confidence score cutting thresholds, the percentage of words whose confidence scores are not lower than the cut-ting threshold selected, and |r| between each
like-lihood feature to human holistic scores. In the Ta-ble 6, we observe that only using words recognized with high confidence improves the correlations be-tween the features and the human holistic scores. One issue about only using words recognized with high confidence scores is that the number of words used in the feature extraction has been reduced and may reduce the robustness of the feature calculation.
Tc percentage of words whose CS ≥Tc(%)
L3
|r|
L6
|r|
L7
|r|
[image:7.612.87.297.251.403.2]0.0 100 0.369 0.444 0.443 0.5 84.21 0.38 0.462 0.461 0.6 77.07 0.377 0.465 0.464 0.7 69.31 0.363 0.461 0.461 0.8 60.86 0.371 0.466 0.466 0.9 50.76 0.426 0.477 0.475
Table 6:|r|betweenL3,L6, andL7and human holistic scores using only words recognized whose CSs are not lower than a threshold (Tc)
6 Discussion
To assess the pronunciation of spontaneous speech, we proposed a method for extracting a set of pro-nunciation features. The method consists of two stages: (1) recognizing speech using an AM well fit-ted to non-native speech properties and (2) forced-aligning the hypothesized words using the other AM, which was trained on native and near-native speech, and extracting features related to spectral properties (HMM likelihood) and vowel production. This method of using one AM optimized for speech recognition and another AM optimized for pronun-ciation evaluation is well motivated theoretically. The derived pronunciation features have also been found to have reasonably high correlations with hu-man holistic scores. The results support the link-age of the features to the construct of pronunciation and their utility of being used in a scoring model to predict human holistic judgments. Several contribu-tions of this paper are described as below.
evaluated. By using the recognition hypotheses from the recognition step as input in the forced alignment step, our experiments show a relatively small reduc-tion in correlareduc-tions with human holistic scores in comparison to the features based on the human tran-scriptions. This suggests that our method has po-tential to be implemented in a real-time operational setting.
Second, a few decisions we have made in com-puting the pronunciation features are driven by considerations of how these features are meaning-fully linked to the construct of pronunciation as-sessment. For example, we have excluded the HMM likelihoods on non-words (such as pauses and fillers) in the computations of likelihood-related features. In addition, only using words recognized with high confidence scores yields more informative likelihood-related features for assessing the quality of speech. The inclusion of vowel duration measures in the feature set expanded the coverage of the qual-ity of pronunciation.
7 Summary and future work
This paper presents a method for computing features for assessing the pronunciation quality of non-native spontaneous speech, guided by construct considera-tions. We were able to show that using a two-stage method of first recognizing speech with a non-native AM and then forced aligning of the hypothesis using a native or near-native speech AM we can generate pronunciation features with promising correlations with holistic scores assigned by human raters.
We plan to continue our research in the follow-ing directions: (1) we will improve the native speech norms for vowel durations, such as using the distri-bution of vowel durations rather than just the mean of durations in our feature computations; (2) we will investigate other aspects of pronunciation, e.g., consonant quality and word stress; (3) we will add other standard varieties of English (such as British, Canadian, Australian, etc) to the training corpus for the reference pronunciation model as the current model is trained on primarily North American En-glish (NaE).
References
J. Bernstein. 1999. PhonePass testing: Structure and construct. Technical report, Ordinate Corporation. C. Cucchiarini, H. Strik, and L. Boves. 1997a.
Au-tomatic evaluation of Dutch Pronunciation by us-ing Speech Recognition Technology. InIEEE Auto-matic Speech Recognition and Understanding Work-shop (ASRU), Santa Barbara, CA.
C. Cucchiarini, H. Strik, and L. Boves. 1997b. Us-ing Speech Recognition Technology to Assess Foreign Speakers’ Pronunciation of Dutch. In 3rd interna-tional symosium on the acquision of second language speech, Klagenfurt, Austria.
J. Fiscus. 2009. Speech Recognition Scoring Toolkit (SCTK) Version 2.3.10.
H. Franco, V. Abrash, K. Precoda, H. Bratt, R. Rao, and J. Butzberger. 2000. The SRI EduSpeak system: Recognition and pronunciation scoring for language learning. In InSTiLL (Intelligent Speech Technology in Language Learning), Dundee, Stotland.
D. Graff, J. Garofolo, J. Fiscus, W. Fisher, and D. Pallett. 1997. 1996 English Broadcast News Speech (HUB4). C. Hacker, T. Cincarek, R. Grubn, S. Steidl, E. Noth, and H. Niemann. 2005. Pronunciation Feature Extraction. InProceedings of DAGM 2005.
N. Moustroufas and V. Digalakis. 2007. Automatic pronunciation evaluation of foreign speakers using unknown text. Computer Speech and Language, 21(6):219–230.
L. Neumeyer, H. Franco, V. Digalakis, and M. Weintraub. 2000. Automatic Scoring of Pronunciation Quality. Speech Communication, 6.
S. M. Witt. 1999. Use of Speech Recognition in Computer-assisted Language Learning. Ph.D. thesis, University of Cambridge.
K. Zechner and I. Bejar. 2006. Towards Automatic Scor-ing of Non-Native Spontaneous Speech. In NAACL-HLT, NewYork NY.