Article
1
Lignin-Depolymerisation via UV-Photolysis and
2
Titanium Dioxide Photocatalysis
3
Xuan Tung Do1, Basma El Khaldi-Hansen1, Anke Nietsch2, Christian Jung2, Steffen Witzleben1
4
and Margit Schulze1*
5
1 Department of Natural Sciences, Bonn-Rhein-Sieg University of Applied Sciences,
6
Von-Liebig-Straße 20, 53359 Rheinbach, Germany; [email protected]
7
2 Institute of Solar Research and Solar Chemical Engineering, German Aerospace Centre,
8
Linder Höhe, 51147 Köln, Germany; [email protected]
9
* Correspondence: [email protected]; Tel.: +49-2241-865-566; Fax: +49-2241-865-8566
10
Abstract: Today, more than 70 million tons of lignin are produced by the pulp and paper industry
11
every year. However, the utilization of lignin as a source for chemical synthesis is still limited due
12
to the complex and heterogeneous lignin structure. The purpose of this study was a selective
13
photodegradation of industrially available kraft lignin in order to obtain appropriate fragments
14
and building block chemicals for further utilization, e.g. polymerization. Thus, kraft lignin
15
obtained from soft wood black liquor by acidification was dissolved in sodium hydroxide and
16
irradiated at a wavelength of 254 nm with and without the presence of titanium dioxide in various
17
concentrations. Analyses of the irradiated products via SEC showed decreasing molar masses and
18
decreasing polydispersity indices over time. At the end of the irradiation period the lignin was
19
depolymerised to form fragments as small as the lignin monomers. TOC analyses showed minimal
20
mineralisation due to the depolymerisation process.
21
Keywords: kraft lignin; photolysis; photocatalysis; actinometry; OH-number; SEC; UV-VIS;
22
ATR-FTIR; XRD
23
24
1. Introduction
25
Currently 95 % of all chemical substances are produced from petroleum. In view of the limited
26
occurrence and the rapid exhaustion of fossil resources, the efforts of many scientists are focusing on
27
the use of alternative sources [1]. One of the most promising alternatives could be lignin, which is
28
the third most common biopolymer on earth. Lignin is a complex, three-dimensional irregularly
29
cross-linked polymer which, as a constituent of woody plants, makes up one third of the dry mass of
30
the wood in addition to cellulose and hemicellulose [2]. Being produced as a by-product in the pulp
31
and paper industry in an amount of about 70 million tons per year, it is currently used solely as a
32
renewable combustible raw material for energy generation [3]. Despite recovery, some of the lignin
33
still finds its way into the environment with the wastewater. Since lignin is very resistant to
34
microbial degradation, it cannot completely be removed by conventional wastewater treatment
35
techniques [4].
36
An approach to overcome this difficulty is to irradiate the effluents with ultraviolet light (UV)
37
in the presence of titanium dioxide (TiO2) as a catalyst. By indirect photolysis and heterogeneous
38
photocatalysis, organic impurities such as lignin can completely be mineralised to carbon dioxide
39
and water [5]. However, the mechanism for wastewater treatment can also be used for controlled
40
depolymerisation of lignin. As it is a natural aromatic macromolecule, organic chemicals and
41
valuable substances can be extracted. Current work by Hansen et al. investigating the degradation
42
process on solid organosolv lignin using pyrolysis GC/MS showed pure lignin fractions and
43
phenolic products originating from monolignols [6]. Alvarado-Morales et al. performed
44
TiO2/UV-based photocatalytic degradation and quantified vanillic acid and ferulic acid as main
45
organic products. They found different yields of these products by varying reaction parameters such
46
photocatalysis in a critical review [9].
51
This scientific work includes the photolytic and photocatalytic degradation of lignin at the
52
molecular level. Influences of irradiation time and photocatalyst concentration on the degradation
53
process were investigated. The degradation products were analysed by chromatography (SEC),
54
spectroscopy (ATR-FTIR, UV-VIS) and wet-chemistry (OH-number, total organic carbon (TOC)).
55
2. Results
56
2.1. X-Ray Powder Diffraction of the Photocatalyst
57
The photocatalyst used for the experiments was analysed using X-ray powder diffraction.
58
Using the software Bruker Diffrac.EVA, the crystallinity was determined. The provided AEROXIDE
59
P25® shows a crystalline and amorphous share of 90.5 % and 9.5 %, respectively. As titanium
60
dioxide naturally exists in three different crystal modifications, namely anatase, rutile and brookite
61
[9], and these have different photocatalytic activities, the three modifications were quantified using
62
Rietveld refinement (Bruker Diffrac.TOPAS). The provided titanium dioxide is found to be 85.49 %
63
anatase, 14.30 % rutile and 0.21 % brookite. Considering the amorphous share, the total composition
64
is 77.4:12.9:0.2:9.5 (anatase:rutile:brookite:amorphous share).
65
2.2. Characterisation of the Annular Reactor
66
As the radiation output of the used UV-lamp is not constant over its entire life span, the
67
performance of the lamp was evaluated before and after the experimental program using
68
Hatchard/Parker-actinometry. The UV-radiation output was 15’800 mW at the beginning and 12’200
69
mW at the end. To estimate the actual output at the beginning of each irradiation experiment, the
70
determined outputs were interpolated in a linear fashion.
71
2.3. Total Hydroxyl Group Determination
72
For future synthesis of polyurethanes, the knowledge of the total hydroxyl group content is
73
important. Therefore, this parameter was determined using a method based on ISO 14900:2001 (E).
74
Figure 1 shows the development of the hydroxyl group content over the course of the irradiation
75
experiment. As the withdrawn sample volume of 300 mL each compared to the starting volume of
76
5’000 mL is not insignificant and the radiation output remains almost constant during the
77
experiment, the radiation power needs to be weighted for the volume which is irradiated. With
78
proceeding irradiation times, a decrease in total hydroxyl group content can be observed,
79
81
Figure 1. Total hydroxyl group content of the irradiated lignins plotted versus the cumulated
82
weighted radiation power.
83
2.4. pH-Value
84
The pH-value of the lignin solutions was monitored during the irradiation process and is
85
depicted in Figure 2. A decrease in pH-value can be observed for all experiments, independent from
86
the catalyst concentration being used.
87
0 10 20 30 40
10 11 12 13 14
Cum. weighted radiation power [W*min*mL-1] 0.00 g*L-1 0.25 g*L-1 0.50 g*L-1
88
Figure 2. pH-values of the lignin solutions during the irradiation process.
89
2.5. Total Organic Carbon
90
As depicted in Figure 3 the content of total organic carbon (TOC) decreases with the proceeding
91
irradiation process while the content of inorganic carbon (IC) increases. A correlation between the
92
0 10 20 30 40 60
70 80
Cum. weighted radiation power [W*min*mL-1] 0.50 g*L-1
94
Figure 3. (a) TOC and (b) IC of the lignin solutions during the irradiation process.
95
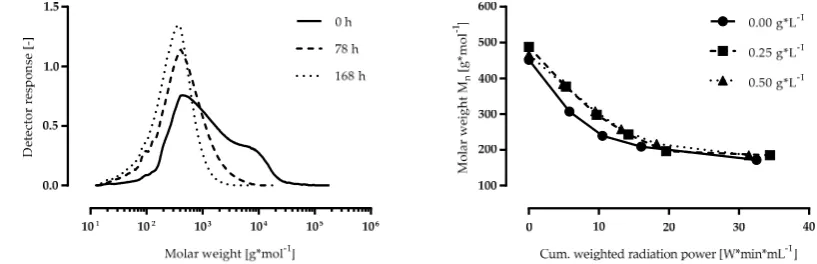
2.6. Size Exclusion Chromatography
96
To evaluate the impact of the irradiation process on the molecular weight of lignin, size
97
exclusion chromatography was performed on the isolated samples. Figure 4a shows the molar
98
weight distribution of the lignins isolated from the irradiation experiment using 0.25 g*L-1 of the
99
catalyst. All curves are normalised so that changes in the shape of the curves can be evaluated more
100
easily. The longer the lignin solution was irradiated, the more the maximum of the respective curve
101
is shifted towards smaller molar weights. Furthermore, the width of the respective curve decreases
102
with the proceeding irradiation process. Figure 4b shows the changes in the number average molar
103
weight for all the irradiation experiments. All curves show the same trend. The number average
104
molar weight decreases over the course of the irradiation experiment, independent from the catalyst
105
concentration being used.
106
107
Figure 4. (a) Molar weight distribution of the lignins isolated. The areas under the curves are
108
normalised. (b) Changes in number average molar weight (Mn).
109
2.7. UV-VIS Spectroscopy
110
UV-VIS-spectra of the irradiated and isolated lignins were recorded in aqueous sodium
111
hydroxide. As all spectra look similar, the spectra of the lignins from the irradiation experiment
112
using 0.00 g*L-1 of the catalyst are depicted in Figure 5. For easier comparison, the spectra are
113
normalised to their maximum. The unirradiated lignin shows an absorption shoulder at 280-295 nm,
114
which gradually disappears with the proceeding irradiation process until it cannot be identified
115
Ex
ti
n
cti
o
n
[
-]
117
Figure 5. UV-VIS-spectra of the irradiated lignins. Spectra are height normalised.
118
2.8. ATR-FTIR Spectroscopy
119
FTIR-spectra of the lignins were recorded using the ATR technique. Since the spectra of the
120
different irradiation experiments almost look the same, only the spectra of the experiment using 0.25
121
g*L-1 are depicted in Figure 6.
122
123
Figure 6. ATR-FTIR-spectra of the irradiated lignins.
124
An assignment of the absorption bands to the functional groups is shown in Table 1.
125
Comparing the FTIR-spectra shows that the absorption band at 3’380 cm-1 which is caused by the
126
hydroxyl group in relation to the band at 2’980 cm-1 decreases with the irradiation progress. Relating
127
the band at 1’700 cm-1 to the band at 1’600 cm-1 an increase of the band at 1’700 cm-1 can be observed.
128
A decrease of the bands at 1’510 cm-1 and 1’460 cm-1 can also be observed.
3’380 3’650-3’200 O-H stretching vibration
2’980 3’000-2’840 C-H stretching vibration in -CH, -CH2 or
-CH3
1’700 1’707-1’690 C=O stretching vibration (conjugated)
1’600 1’625-1’575 arC-C vibration
1’510 1’525-1’475 arC-C vibration
1’460 1’475-1’430 Asymmetric deformation vibration of
-CH2 and -CH3
3. Discussion
132
Analysis of the degraded lignins showed that the total hydroxyl group content decreases with
133
increasing irradiation times. This observation was also made by Wang et al. who discovered a
134
reduction of phenolic hydroxyl group content by up to 41 % [11]. The herein presented results
135
suggest a reduction of total hydroxyl group content by up to 100 %.
136
These results must be interpreted with caution, as all samples were prepared by acidic
137
precipitation without further washing. As acidity of the samples was not corrected for, remaining
138
acid from the precipitation process might interfere with the results. However, the same trend could
139
be validated by means of ATR-FTIR.
140
The recorded ATR-FTIR-spectra indicate a reduction of OH-stretching vibration (3’380 cm-1) in
141
relation to the aliphatic CH-stretching vibration (2’980 cm-1) and simultaneously an increase of the
142
conjugated C=O-stretching vibration (1’700 cm-1). At the same time, a decrease of aromatic vibrations
143
(1’510 cm-1 and 1’460 cm-1) can be observed. As the TiO2/UV-process is described to have an
144
oxidative mechanism it is plausible that hydroxyl groups are first oxidised to form carbonic acids
145
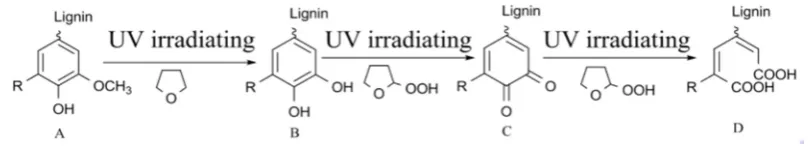
and then ultimately mineralised to carbon dioxide and water [12]. Wang et al. postulated a
146
mechanism for the formation of carbonic acids from lignin depicted in Figure 7.
147
148
149
Figure 7. Reaction mechanism for the decolourisation of lignin via UV-irradiation in THF.
150
Reproduced from Wang et al. [11].
151
The formation of carbonic acids and carbon dioxide might also be a possible explanation for the
152
decrease in pH-value. Figure 7 shows the destruction of the aromatic ring which is consistent with
153
the findings obtained by ATR-FTIR as well as UV-VIS spectroscopy.
154
UV-VIS spectroscopy shows an absorption shoulder for untreated lignin at 280-295 nm which
155
can be assigned to the structure of the monomers coniferyl alcohol and sinapyl alcohol [13]. The
156
dissolution of this absorption shoulder correlates with the decrease of aromatic vibrations and
157
strengthens the evidence for the destruction of the aromatic ring suggested by Wang et al. [11].
158
The formation of carbon dioxide was proven by TOC measurements indicating an increase of
159
inorganic carbon content. This observation can be explained by partial mineralization of lignin (30
160
%), further proving the oxidative character of the TiO2/UV process. Carbon dioxide formation could
161
also be observed by Ohnishi et al. by means of gas chromatography [12].
162
As it was intended to depolymerise lignin, size exclusion chromatography is the method of
163
choice for evaluating the lignin fragments. Prado et al. investigated the depolymerisation of
164
organosolv lignin showing a reduction in molar weight from 941 g*mol-1 down to 763 g*mol-1 [14].
As a matter of fact, our results even show a decrease from approx. 500 g*mol-1 down to 170 g*mol-1
166
correlating with the average molar weight of the lignin monomers of 180 g*mol-1 (paracoumaryl
167
alcohol: 150 g*mol-1, coniferyl alcohol: 180 g*mol-1, sinapyl alcohol: 210 g*mol-1).
168
Since the commercial catalyst AEROXIDE P25® is a mixture of titanium dioxide modifications
169
with anatase being the photocatalytically most active one, the composition was determined using
170
x-ray powder diffraction together with Rietveld refinement. The total composition of the provided
171
AEROXIDE P25® was 77.4:12.9:0.2:9.5 (anatase:rutile:brookite:amorphous share) confirming the
172
findings of Ohtani et al. reporting a composition of 78:14:8 (anatase:rutile:amorphous share) [15].
173
Although the provided photocatalyst could positively be identified as the highly active
174
AEROXIDE P25®, no significant differences regarding the analytical results could be observed,
175
when comparing the catalyst concentrations used. One plausible explanation could be that on the
176
one hand the used catalyst:lignin ratio was too low and on the other hand the lignin concentration
177
was too high. Previous studies reported catalyst:lignin ratios of 50:1 [11], 5:1-200:1 [16] or 1:1,8-1,6:1
178
[17]. The catalyst:lignin ratios used by us (0:1-1:10) and the high lignin concentration might result in
179
total absorption of UV-radiation solely by lignin, thus leading to a pure photolysis instead of
180
photocatalysis, rendering the photocatalyst ineffective as described by Kansal et al. [16]. A reduction
181
of chemical oxygen demand and UV-absorption was also observed by Chang et al. who investigated
182
the degradation of lignin via pure photolysis [5].
183
4. Materials and Methods
184
4.1. Precipitation of Lignin from Black Liquor
185
Kraft-lignin was isolated from soft wood black liquor by acidic precipitation. Prior to
186
acidification, the black liquor provided by ZPR (Rosenthal, Germany) was vacuum filtrated using
187
filter papers with 12-15 µm particle retention. Under constant stirring sulfuric acid (25 vol. %) was
188
added dropwise. After reaching a pH-value of 2 the suspension was stirred for another 1 h before it
189
was centrifuged at 3’000 rpm for 15 mins. For washing, the supernatant was discarded, replaced
190
with deionised water, re-suspended and centrifuged again. The washed lignin (3 times) was then
191
freeze-dried for 48 h.
192
4.2. Irradiation Experiments
193
For the irradiation process a reactor comprising a water-cooled quartz annulus with an
194
UV-lamp (UVX 60 by UV-Technik, Germany), a 5 L reservoir and a centrifugal pump was used. The
195
previously prepared lignin was dissolved in aqueous sodium hydroxide solution (5 g*L-1 in 0.1
196
mol*L-1) and added with different amounts of AEROXIDE P25® (0.00 g*L-1, 0.25 g*L-1 and 0.50 g*L-1).
197
5 L of the solution were irradiated at room temperature for up to 7 days and samples of 300 mL were
198
taken daily.
199
4.3. Isolation of Fragmented Lignins
200
For further analysis, the irradiated lignins were isolated in a process analogue to the process
201
mentioned above. Instead of precipitating the irradiated lignins at a pH-value of 2, which usually
202
gives the highest yield [18], a pH-value of 1 was chosen, as some of the irradiated lignins remain
203
dissolved at a pH-value of 2. Also, the precipitated lignins were not washed, as some of the lignins
204
even were soluble in deionized water. Prior to acidification the AERODIDE P25® was removed by
205
vacuum filtration using filter papers with 0.45 µm particle retention.
206
4.4. Hatchard/Parker Actinometry
207
The characterisation of the annular reactor was performed as described by Hatchard and Parker
208
1953. Before the actinometry could be performed, the apparatus including all sample containing
209
glassware were completely covered in aluminium foil, as the reaction used to determine the
210
UV-power is sensitive to light. For the quantification of Fe2+-ions in form of the ferroin-complex a
211
calibration in a range of 0.04-8.00 mg*L-1 was prepared. In addition, 5 L of a 50 mmol*L-1
4.5. OH-Number Determination via Acetylation
216
For the determination of the OH-number a procedure based on ISO 14900:2001 (E) was used.
217
Modifications were made regarding the acetylation temperature and time as well as the sample
218
amount and the amount of the acetylation reagent. Thus, 25 mg of the lignins were weighed into a
219
1.5 mL reaction vessel and added with 850 µL acetylation reagent. Inspired by Clauss et al. [19] and
220
Baumberger et al. [20], who acetylated their samples at room temperature for 20 h and 6 days,
221
respectively, an acetylation time of 72 h at room temperature was chosen. Excess of acetic anhydride
222
was titrated with 0.2 mol*L-1 sodium hydroxide using an automated titrator (Stabino PMX 400 by
223
Particle Metrix, Germany). All measurements were repeated 6 times.
224
4.6. Total Organic Carbon (TOC)
225
For TOC analysis, all samples taken from the reactor were diluted 1/20 in 0.1 mol*L-1 aqueous
226
sodium hydroxide and measured in triplicates (TOC-L by Shimadzu, Japan).
227
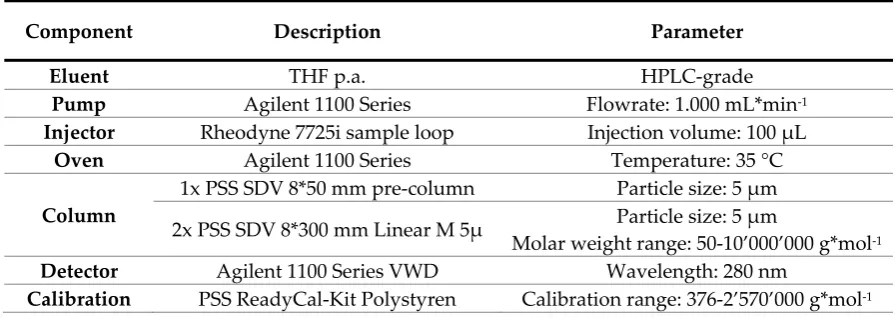
4.7. Size-exclusion Chromatography (SEC)
228
To evaluate the depolymerisation of the lignins SEC was performed using the parameters
229
shown in Table 2. Samples with a concentration of 2 mg*mL-1 were prepared in THF and filtrated
230
with 0.2 µm PTFE filters prior to analysis. For molar weight evaluation polystyrene was used as a
231
calibration standard.
232
Table 2. SEC set up and parameters.
233
Component Description Parameter
Eluent THF p.a. HPLC-grade
Pump Agilent 1100 Series Flowrate: 1.000 mL*min-1
Injector Rheodyne 7725i sample loop Injection volume: 100 µL
Oven Agilent 1100 Series Temperature: 35 °C
Column
1x PSS SDV 8*50 mm pre-column Particle size: 5 µm
2x PSS SDV 8*300 mm Linear M 5µ Particle size: 5 µm
Molar weight range: 50-10’000’000 g*mol-1
Detector Agilent 1100 Series VWD Wavelength: 280 nm
Calibration PSS ReadyCal-Kit Polystyren Calibration range: 376-2’570’000 g*mol-1
4.8. UV-VIS Spectroscopy (UV-VIS)
234
UV-VIS-spectra were recorded in a wavelength range of 190-800 nm (DR 6000 by Hach Lange,
235
Germany) using 10 mm quartz cuvettes. Therefore 5 mg of the lignins were dissolved in 100 mL of
236
0.1 mol*L-1 aqueous sodium hydroxide [21].
237
4.9. ATR-FTIR Spectroscopy (ATR-FTIR)
238
ATR-FTIR-spectra were recorded in a wavenumber range of 4’000-400 cm-1 with a resolution of
239
4 cm-1 (Vertex 70 and Platinum ATR Diamond by Bruker, USA). For noise reduction, each sample
240
was measured 96 times. Since the irradiated lignins were not washed after precipitation all spectra
241
had to be compensated for the presence of sodium hydrogen sulphate.
242
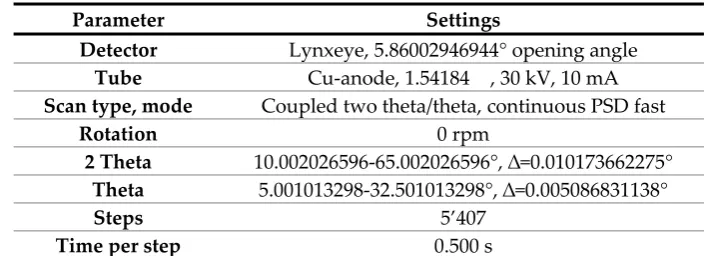
4.10. Powder X-ray Diffraction (XRD)
244
The characterisation of AEROXIDE P25® was performed using a bench top x-ray diffractometer
245
(D2 PHASER by Bruker, USA) with the parameters described in Table 3.
246
Table 3. XRD set up and parameters.
247
Parameter Settings
Detector Lynxeye, 5.86002946944° opening angle
Tube Cu-anode, 1.54184 , 30 kV, 10 mA
Scan type, mode Coupled two theta/theta, continuous PSD fast
Rotation 0 rpm
2 Theta 10.002026596-65.002026596°, ∆=0.010173662275° Theta 5.001013298-32.501013298°, ∆=0.005086831138°
Steps 5’407
Time per step 0.500 s
5. Conclusions
248
This study aimed to describe the impact of UV irradiation time and catalyst concentration on
249
the photocatalytical or rather the photolytical depolymeration of lignin into valuable chemical
250
building blocks. Using a variety of analytical methods (chromatography, spectroscopy and
251
wet-chemistry) it could be shown that the lignin was selectively depolymerised to the size of its
252
monomers and even partially mineralised proving the oxidative character of the degradation
253
process. For the chosen catalyst concentration no significant differences could be found confirming
254
the photolytical origin of the lignin fragmentation process.
255
256
Acknowledgments: Financial support by Federal Ministry of Education and Reserach (BMBF) program
257
“Forschung an Fachhochschulen“ project FKZ03FH013IX4.
258
Author Contributions: Xuan Tung Do: main part including lignin isolation and photolysis studies, result
259
development, wrote the paper; Basma El Khaldi-Hansen: support in writing; Anke Nietsch: support in
260
photocatalytic experiments, in particular long-term studies; Christian Jung: conducting the experimental setup
261
for photolysis and photocatalysis; Steffen Witzleben: planning studies, lignin isolation and XRD studies; Margit
262
Schulze: planning studies, conducting experimental investigation and results discussion, coordination of
263
writing and editing.
264
Conflicts of Interest: The authors declare no conflict of interest.
265
References
266
1 Beller, M., Centi, G., Sun, L., Chemistry Future: Priorities and Opportunities from the Sustainability
267
Perspective. Chem Sus Chem 2017, 10, pp. 6–13.
268
2 Chen, L. et al., Conversion of lignin model compounds under mild conditions in pseudo-homogeneous
269
systems. Green Chem 2016, 18, pp. 2341-2352.
270
3 Fang, Z.; Smith, R.L., Jr. Production of Biofuels and Chemicals from Lignin; Springer Science + Business
271
Media Singapore: Singapore, 2016; Chapter 1; pp. 3–33.
272
4 Ma, Y.S. et al., Photocatalytic degradation of lignin using Pt/TiO2 as the catalyst. Chemosphere 2008, 71, pp.
273
998-1004.
274
5 Chang, C.N. et al., Decolorizing of lignin wastewater using the photochemical UV/TiO2 process.
275
Chemosphere 2004, 56, pp. 1011-1017.
276
6 Hansen, B. et al., Qualitative and quantitative analysis of lignin produced from beech wood by different
277
conditions of the organosolv process. J Polym Environ 2016, 24, pp. 85-97.
278
7 Alvarado-Morales, M. et al., TiO2/UV based photocatalytic pretreatment of wheat straw for biogas
279
production. Anaerobe 2016, in press.
280
8 Nair, V. et al., Production of phenolics via photocatalysis of ball milled lignin-TiO2 mixtures in aqueous
281
11 Wang, H. et al., ZnCl2 induced catalytic conversion of softwood lignin to aromatics and hydrocarbons.
287
Green Chem 2016, 18, pp. 2802-2810.
288
12 Ohnishi, H. et al., Bleaching of lignin solution by a photocatalyzed reaction on semiconductor
289
photocatalyst. Ind Eng Chem Res 1989, 28, pp. 719-724.
290
13 Jablonsky,M. et al., Characterization and comparison by UV spectroscopy of precipitated lignins and
291
commercial lignosulfonates. Cell Chem Technol 2015, 3-4, pp. 267-274.
292
14 Prado, R. et al., Effect of the photocatalytic activity of TiO2 on lignin depolymerisation. Chemosphere 2013,
293
91, pp. 1355-1361.
294
15 Ohtani, B. et al., What is Degussa (Evonic) P25? Crystalline composition analysis, reconstruction from
295
isolated pure particles and photocatalytic activity test. J Photoch Photobio A 2010, 216, pp. 179-182.
296
16 Kansal, S.K. et al., Studies on TiO2/ZnO photocatalysed degradation of lignin. J Hazard Mater 2008, 153, pp.
297
412-417.
298
17 Kumar, P. et al., Titanium dioxide photocatalysis for the pulp and paper industry water treatment. Indian J
299
Sci Technol 2011, 4, pp. 327-332.
300
18 Toledano, A. et al., 2009. Characterization of lignins obtained by selective precipitation, Seperation and
301
Purification Technology, 68. Jg., pp.193-198.
302
19 Clauss, M.M. et al., 2015. Size-Exclusion Chromatography and Aggregation Studies of Acetylated Lignins
303
in N,N-Dimethylacetamide in the Presence of Salts. Macromolecular Chemistry and Physics, 216(20), pp.2012–
304
2019.
305
20 Baumberger, S. et al., 2007. Molar mass determination of lignins by size-exclusion chromatography:
306
Towards standardisation of the method. Holzforschung, 61(4), pp.459–468.
307
21 Gonzalez Arzola, K. et al., 2006. Early attack and subsequent changes produced in an industrial lignin by a
308
fungal laccase and a laccase-mediator system: an analytical approach. Applied Microbiology and