Article
Estimation and mapping of sub-national GDP in
Uganda using NPP-VIIRS imagery
Xuantong Wang 1,*, Mickey Rafa 2, Jonathan D. Moyer 2, Jing Li 1, Paul Sutton 1, and Jennifer Scheer3
1 Department of Geography and the Environment, University of Denver, Denver, CO 80208, USA; [email protected]
2 The Frederick S. Pardee Center for International Futures Josef Korbel School of International Studies, University of Denver, 2201 South Gaylord Street, Denver, CO 80208-0500; [email protected]
2 The Frederick S. Pardee Center for International Futures Josef Korbel School of International Studies, University
of Denver, 2201 South Gaylord Street, Denver, CO 80208-0500; [email protected]
1 Department of Geography and the Environment, University of Denver, Denver, CO 80208, USA;
1 Department of Geography and the Environment, University of Denver, Denver, CO 80208, USA; [email protected]
3 USAID/Uganda Monitoring, Evaluation and Learning Program, Kampala, Uganda; [email protected] * Correspondence: [email protected]; Tel.: +01-510-599-8566
Abstract: Uganda is one of the poorest nations in the world. To address the developmental challenges and understand social and economic status, it is important to obtain accurate data in a timely manner. Many studies have demonstrated that nighttime lights (NTL) can be used to measure human activities. Nevertheless, methods developed from these studies (1) suffer from coarse resolutions, (2) fail to capture the nonlinearity and multi-scale variability of geospatial data, and (3) perform poorly for agriculture-dependent regions. This study proposes a new enhanced light intensity model (ELIM) to estimate the Gross Domestic Product (GDP) at sub-national scales for Uganda. This model is developed by combining the NTL data from the Suomi National Polar-orbiting Partnership Visible Infrared Imaging Radiometer Suite (NPP-VIIRS), the population data from the Global Human Settlement Layer (GHSL), and information on agricultural production and market prices across several commodity types. This resulted in a gridded dataset for GDP and GDP per capita for Uganda at 1 km spatial resolution and district level to capture the spatial heterogeneity in economic activity.
Keywords: GDP; Nighttime lights; agriculture; development
1. Introduction
It is important to obtain accurate socioeconomic in a timely manner to evaluate the current development status in Africa and address developmental challenges. For example, measures like the Gross Domestic Product (GDP) can help us assess the dynamics of urban development. GDP, one of the most widely used metric of national economic progress, measures the total amount of goods and services produced in a country. Nevertheless, only aggregate data measuring national GDP and GDP per capita exist for many African countries like Uganda. There is a clear interest in understanding how GDP and GDP per capita are distributed throughout Uganda at multiple scales to target poverty interventions and bring
greater prosperity to more people. For instance, there is a very strong correlation between GDP per capita and the Human Development Index (HDI), particularly for low-income countries [1].
There are many challenges to measuring GDP accurately. For example, accurate information about the size and distribution of the human population is not available for many regions around the world, and sometimes these data have poor quality [2]. National censuses are not able to capture the human mobility or activity as they are conducted residentially. Additionally, national censuses often release their results with limited resolution below the national level, as is the case with Uganda [3]. Cross-country measurements of GDP lack standardized accounting methods and have inconsistent data collection methodologies [4]. Satellite-based nighttime light (NTL) data can provide us a unique method to visualize and analyze the spatial distribution of socioeconomic environment in a consistent, efficient and low-cost manner. By monitoring the anthropogenic nocturnal light intensity, these satellite image derived data products can help us evaluate human activities at multiple spatiotemporal scales.
In past decades, many studies have utilized the Defense Meteorological Satellite Program’s Operational Linescan System (DMSP-OLS) NTL data to analyze various socioeconomic indicators like GDP and electric power consumption (ECP). For instance, some researchers used the DMSP-OLS NTL imagery to generate and demonstrate the quantitative relationships between the NTLs and population and energy consumption in the USA [5,6]. Nevertheless, the DMSP-OLS satellite imagery suffers from significant deficiencies like coarse spatial resolution, saturation on bright lights, and the lack of in-flight calibration [7]. On October 28, 2011, the launch of the Suomi National Polar-Orbiting Partnership (NPP) marked a new generation of operational polar-orbiting spacecraft [8]. NPP-VIIRS exceeds its predecessors with its unique features including finer spatial resolution for all bands and a day night band (DNB) that can collect low-light imaging data. Thus, due to the improved NTL detecting ability, NPP-VIIRS have been applied in many fields that were dominated by DMSP-OLS.
The objectives of this study are to utilize the NPP-VIIRS NTL imageries to map sub-national socioeconomic development in Uganda. We conduct our analysis using NPP-VIIRS nightlight imagery covering Uganda for the year 2015, agricultural production and commodity price information [9], and population data from the Global Human Settlement Layer. The structure of the paper is organized as follows: A detailed description of case study area, NTL data, and agricultural production data are presented in Section 2. The data processing and methods used in this study will be described in Section 3. We will then present the estimation results and discuss the performance of our methods by comparing with other existing methods. Finally, we summarize results and draw conclusions in the last section.
2. Case Study Area and Data
2.1. Case Study Area
2.2. Data Collections
2.2.1. Nighttime Satellite Imagery
The NPP-VIIRS NTL imagery was used to estimate the urban economic activities for each district in Uganda. The total estimated economic activities attributed to the commercial and industrial activities were calculated based on the total light intensity values within the districts. We selected the NPP-VIIRS "vcm-orm-ntl" product (VIIRS Cloud Mask - Outlier Removed - NTLs, obtained from http://ngdc.noaa.gov/eog/viirs/download_viirs_ntl.html ) for extracting urban and rural regions and estimating productivity from urban locations. This product contains cloud-free average radiance values with outliers (including fires and other ephemeral light) removed. NPP-VIIRS is a stable, cloud-free, NTL intensity data source produced by the National Oceanic Atmospheric Administration (NOAA) and the National Aeronautics and Space Administration (NASA). Each square kilometer grid contains relative digital number (DN) values from 0 to 214, which indicates the intensity of NTL. Many studies have utilized NPP-VIIRS data for analyzing a range of socioeconomic phenomena from a distance. NPP-VIIRS is suitable for detecting subnational activities because it captures high-radiance images and gathers information at roughly 0.5 km2 level with high dynamic range [11]. Due to the improved NTL detecting ability, NPP-VIIRS have been applied in many fields that were dominated by DMSP-OLS. For example, Shi et al. [12] used NPP-VIIRS to extract built-up urban areas of 12 cities in China and they found that NPP-VIIRS data have higher spatial accuracies than those from DMSP-OLS data for all 12 cities. They concluded that these improvements are due to its high spatial resolution and wide radiometric detection range.
2.2.2. Population and Agricultural Data
The spatial population information was obtained from the Global Human Settlement Layer (GHSL) dataset, which was mapped based on the Landsat imagery to show the global built-up areas and population distribution from 1975 to 2014 [13]. The GHSL framework produces global spatial information in the form of built up maps, population density maps, and settlement maps about the human presence on Earth’s surface over time. GHSL population grid shows the distribution and density of population. The population grid information is disaggregated from census or administrative units to number of people per cell (250m and 1km spatial resolution).
This model uses district-level agricultural data to supplement the spatial data in the model.
Agricultural activity is not as light intense as commercial activities, so it would be underrepresented in a model based solely on nighttime lights. Taken together, nighttime lights (representing higher value-add economic activity) and agricultural production (an important aspect of Uganda’s economy) provide a broad-based estimate of economic activity at the subnational level. This forms the conceptual foundation for the Enhanced Light Intensity Model.
These estimates use data on 16 representative agricultural commodities (production and average market price) to derive an estimate of the spatial distribution of agricultural GDP in Uganda. A mix of annual crops and perennial crops are included as well as cattle, Uganda’s primary animal industry. These representative commodities include maize, millet, sorghum, rice, beans, cow peas, soya beans, groundnuts, sim sim, banana, cassava, sweet potatoes, Irish potatoes, coffee, cotton, and cattle. These are representative agricultural commodities and do not constitute the total agricultural output of each district, so national agricultural GDP is used to normalize these estimates.
Coffee is Uganda’s top export and is divided among arabica and robusta varieties. Production data by district and variety are not readily available, so, in an attempt to estimate the geographic distribution of production value from coffee, a multi-step process is used. Census reports from the Uganda Bureau of Statistics provide information on the share of households engaged in coffee production [17] and the total number of households per district [18]. A map produced by Geo Gecko in 2017 delineates the share of production per district among robusta and arabica among five categories: fully arabica, mostly arabica, fifty-fifty, mostly robusta, and fully robusta [19]. Finally, the 2008/009 Census of Agriculture provides total production data by geographic region for arabica and robusta varieties. These data sources are combined to arrive at a production estimate by district and variety. Price data were derived from average weekly commodity prices recorded at markets in 2015 in Gulu, Mbale, Mbarara, and Kampala, sourced from FIT Insights Group Limited [20]. We chose to use 2015 data for commodity prices, because it was a relatively stable agricultural year. Average coffee prices are taken from the Uganda Coffee Development Authority from October 2014 to September 2015 [21].
3. Methods
3.1. Data Pre-processing
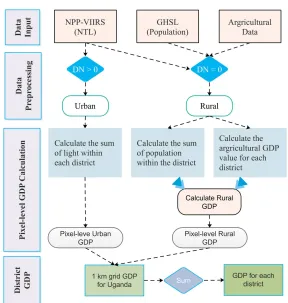
The NPP-VIIRS imagery is processed based on the DN values - pixels with DN value of 0 and pixels with positive DN values. Following the method developed by Gosh et al. [22], we assume that: (1) NPP-VIIRS imagery with pixel value > 0 can represent the urban region that mainly consist of secondary and tertiary economic activities, and (2) NPP-VIIRS imagery with pixel value = 0 represents rural regions that mainly consist of agricultural activities. Therefore, the NPP-VIIRS NTL imagery is mainly used to extract and estimate the urban GDP value, whereas the population and agricultural production and price data are used to estimate rural GDP value. In addition, pixels with non-positive DN values are re-assigned to 0.
3.2. Model and Simulation of GDP
Figure 1. Estimating sub-national GDP using ELIM method.
We defined the district agricultural value ratio (DAVR) as follows to measure agricultural production in rural regions,
= ∑ ∗ (1)
where i is the type of the agricultural product, d is the total number of types of the agricultural product, Xj is the production of the corresponding agricultural product, is the average crop price of the agricultural product, and NTA is the national total agricultural GDP.
Then, the rural pixel value ( ) of rural GDP are:
= ∗ ∗ (2)
where i is the ID of rural pixel (population layer), PNi is the population value of the corresponding pixel, TRP is the total rural population value, and AGDP is the total agricultural GDP of the country
Furthermore, we defined urban GDP pixel value ( ) as follows:
= ∗ (3)
4. Results and Discussion
4.1. District GDP per capita results
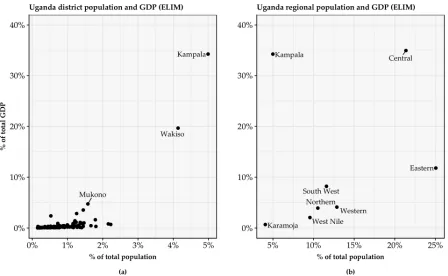
Figure 2 shows the GDP and GDP per capita for all 116 districts in Uganda (detailed GDP result and districts information are in Appendix 1). In Figure 2b, the distribution of GDP in Uganda is heavily skewed. Only nine out of 116 districts have GDP per capita values above the national average. This equates to roughly 84% (or about 33 million) of the population is living in districts with GDP per capita estimates below the national average. Kampala has the largest GDP per capita ($3,860), followed by Wakiso ($2,671) and Mpigi ($2,543). Central (the central region dos not include Kampala) and Western Uganda tend to have larger per capita GDP estimates than Western and Northern Uganda.
Figure 2. Uganda’s district level GDP (a) and GDP per capita (b).
Figure 3. Uganda 116 Districts’ GDP and Population (a) and Uganda regional GDP and Population (b).
4.2. Data Comparisons
Figure 4. Comparisons of (a) G-Econ data from [31], (b) Gridded Global GDP (PPP) data from [30], and (c) the difference between the ELIM and Gridded global GDP data.
Figure 5. Comparison between the ELIM and Gridded Global GDP data.
The NTL imagery can record the dynamics of human activities by monitoring the artificial light on the Earth’s surface. Therefore, we support the idea that in migrating from DMSP-OLS to NPP-VIIRS data sources, the NTL imagery is an improved and more accurate source for estimating GDP. Nevertheless, the traditional DMSP-OLS imagery has a coarse spatial resolution and this may limit its applications for estimating human activities at sub-national levels [32]. In addition, Bundervoet et al. [28] found that the correlation between lights and economic activity is stronger in places where agriculture is a less significant component of the national GDP. Therefore, many traditional methods for estimating GDP with NTL may not be suitable for countries dependent on agriculture like Uganda. Following this rationale, in this study, instead of using population data only for estimating agricultural GDP, we proposed a simple process for estimating the rural GDP values by combining the population and agricultural value ratios within the districts of Uganda.
There are still limitations for this method. First, due to the resolution restriction of NPP-VIIRS NTL, the NTL imagery is not likely to accurately demonstrate the dynamics of economic activities at a finer spatial resolution. Second, since the NPP-VIIRS was only launched in 2012, there is a limited amount of time series data available. NPP-VIIRS may be combined with DMSP-OLS to cover a longer period of time to demonstrate the dynamics of economic activities in Africa. Thirdly, due to the relatively coarse resolution of NPP-VIIRS imagery, it may not be able to accurately define the urban regions and separate some agricultural activities from other secondary and tertiary sectors of the economy.
6. Conclusion
Africa is experiencing rapid urbanization due to fast population growth. It is estimated by the United Nations that more than 50% of global population growth between now and 2050 will occur in Africa [33]. This rapid population growth is causing fast expansion of megacities, small cities, and towns; and, putting great pressure on Africa’s sustainable development objectives by causing the loss of biodiversity, environmental degradation, and natural resource depletion. It is important to obtain timely and accurate information to evaluate the impacts of urbanization and promote sustainable development in countries like Uganda. Nighttime stable light data from the DMSP-OLS and the NPP-VIIRS can be used to reveal the dynamics of urban expansion in Africa. In this study, we have developed a new method for extracting the dynamics of sub-national-level economic activities based on nighttime stable light data using a combination of population data from GHSL and agricultural value ratios. In this study, a sequence of preprocessing procedures is implemented to estimate economics activities from different industries in urban and rural regions.
in the future to further compare and improve the model performance. Moreover, obtaining accurate and relevant ground truth data is important for validation to produce better-quality results.
Author Contributions: Conceptualization, All Authors; methodology, All Authors; validation, X.W. and M.R.; formal analysis, X.W. and M.R.; investigation, X.W. and M.R.; data curation, X.W., M.R, and P.S.; writing—original draft preparation, X.W. and M.R.; writing—review and editing, All Authors.; visualization, X.W. and M.R.; funding acquisition, M.R. and J.M.
Funding: This research was completed with the support from U.S. Agency for International Development and Frederick S. Pardee Center for International Futures at the Josef Korbel School of International Studies at the University of Denver.
Acknowledgments: The authors would like to thank the staff and scientists at NOAA for providing VIIRS-NPP data. The authors would also like to thank the staff at the USAID-Uganda country office and Frederick S. Pardee Center for International Futures for providing support.
Conflicts of Interest: The authors declare no conflict of interest. Appendix A
Table A1. GDP and GDP per capita Results
DNAME Region GDP (million US$)
GDP per capita (US $)
Abim Karamoja 5.89 100
Adjumani West Nile 62.08 136
Agago Northern 26.10 73
Alebtong Northern 15.47 60
Amolatar Northern 19.06 133
Amudat Karamoja 14.65 106
Amuria Eastern 27.95 53
Amuru Northern 80.25 394
Apac Northern 93.14 234
Arua West Nile 154.09 177
Budaka Eastern 12.12 61
Bududa Eastern 41.24 202
Bugiri Eastern 41.86 83
Buhweju South West 26.09 227
Buikwe Central 311.52 659
Bukedea Eastern 30.97 144
Bukomansimbi Central 36.71 224
Bukwo Eastern 36.96 458
Bulambuli Eastern 20.04 130
Buliisa Western 13.41 150
Bundibugyo Western 26.11 85
Busia Eastern 68.43 207
Butaleja Eastern 31.41 125
Butambala Central 16.28 126
Buvuma Central 3.96 63
Buyende Eastern 43.94 146
Dokolo Northern 29.92 143
Gomba Central 25.70 156
Gulu Northern 108.59 362
Hoima Western 100.76 155
Ibanda South West 87.30 315
Iganga Eastern 220.13 384
Isingiro South West 252.22 519
Jinja Eastern 777.38 1,376
Kaabong Karamoja 32.97 66
Kabale South West 77.37 238
Kabarole Western 186.91 414
Kaberamaido Eastern 21.98 95
Kagadi Western 19.38 43
Kakumiro Western 20.69 95
Kalangala Central 3.76 46
Kaliro Eastern 63.12 255
Kalungu Central 43.92 234
Kampala Kampala 7518.99 3,860
Kamuli Eastern 76.53 136
Kamwenge Western 74.15 199
Kanungu South West 63.95 233
Kapchorwa Eastern 21.53 162
Kasese Western 177.87 211
Katakwi Eastern 18.77 93
Kayunga Central 44.59 114
Kibaale Western 62.99 451
Kiboga Central 49.91 230
Kibuku Eastern 22.93 111
Kiruhura South West 100.80 294
Kiryandongo Western 39.52 117
Kisoro South West 38.64 145
Kitgum Northern 18.46 67
Kole Northern 61.03 232
Kotido Karamoja 51.91 180
Kumi Eastern 25.20 84
Kween Eastern 15.68 120
Kyankwanzi Central 38.45 199
Kyegegwa Western 38.10 208
Kyenjojo Western 59.01 135
Lamwo Northern 12.28 62
Lira Northern 127.40 277
Luuka Eastern 77.48 262
Luwero Central 92.09 190
Lwengo Central 77.53 278
Lyantonde Central 30.22 281
Manafwa Eastern 46.56 106
Maracha West Nile 49.62 222
Masaka Central 197.81 698
Masindi Western 77.17 176
Mayuge Central 105.57 204
Mbale Eastern 253.21 540
Mbarara South West 625.36 1,272
Mitooma South West 40.19 193
Mityana Central 70.29 213
Moroto Karamoja 9.43 57
Moyo West Nile 17.09 31
Mpigi Central 524.23 2,543
Mubende Central 356.64 510
Mukono Central 1040.68 1,689
Nakapiripirit Karamoja 22.17 112
Nakaseke Central 27.39 124
Nakasongola Central 70.39 403
Namayingo Eastern 19.61 71
Namutumba Eastern 48.83 201
Napak Karamoja 13.06 54
Nebbi West Nile 48.29 125
Ngora Eastern 14.05 78
Ntoroko Western 7.39 70
Ntungamo South West 240.08 452
Omoro Northern 35.79 252
Otuke Northern 7.15 73
Oyam Northern 137.45 301
Pader Northern 20.82 73
Pallisa Eastern 42.75 103
Rakai Central 119.13 233
Rubanda South West 15.58 76
Rubirizi South West 27.64 203
Rukungiri South West 78.85 225
Serere Eastern 102.67 292
Sheema South West 50.15 207
Sironko Eastern 27.20 104
Soroti Eastern 135.27 348
Ssembabule Central 70.38 294
Tororo Eastern 203.84 371
Wakiso Central 4314.70 2,671
Yumbe West Nile 69.28 98
Zombo West Nile 38.11 155
References
1. Deb, S. Gap between GDP and HDI: Are the Rich Country Experiences Different from the Poor? In IARIW-OECD Special Conference, Paris; 2015.
2. Clarke, J.I.; Rhind, D.W.; Becket, C.; Wilkes, A.; Sadler, G.; Short, J. Population data and global environmental change. 1992.
3. Rose, A.N.; Bright, E.A. The LandScan Global Population Distribution Project: Current State of the Art and Prospective Innovation; Oak Ridge National Lab. (ORNL), Oak Ridge, TN (United States), 2014; 4. Henderson, J.V.; Storeygard, A.; Weil, D.N. Measuring Economic Growth from Outer Space. The
American Economic Review; Nashville 2012, 102, 994–1028, doi:http://dx.doi.org/10.1257/aer.102.2.994. 5. Welch, R. Monitoring urban population and energy utilization patterns from satellite Data. Remote
Sensing of Environment 1980, 9, 1–9, doi:10.1016/0034-4257(80)90043-7.
6. Welch, R.; Zupko, S. Urbanized area energy-utilization patterns from Dmsp data. Photogrammetric Engineering and Remote Sensing 1980, 46, 201–207.
7. Baugh, K.; Elvidge, C.D.; Ghosh, T.; Ziskin, D. Development of a 2009 stable lights product using DMSP-OLS data. Proceedings of the Asia-Pacific Advanced Network 2010, 30, 114–130.
8. Hillger, D.; Kopp, T.; Lee, T.; Lindsey, D.; Seaman, C.; Miller, S.; Solbrig, J.; Kidder, S.; Bachmeier, S.; Jasmin, T. First-light imagery from Suomi NPP VIIRS. Bulletin of the American Meteorological Society 2013, 94, 1019–1029.
9. Uganda Bureau of Statistics. Uganda Census of Agriculture 2008/2009, Volume IV: Crop Area and Production Report. Uganda Bureau of Statistics. 2010.; Kampala, Uganda, 2010;
11. Elvidge, C.D.; Baugh, K.E.; Zhizhin, M.; Hsu, F.-C. Why VIIRS data are superior to DMSP for mapping nighttime lights. Proceedings of the Asia-Pacific Advanced Network 2013, 35, 62–69, doi:10.7125/APAN.35.7.
12. Shi, K.; Yu, B.; Huang, Y.; Hu, Y.; Yin, B.; Chen, Z.; Chen, L.; Wu, J. Evaluating the Ability of NPP-VIIRS Nighttime Light Data to Estimate the Gross Domestic Product and the Electric Power Consumption of China at Multiple Scales: A Comparison with DMSP-OLS Data. Remote Sensing 2014, 6, 1705–1724, doi:10.3390/rs6021705.
13. Pesaresi, M.; Syrris, V.; Julea, A. A new method for earth observation data analytics based on symbolic machine learning. Remote Sensing 2016, 8, 399.
14. Uganda Bureau of Statistics. A Summary Report of the National Livestock Census, 2008; Kampala, Uganda, 2009;
15. Food and Agriculture Organization Statistical databases. Food and Agriculture Organization of the United Nations 2012.
16. Cotton Development Organization. Cotton Development Organisation Annual Report 2009-2010; 2010; 17. Uganda Bureau of Statistics. National Population and Housing Census 2014, Subcounty Report –
Northern Region; Kampala, Uganda, 2014;
18. Uganda Bureau of Statistics. National Population and Housing Census 2014, Main Report; Kampala, Uganda, 2014;
19. Coffee Producing Areas of Uganda. Geo Gecko 2014.
20. FIT Insights Group Limited. Available online: https://fitinsightsgroup.com/uganda-2/ (accessed on August 27, 2018).
21. Uganda Coffee Development Authority. Coffee Price Trend 1992-2015; 2015;
22. Ghosh, T.; L. Powell, R.; D. Elvidge, C.; E. Baugh, K.; C. Sutton, P.; Anderson, S. Shedding Light on the Global Distribution of Economic Activity. The Open Geography Journal 2010, 3.
23. Letu, H.; Hara, M.; Yagi, H.; Naoki, K.; Tana, G.; Nishio, F.; Shuhei, O. Estimating energy consumption from night-time DMPS/OLS imagery after correcting for saturation effects. International Journal of Remote Sensing 2010, 31, 4443–4458, doi:10.1080/01431160903277464. 24. Aldhous, P. Energy: China’s burning ambition Available online:
https://www.nature.com/articles/4351152a (accessed on Sep 27, 2018).
25. Zhang, Q.; Seto, K.C. Mapping urbanization dynamics at regional and global scales using multi-temporal DMSP/OLS nighttime light data. Remote Sensing of Environment 2011, 115, 2320–2329, doi:10.1016/j.rse.2011.04.032.
26. Lo, C.P. Modeling the Population of China Using DMSP Operational Linescan System Nighttime Data. Photogrammetric Engineering and Remote Sensing 2001, 67, 1037–1047.
27. Townsend, A.; Bruce, D. The Use of Night-time Lights Satellite Imagery As a Measure of Australia’s Regional Electricity Consumption and Population Distribution. International Journal of Remote Sensing 2010, 31, 4459–4480, doi:10.1080/01431160903261005.
28. Bundervoet, T.; Maiyo, L.; Sanghi, A. Bright lights, big cities: measuring national and subnational economic growth in Africa from outer space, with an application to Kenya and Rwanda; The World Bank, 2015;
29. Nordhaus, W.D. Geography and macroeconomics: New data and new findings. Proceedings of the National Academy of Sciences 2006, 103, 3510–3517.
30. Kummu, M.; Taka, M.; Guillaume, J.H. Gridded global datasets for gross domestic product and Human Development Index over 1990–2015. Scientific Data 2018, 5, 180004.
32. Sutton, P.C.; Elvidge, C.D.; Ghosh, T. Estimation of gross domestic product at sub-national scales using nighttime satellite imagery. International Journal of Ecological Economics & Statistics 2007, 8, 5– 21.

![Figure 4. Comparisons of (a) G-Econ data from [31], (b) Gridded Global GDP (PPP) data from [30], and (c) the difference between the ELIM and Gridded global GDP data](https://thumb-us.123doks.com/thumbv2/123dok_us/7881754.1307681/8.595.77.523.398.652/figure-comparisons-econ-gridded-global-difference-gridded-global.webp)

