Recent results from INDRA
J. D. Frankland1, E. Bonnet1, B. Borderie2, R. Bougault3,
A. Chbihi1 and G. Lehaut3 (INDRA Collaboration)
1 GANIL (DSM-CEA/CNRS/IN2P3), F-14076 Caen cedex, France 2 Institut de Physique Nucl´eaire, CNRS/IN2P3, Universit´e Paris-Sud 11,
F-91406 Orsay cedex, France
3 LPC, CNRS/IN2P3, ENSICAEN, Universit´e de Caen, F-14050 Caen
cedex, France
Abstract
We present an overview of recent results & advances within the INDRA collaboration.
1
Introduction
After 10 years of the International Workshop on Multifragmentation and Related Topics, it is a pleasure to see that both the CHIMERA and INDRA collaborations continue to produce high-quality results at the cutting edge of their domain. In this traditional invited talk we will present a few recent works by the INDRA collaboration, none of which have yet been published elsewhere. Other examples not mentioned here can be found throughout these proceedings.
2
Phase transitions
2.1 Constrained caloric curves
The so-called “caloric curve” for hot nuclei has been a subject of intense debate since the publication of correlated temperatures and excitation en-ergies for gold spectator nuclei by the Aladin collaboration [1]. Their data EPJ Web of Conferences
DOI: 10.1051/
, epjconf 2012/
00002 (2012)
31
3100002 00002
C
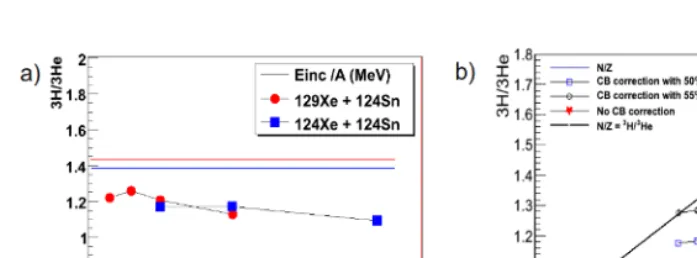
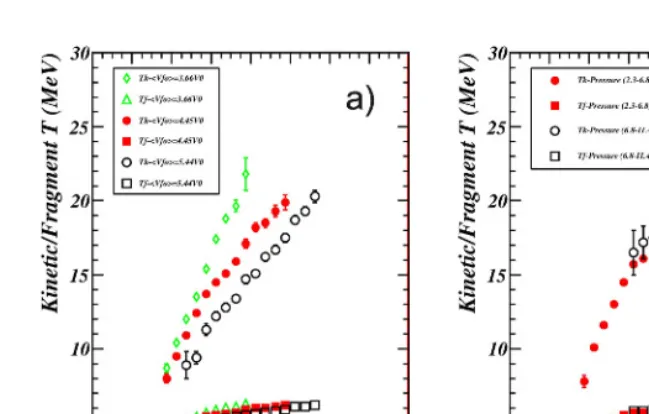
Figure 1: (Colour online) Constrained caloric curves for multifragmenting sources formed in central129Xe+natSn collisions: a) at fixed (mean) freeze-out volume; b) at constant pressure. Square/triangular symbols: fragment temperatures, round symbols: kinetic temperatures.
showed a near-constant temperature value of around 5 MeV for excitation energies between 3 and 10 MeV per nucleon; at higher energies the tempera-ture increased linearly with excitation energy like a classical ideal gas. This was taken as strong evidence that multifragmentation is a manifestation of a first-order phase transition, the temperature plateau being “reminiscent of the paradigm of a phase transition, the first-order phase transition of bulk (and also finite) H2O systems.”
However, as was soon pointed out by Moretto et al. [2], the paradigm in question referred to the very specific case of a phase transition at con-stant pressure, whereas e.g. at constant volume the transition would be characterised by a monotonic rise in temperature. This question of the in-fluence of external constraints on caloric curves was later studied in detail by Chomazet al. [3]. They showed that, although the caloric curve associated to a phase transition depends on the path followed in the thermodynamical variable space, partial energy fluctuations, at least for finite systems such as nuclei, become anomalously large (larger than the canonical expectation) whatever this path. As a result, the study of caloric curves as a signal of a first-order phase transition became somewhat neglected.
the freeze-out properties of multifragmentation events in central collisions of 129Xe+natSn measured with INDRA, by comparison to simulations of the secondary decay and Coulomb propagation of the fragments from the moment of freeze-out up to the detectors [4,5]. Knowing, event-by-event, the configuration of the system at freeze-out it is possible to calculate, within a microcanonical framework, the corresponding caloric curves under different constraints, thus satisfying the conditions imposed by Moretto et al. in 1996: “... an additional relationship between the three variables P, T, V (such asP =const,V =const, etc.) is needed to interpret aT−E diagram unequivocally”.
In addition, the introduction of a limiting temperature for nuclear frag-ments in the simulations [6] means that for each constraint, two different caloric curves are obtained: one for the intrinsic temperature of fragments, and one for the kinetic temperature associated to their thermal motion. As shown in fig.1, the internal fragment temperature increases only slightly over the explored excitation energy range, from ∼ 4 to ∼ 6 MeV. Kinetic temperatures, on the other hand, increase from ∼8 to∼22 MeV over the same range. As expected for a first-order phase transition in a finite sys-tem, the constant volume kinetic caloric curve (fig.1a) is monotonic, whereas the constant pressure curve (fig.1b) shows a back-bending in the region of excitation energies between∼7 and ∼9 MeV/nucleon.
2.2 Evolution of order parameter distributions with energy
A few years ago we established a systematic for the scaling properties of fluctuations of the largest-Z fragment produced in central collisions of sym-metric systems [7], in the universal fluctuations framework [8]. One of the most striking results of this work was the observation for the first time that the distribution which best describes P(Zmax) has two asymptotic forms:
one symmetric, at low bombarding energies, and the other asymmetric at the highest energies, with an exponential tail for the largest Zmax. In the
latter case, P(Zmax) is well described by a Gumbel distribution of the first
kind [9]. These asymptotic forms were not predicted by theory, and the only plausible explanation for the evolution from one to the other form seemed to be a change in the reaction mechanism [7].
A wide class of models of clusterisation phenomena give a Gumbellian Smax distribution for the size of the largest cluster, from percolation [8] to
equiprobable partitioning of a nucleus [10, 11]. On the other hand, it has been, up to now, rather more difficult to obtain symmetric Smax
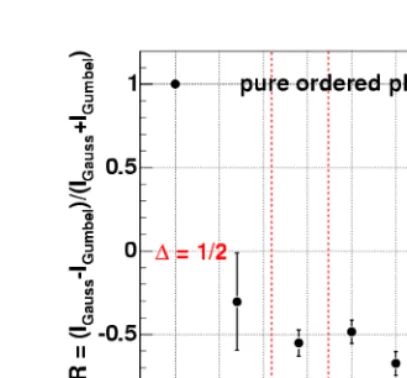
Figure 2: (Colour online) Ratio between the weights of the Gaussian and Gumbel-lian components of a two-component fit to experimentalZmax distributions from central collisions of129Xe+natSnmeasured with INDRA at 25, 32, 39, 45, 50, and 65 MeV/nucleon.
evolution between the two asymptotic forms, which we showed a few years ago to occur quite rapidly with increasing bombarding energy [12], as shown in fig. 2. In this figure can be seen the results of a two-component fit to experimental Zmax distributions using a weighted sum of Gumbellian and
Gaussian distributions. The quantity R which is plotted as a function of bombarding energy is the ratio between the total areas of each component,
R= IGa−IGu IGa+IGu
(1)
whereIX =WX
fXdZmax is the total integrated contribution of
distribu-tionX including the fitted weight parameterWX.
The Smoluchowski aggregation model [13] is a critical dynamical model describing the coalescence of droplets. Its equations can be written as
dck
dt = 1 2
i+j=k
Kijcicj− N
i=1
Kikcick (2)
whereck is the concentration ofk-size droplets and Kij is an expression of
Figure 3: (Colour online) Isospin imbalance ratio ˜R(eq. 3) for central collisions of differentXe+Snsystems at 32 MeV/nucleon, as a function of longitudinal velocity,
v (from [16]).
phase appears. The reduced largest droplet size, smax/N, is the order
pa-rameter of this model. Although the probability distribution function for the order parameter is not known, recent numerical simulations [14] have shown that for finite systems in the pseudo-critical region (i.e. times in the vicinity oftC) it is very well described by a weighted sum of Gaussian and
Gumbellian distributions. For t < tC it is the Gumbel distribution which
dominates, while at large times the macroscopic phase is represented by the Gaussian order parameter distribution. Remarkably, for times which are very close to tC, the two distributions have equal weights, and the order
parameter distribution isbimodal.
3
Isospin & symmetry energy
3.1 Isospin equilibration
The degree of equilibration in central collisions has been studied recently by the INDRA collaboration in terms of nuclear stopping power [15]. One can also use the isospin degree of freedom in order to study the degree of mixing between nucleons from the two partners of the reaction, as in [17].
Figure 4: (Colour online) (top) Transverse energy spectra for3Heand 3H nuclei
produced in central collisions at 100 MeV/nucleon bombarding energy for different
Xe+Snisotopic combinations. (bottom) Yield ratios as a function of transverse energy constructed from the spectra presented above.
The isospin imbalance ratio
˜
Rp/t = 2Rp/t−R
N N
p/t −RP Pp/t
RN N
p/t −RP Pp/t
(3)
was constructed from normalised3H/1Hyield ratios measured with INDRA for central collisions of 124,136Xe+112,124Sn at bombarding energies of 32 and 45 MeV/nucleon [16]. The resulting linear dependence of this ratio on longitudinal velocity for the mixed systems ’PN’ and ’NP’ (corresponding to neutron-poor on neutron-rich, and neutron-rich on neutron-poor, respec-tively), as shown infig. 3, confirms the results of the earlier analysis. Even in the most central collisions around the Fermi energy, full mixing between projectile and target is not achieved for the majority of events.
3.2 Density dependence of nuclear symmetry energy
Figure 5: (Colour online) a) Excitation function for 3H/3He yield ratio derived from transverse-energy selected yields, as shown in fig. 4. The horizontal lines indicate the N/Z ratio of the total system in each case. b) 3H/3He yield ratio as a function of systemN/Z without (stars) or with (open symbols) correction for differential Coulomb repulsion with different hypotheses on the size (charge) of the emitting source.
(and density) regime. Several such probes have been proposed based on the results of transport model calculations, for example the3H/3Heyield ratio studied in [18]. The predicted excitation function shows a yield ratio which decreases with increasing energy, and has a large sensitivity to the stiffness of the symmetry potential.
Recently in the INDRA collaboration a study has been made of the sen-sitivity of this probe to the effects of nuclear symmetry energy on heavy ion dynamics, using data obtained with INDRA at GSI on collisions of 129,124Xe+112,124Sn at bombarding energies of 65-250 MeV/nucleon. The
transverse energy spectra of 3He and 3H nuclei are presented in the up-per part of fig. 4, for central collisions at 100 MeV/nucleon. It should be noted that spectra for3H isotopes have been corrected for particles punch-ing through the CsI detectors of INDRA at this energy. Large differences between the species are visible at low energy, but, as shown in the lower part of fig. 4, above 30 MeV/nucleon the differences are much smaller and the yield ratios are constant over a large range of transverse energies.
Fig. 5a) presents the excitation function obtained from these data for the 3H/3He yield ratio. Two surprising results appear in this figure: the first is the low value of all ratios, while the second is the near-constancy of this ratio over the bombarding energy range. In the same range, the predicted yield ratios of [18] decrease by 10-15%, and are in all cases higher than 1.6.
Figure 6: (Colour online) Simulated set-up of FAZIA demonstrator coupled with INDRA in the INDRA reaction chamber at GANIL.
Of course it should not be forgotten that, even after careful selection of the species used to construct the yield ratios, some artificial effects may yet remain, due to the different strengths of Coulomb repulsion between the fireball and Z = 1 or Z = 2 particles. In fig. 5b) an attempt has been made to correct for this effect on particle transverse energy by estimating the size of the participant on purely geometrical grounds (for an estimated upper impact parameter b < 0.1bmax). The effect of the correction is to
4
Conclusions and outlook
As this is a review talk presenting some highlights of the most recent work undertaken in the INDRA collaboration, all of it for the moment unpub-lished, this is not the place to present any grand conclusions, but rather to open some perspectives for the future.
A new experiment was performed using the full INDRA array at GANIL in October 2011. The aim of E613, which measured181T a+66Zncollisions at 19, 32, and 39 MeV/nucleon, is to extend the study of the link between collective expansion and fragment partitions begun in [19,20] to asymmetric colliding systems, using inverse kinematics in order to maintain the high-est possible efficiency of the detector for fragment identification with low thresholds.
The next step for INDRA (and also for the physicists who work with it) will be its coupling with the FAZIA demonstrator (∼200 telescopes) in order to perform exclusive measurements with full mass and charge identification for all quasi-projectile decay products. A typical set-up is shown infig. 6. It will be used with the Fermi energy beams supplied by GANIL, but could also be used with the low-energy exotic beams promised by SPIRAL2.
References
[1] Pochodzalla J. et al.,Physical Review Letters,75(1995) 1040.
[2] Moretto L. G. et al.,Physical Review Letters,76(1996) 2822.
[3] Chomaz P. et al.,Physical Review Letters,85(2000) 3587.
[4] Piantelli S. et al.,Physics Letters B,627 (2005) 18.
[5] Piantelli S. et al.,Nuclear Physics A,809(2008) 111.
[6] Koonin S. E. et al., Nuclear Physics A,474 (1987) 173.
[7] Frankland J. D. et al., Physical Review C,71(2005) 034607+.
[8] Botet R. et al.,Physical Review E,62(2000) 1825.
[9] Gumbel E. J.,Statistics of Extremes (Columbia University Press, New York), 1958.
[11] Sneppen K., Nuclear Physics A,470 (1987) 213.
[12] Frankland J. D. et al.,Colloque GANIL(Giens, France), 2004.
[13] Smoluchowski M. V.,Physik. Z.,17(1916) 557.
[14] Botet R., The Seventh Workshop on Particle Correlations and Fem-toscopy (University of Tokyo, Japan), 2011.
[15] Lehaut G. et al.,Physical Review Letters,104(2010) 232701+.
[16] Lehaut G., Ph.D Thesis (Universit´e de Caen, http://tel.archives-ouvertes.fr/tel-00426878), 2009.
[17] Rami F. et al.,Physical Review Letters,84(2000) 1120.
[18] Chen L. W. et al.,Nuclear Physics A,729 (2003) 809.
[19] Bonnet E. et al.,Nuclear Physics A,816(2009) 1.
![Figure 3: (Colour online) Isospin imbalance ratio R˜ (eq. 3) for central collisions ofdifferent Xe+Sn systems at 32 MeV/nucleon, as a function of longitudinal velocity,v∥ (from [16]).](https://thumb-us.123doks.com/thumbv2/123dok_us/8076444.1347412/5.595.112.370.67.279/isospin-imbalance-collisions-ofdierent-nucleon-function-longitudinal-velocity.webp)