1
Identifying automatic vehicle location (AVL) data completeness issues in a rural
transit authority system
Roger A. Solanoa*, Matthew J. Harta and Dong P. Nguyena
aSlippery Rock University, Slippery Rock, PA 16057, USA * Corresponding author's email address: [email protected]
Corresponding author
ARTICLE HISTORY:
Received: 08-Feb-2017 Accepted: 08-Mar-2017 Online available: 21-Mar-2017
Keywords:
Automatic vehicle location, Public transit,
Buses, Data quality, Rural transit
ABSTRACT
We analyzed AVL stop level data from a rural transit system to identify data completeness and systematic data capture failures. Systematic data loss could compromise the validity of further analyses of the data, such as schedule adherence or run time performance. We audited the data to identify missing values and possible data recording errors. The frequency of missing values was analyzed as a function of trip start time, stop number, day of the week, and last reported seconds late. We also perform an outlier and extreme value analysis as a function of missing records per trip. We conclude that there are systematic data capture errors in the system that needs to be addressed before further studies, such as run time analysis can be performed. Given the widespread adoption of an AVL system by rural transit system, it is recommended that detail data completeness analysis becomes routine before using the data generated to perform other studies.
Contribution/ Originality
This is, to our knowledge, the first paper to review data from a rural transit system and offer relatively easy and straight forward tools for data completeness analysis. The methodology could be replicated by other transit systems with limited data analysis resources. This research would be of interest to Transit systems that uses AVL technology, particularly rural transit systems as well as AVL hardware and software providers.
DOI: 10.18488/journal.1007/2017.7.1/1007.1.1.9 ISSN (P): 2306-983X, ISSN (E): 2224-4425
Citation: Roger A. Solano, Matthew J. Hart and Dong P. Nguyen(2017). Identifying automatic vehicle location (AVL) data completeness issues in a rural transit authority system. Asian Journal of Empirical Research, 7(1), 1-9.
© 2017 Asian Economic and Social Society. All rights reserved
Asian Journal of Empirical Research
Volume 7, Issue 1(2017): 1-92
1. INTRODUCTION
In recent years, there has been an increasing adoption of automatic vehicle location (AVL) technology by transit agencies nationwide (El-Geneidy et al., 2011; Furth, 2006; Radin, 2005). This includes rural transit agencies that may lack the resources and tools required to analyze extremely large data sets created.
Current AVL systems match location data with route and schedule information in real time (Furth et al., 2003). However, when using AVL system, missing data is inevitable due to communications faults (Hounsell et al., 2012; McLeod, 2007). Possible sources of unreliability include satellite unavailability, Partial/total signal blocking, or other temporary failure (Moreira-Matias et al., 2015). A common problem is data capture at the beginning or end of the route when the bus is in terminal (Furth et al., 2004; Hammerle et al., 2005). Some transit providers such as King Country Metro report 80% of data recovery from AVL (Furth, 2006). When an entire bus fleet is equipped with AVL, data recovery rates are not of importance unless there is systematic data loss (Furth, 2006). Saavedra et al. (2011) propose an automatic data validation methodology for archived AVL data. They identify data as suspect when physical constraints are violated (negative travel time for example) or outliers that cannot be explained by the trip pattern.
In this paper, we analyze AVL captured data in a rural transit system to assess completeness and identify possible systematic data loss. Systematic data loss could compromise the validity of further analyses of the data, such as schedule adherence or run time performance. The first section of the paper describes the Data. The second section of the paper describes the data completeness analysis. The third section of the paper details the outliers analysis and their effect on data capture. Finally, the fourth section of the paper presents our conclusions and recommendations.
2. DATA
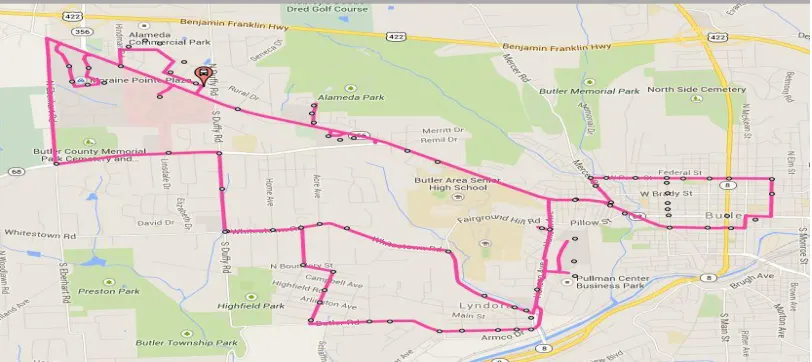
We analyzed data from a system that covers 25 square miles and a population of 31,084 in 2010. It serves 218,278 passengers annually, including 45,605 senior passengers. The system has 4 full-time employees and 6 part-time employees, a fleet of 6 busses, and installed an AVL solution in January of 2010. We focused our study in route one (Figure 1). The route has three different patterns during weekdays, that cover different number of stops: Weekday covering 23 stops to 9 trips, night covering 26 stops with 3 trips and night 2 covering 23 stops with one trip. We limit our analysis to weekdays, with patterns on weekdays and night for a total of 12 trips per day. The route is set as a loop, beginning and ending at the same stop.
3
The communication between the bus and the AVL system is done via cellular. The bus sends an AVL record every 90 seconds. It also sends a stop report including schedule adherence each time a trigger box is departed. A trigger box is a set of two latitude points and two longitude points that creates a box around a stop. Once the bus GPS enters and exits the box, the stop is triggered as being serviced. If the trigger box is not entered, the system will not generate a stop report.
We received from the transit authority AVL data for the year 2013. We were provided with a single table with 86,546 records. The datum covers all the trips made in the route during 2013. The fields in the data are described in Table 1.
Table 1: Fields in the data set
Field name Description
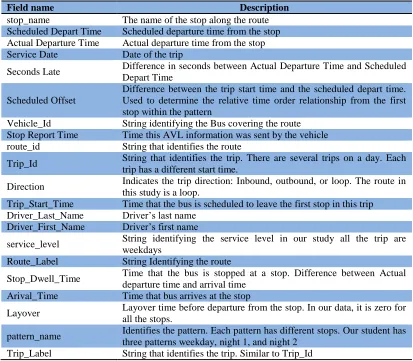
stop_name The name of the stop along the route Scheduled Depart Time Scheduled departure time from the stop Actual Departure Time Actual departure time from the stop Service Date Date of the trip
Seconds Late Difference in seconds between Actual Departure Time and Scheduled Depart Time
Scheduled Offset
Difference between the trip start time and the scheduled depart time. Used to determine the relative time order relationship from the first stop within the pattern
Vehicle_Id String identifying the Bus covering the route Stop Report Time Time this AVL information was sent by the vehicle route_id String that identifies the route
Trip_Id String that identifies the trip. There are several trips on a day. Each trip has a different start time.
Direction Indicates the trip direction: Inbound, outbound, or loop. The route in this study is a loop.
Trip_Start_Time Time that the bus is scheduled to leave the first stop in this trip Driver_Last_Name Driver’s last name
Driver_First_Name Driver’s first name
service_level String identifying the service level in our study all the trip are weekdays
Route_Label String Identifying the route
Stop_Dwell_Time Time that the bus is stopped at a stop. Difference between Actual departure time and arrival time
Arival_Time Time that bus arrives at the stop
Layover Layover time before departure from the stop. In our data, it is zero for all the stops.
pattern_name Identifies the pattern. Each pattern has different stops. Our student has three patterns weekday, night 1, and night 2
Trip_Label String that identifies the trip. Similar to Trip_Id
2.1. Data completeness
We audited the data to identify missing values and possible data recording errors. We identified 16,123 records where the AVL data ware missing (ActualDepartureTime, SecondsLate, Vehicle_Id, StopReportTime, Driver_Last_Name, Driver_First_Name, and Arival_Time recorded as NULL).
4
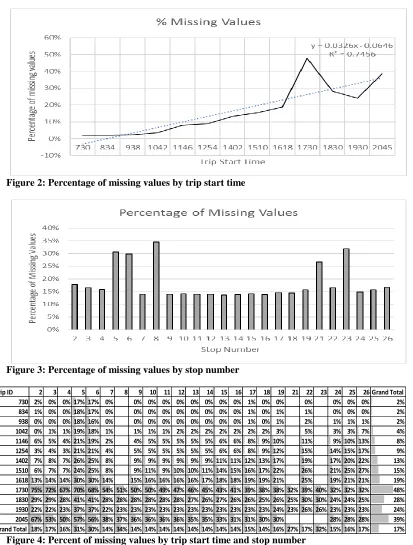
A graph of the percentage of missing values by trip start time (Figure 2) shows a strong correlation: as the departure time increases, the percent of missing values increases. A large number of missing values occur in the 5:30 PM trip. An analysis of missing values by stop number (Figure 3) indicates an increase in the number of missing values in stops 5, 6, 8, 21, and 23. Stops 8, 21, and 23 are serviced in trips that depart after 5:30 PM and have a larger percentage of missing values as showed in Figure 4.
Figure 2: Percentage of missing values by trip start time
Figure 3: Percentage of missing values by stop number
Figure 4: Percent of missing values by trip start time and stop number
5
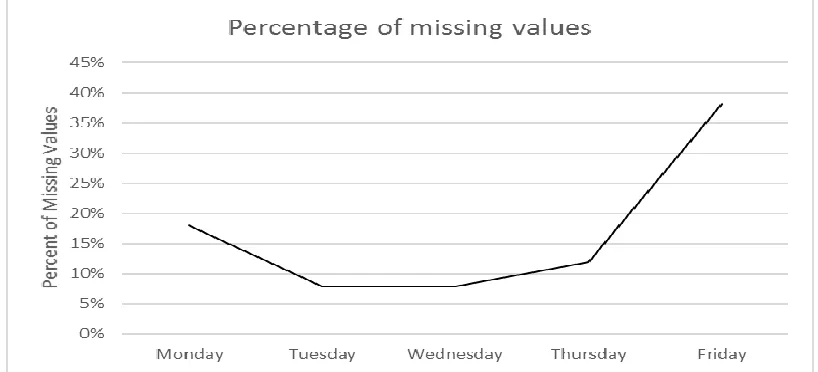
When analyzing the occurrence of missing values by day of the week, there is an increase in the number of Occurrences on Fridays followed by Mondays (Figure 5). By cross-tabulating by day of the week and stop number (Figure 6), and by day of the week and trip start time (Figure 7), we identify that data capture is completely unreliable on Fridays after 5:30 PM.
Figure 5: Percentage of missing values by day of the week
Figure 6: Percentage of missing values by day of the week and stop number
Figure 7: Percentage of missing values by day of the week and trip start time
To identify if there was a relationship between seconds late (deviation from scheduled departure time) and the occurrence of missing values, a variable was created to keep the last recorded seconds
Weekday 2 3 4 5 6 7 8 9 10 11 12 13 14 15 16 17 18 19 21 22 23 24 25 26 Grand Total Monday 19% 18% 18% 31% 31% 15% 41% 16% 16% 16% 16% 15% 15% 16% 14% 16% 14% 17% 26% 16% 30% 15% 16% 18% 18% Tuesday 14% 11% 9% 25% 23% 5% 8% 5% 5% 4% 4% 4% 4% 4% 4% 6% 5% 6% 4% 10% 15% 5% 6% 8% 8% Wednesday 10% 9% 8% 25% 23% 6% 12% 6% 6% 6% 6% 5% 5% 5% 5% 5% 5% 7% 3% 8% 6% 6% 6% 7% 8% Thursday 13% 12% 11% 26% 25% 10% 21% 10% 10% 10% 9% 9% 10% 10% 9% 9% 10% 10% 13% 13% 19% 10% 10% 11% 12% Friday 32% 33% 33% 45% 46% 33% 89% 34% 34% 34% 34% 35% 35% 36% 36% 36% 37% 38% 86% 37% 88% 38% 39% 39% 38% Grand Total 18% 17% 16% 31% 30% 14% 34% 14% 14% 14% 14% 14% 14% 14% 14% 15% 14% 16% 27% 17% 32% 15% 16% 17% 17%
Trip ID Monday Tuesday Wednesday Thursday Friday Grand Total
730 2% 4% 2% 2% 1% 2%
834 2% 3% 2% 2% 1% 2%
938 3% 2% 2% 2% 2% 2%
1042 4% 2% 4% 2% 6% 4%
1146 7% 5% 8% 6% 14% 8%
1254 10% 7% 6% 6% 15% 9%
1402 10% 10% 8% 13% 25% 13%
1510 15% 10% 10% 16% 26% 15%
1618 19% 15% 13% 18% 28% 19%
1730 62% 22% 22% 37% 94% 48%
1830 30% 5% 5% 12% 88% 28%
1930 17% 4% 2% 10% 86% 24%
2045 47% 15% 17% 27% 87% 39%
6
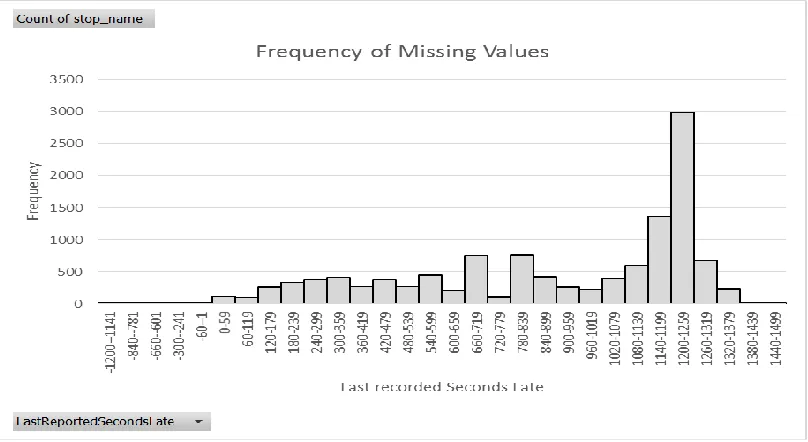
late before a missing value or a series of missing values occurred. We created a histogram of the frequency of missing values by last recorded seconds late (Figure 8) and observed an increase in the number of missing values when the buses were about 20 minutes late.
Figure 8: Histogram of missing values by last recorded seconds late
2.2. Outlier analysis
The variable of interest, seconds late, measures the deviations on departure time from the schedule. It shows large variation and a significant number of outliers and extreme values (Figure 9). We wanted to measure how incomplete data per trip affects the occurrence of extreme values. After eliminating records from the first and twentieth stop, we consider that a trip data capture is complete if it reports all the corresponding stop level records (varies per pattern: weekday 21 records, night 1, 24 records, night 2, 21 records). About 60% of the trips have no missing values (Table 2).
7 Table 2: Trips with no missing values
Pattern Total Trips with no missing values Percent
Route 1 Weekday 2277 1555 68%
Route 1 Night 1 759 334 44%
Route 1 Night 2 253 72 28%
Total trips 3289 1961 60%
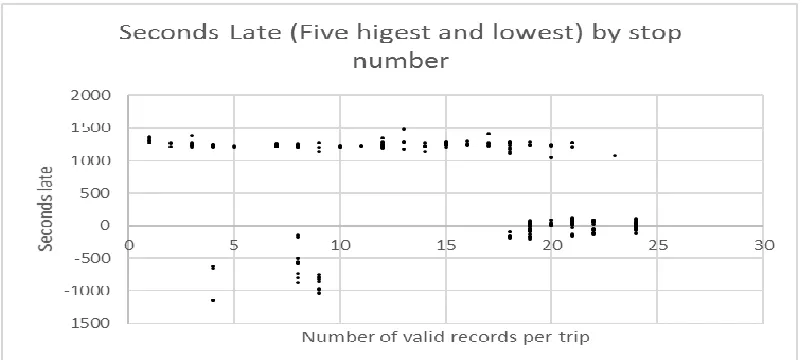
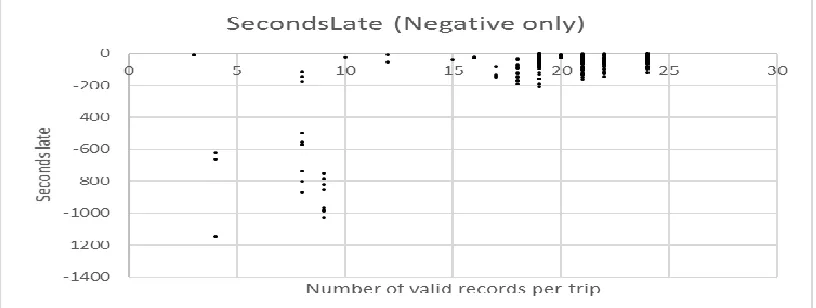
We selected the five highest and lowest values for SecondsLate for each Trip_Id and graphed them against number of valid records per trip (Figure 10). We then selected the five highest and lowest values for SecondsLate for each stop and graphed them against the number of valid records per trip (Figure 11). We identified that negative seconds late (lowest extreme values) happen when there are a high number of missing values per trip (ten or fewer records per trip). We then graphed all stop records with negative SecondsLate against the number of valid records per trip and we identified the same pattern, when there are ten or less valid records per trip the frequency and magnitude of negative SecondsLate increases (Figure 12). We recommend eliminating trips to ten or less valid stop level records (130 trips) from further analysis.
Figure 10: Seconds late outliers (Five highest and lowest by trip start time) by number of valid records per trip
8
Figure 12: Seconds late (all stop records with negative seconds late) by number of valid records per trip
3. CONCLUSIONS AND RECOMMENDATIONS
The objective of our research was to perform a data completeness analysis in preparation for further studies such as run time analysis. The concern is that errors in data capture or archiving could lead to wrong conclusions, particularly when systematic data capture errors are present. We conclude that Systematic data capture errors are present:
Data capture at the terminal (beginning and end) of the trip are unreliable. Stop number 20 is misconceived and not recording any values.
Stops number 5 and 6 has a high frequency of missing values.
There is a correlation between trip start time and the occurrence of missing values: at the start time increases, the occurrence of missing values increases.
Mondays and Fridays present a higher frequency of missing values particularly for the 5:30 PM trip where on Fridays, 94% of values are missing. Late Friday trips have the highest percentage of missing values: between 86% and 94%.
The system seems to malfunction when the busses are around 20 minutes late and does not seem to record values after 1500 seconds (25 minutes) late.
The occurrence of suspect outliers with negative seconds late increase when there are less than 10 valid stop level records per trip.
We recommend adjusting the configuration of stop 20, 5, and 6 so they record stop level data. We also recommend studying the data capture errors identified and reducing them before run time analyses are performed. Problems with data capture at the beginning and end of the trip are known problems with AVL Systems, particularly in routes configured as a loop. We recommend using the arrival at stop 2 and departure from stop 26 and proxies for the trip start and end.
After discussing our results with management and the AVL system contractor the following changes were introduced:
The trigger box for stoping 20 was relocated. It should start generating stop level reports. It was identified that the busses drove a different route than expected and were not covering
steps 5 and 6. A service change has been introduced and the stops should be serviced properly generating stop level records.
9
It was identified that with the software currently installed when the busses are late for a significant amount of the system malfunctions. The bus loses schedule adherence and fails to properly be assigned to the next trip. A firmware upgrade on the vehicle has been recommended to address the issue.
We recommend that a new data completeness analysis is performed to quantify the Effectiveness of the proposed changes.
Given the widespread adoption of AVL system by rural transit system, it is recommended that detail data Completeness analysis become routine before using the data generated to perform other studies, such as runtime analysis.
Funding: This study received no specific financial support.
Competing Interests: The authors declared that they have no conflict of interests.
Contributors/Acknowledgement: All authors participated equally in designing and estimation of current research.
Views and opinions expressed in this study are the views and opinions of the authors, Asian Journal of Empirical Research shall not be responsible or answerable for any loss, damage or liability etc. caused in relation to/arising out of the use of the content.
References
El-Geneidy, A. M., Horning, J., & Krizek, K. J. (2011). Analyzing transit service reliability using detailed data from automatic vehicular locator systems. Journal of Advanced Transportation, 45(1), 66–79. view at Google scholar / view at publisher
Furth, P. (2006). TCRP report 113: Using archived AVL-APC data to improve transit performance and management. (P. G. Furth, B. Hemily, T. H. J. Muller, J. G. Strathman, & T. R. Board, Eds.). Washington, DC: The National Academies Press. Retrieved from http://onlinepubs.trb.org/onlinepubs/tcrp/tcrp_rpt_113.pdf.
Furth, P. G., Hemily, B. J., Muller, T. H. J., & Strathman, J. G. (2003). Uses of archived AVL-APC data to improve transit performance and management: Review and potential. Transportation Research Board Washington, DC. view at Google scholar / view at publisher
Furth, P., Muller, T., Strathman, J., & Hemily, B. (2004). Designing automated vehicle location systems for archived data analysis. Transportation Research Record: Journal of the Transportation Research Board, 1887, 62–70. view at Google scholar / view at publisher
Hammerle, M., Haynes, M., & McNeil, S. (2005). Use of Automatic Vehicle Location and Passenger Count Data to Evaluate Bus Operations. Transportation Research Record: Journal of the Transportation Research Board, 1903(1), 27–34. view at Google scholar / view at publisher Hounsell, N. B., Shrestha, B. P., & Wong, A. (2012). Data management and applications in a world-leading bus fleet. Transportation Research Part C: Emerging Technologies, 22, 76–87. view at
Google scholar / view at publisher
McLeod, F. (2007). Estimating bus passenger waiting times from incomplete bus arrivals data.
Journal of the Operational Research Society, 58(11), 1518–1525. view at Google scholar / view at publisher
Moreira-Matias, L., Mendes-Moreira, J., de Sousa, J. F., & Gama, J. (2015). Improving mass transit operations by using AVL-Based systems: A Survey. IEEE Transactions on Intelligent Transportation Systems, 16(4), 1636–1653. view at Google scholar / view at publisher
Radin, S. (2005). Advanced public transportation systems deployment in the united states-year 2004 Update. view at Google scholar
Saavedra, M., Hellinga, B., & Casello, J. (2011). Automated quality assurance methodology for archived transit data from automatic vehicle location and passenger counting systems.