20th International Conference on Structural Mechanics in Reactor Technology (SMiRT 20) Espoo, Finland, August 9-14, 2009 SMiRT 20-Division III, Paper 1729
Calibration of Damage Parameters for Y5 and G91 Steels in Use of
Genetic Algorithm
Jae-Uk Jeong
a, Shin-Beom Choi
a, Yoon-Suk Chang
a,*, Jae-Boong Choi
a, Young-Jin Kim
a,
Min-Chul Kim
band Bong-Sang Lee
ba
School of Mechanical Engineering, Sungkyunkwan University, Suwon 440-746, Korea, [email protected]
b
Korea Atomic Energy Research Institute, Daejeon 305-600, Korea
Keywords: Ductile Fracture, Fracture Toughness, Genetic Algorithm, Local Approach, Small Punch Test
1
ABSTRACT
Determination of fracture toughness is prerequisite to perform elastic-plastic fracture mechanics assessment, for instance, leak-before-break analyses of nuclear piping systems and integrity evaluation of low upper-shelf reactor vessels. However, sometimes, there are lacks of fracture toughness data especially for old vintage nuclear power plants and it is not easy to prepare standard specimens from archival materials or installed components. In these cases, damage mechanics is applicable as one of alternative approaches because several efficient models have been suggested to simulate ductile fracture behaviour during the last couple of decades. In the present paper, a multi-island genetic algorithm is adopted into well-known Rousselier model to resolve complexity of previous calibration methods since reliability of damage parameters is significantly dependent on the calibration method - trial and error method, neural network method and so on combined with notched bar tests or small punch (SP) tests - and analyzer’s experiences. SP test data of typical nuclear materials such as a low alloy steel (Y5) and a high Cr steel (G91) are used to determine damage parameters and, then, resulting values are applied to predict fracture toughness of the material. Load-displacement curves and fracture resistance curves are compared with those obtained from experiments, which show effectiveness of the proposed method.
2
INTRODUCTION
3
DAMAGE MODEL AND GENETIC ALGORITHM
3.1 Brief review of Rousselier model
In order to describe ductile fracture behaviour based on the local approach, well-known Rousselier model was adopted. Rousselier model defines the yield surface as a function of hydrostatic stresses:
0
)
(
exp
1
1
""
!
=
#
$
%%
&
'
(
(
(
+
=
)
eqpm eq
R
f
D
*
+,
,
,
+
,
(1)
where, 1 and D are fitting constants, eq is the equivalent von Mises stress, h is the hydrostatic stress, is the material density, f is the void volume fraction and R( peq) represents the work-hardening law. In the above equation, 1, D and ff (void volume fraction at fracture) are selected as design variables for optimization of Rousselier model.
3.2 Multi-island genetic algorithm
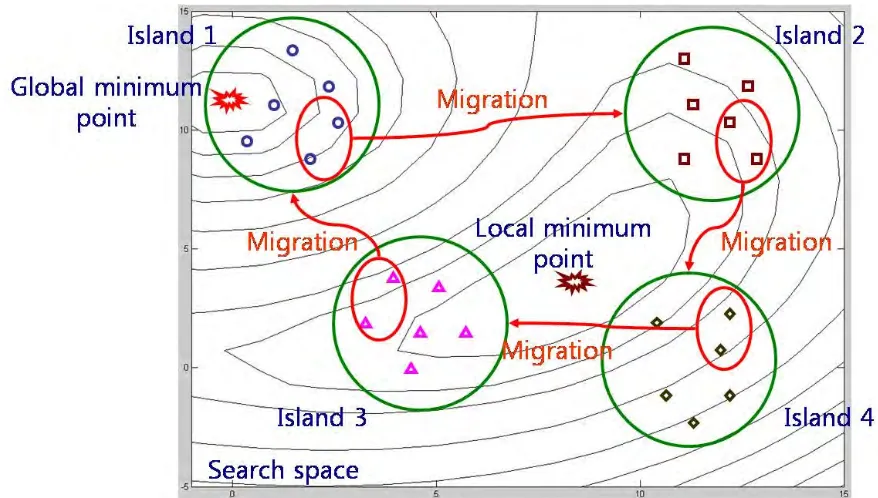
Aforementioned multi-island genetic algorithm (MIGA) is adopted for the present work among diverse of genetic algorithms. The remarkable characteristic of MIGA is that the population in one generation is divided into several sub-populations called as islands. To avoid converging partial optimized result, each sub-population maintains independency during the iteration. Before a new iteration, the exchange of individual information, called migration, is performed between sub-populations. Fig. 1 shows schematic illustration of MIGA.
Figure 1. Schematic illustration of multi-island genetic algorithm
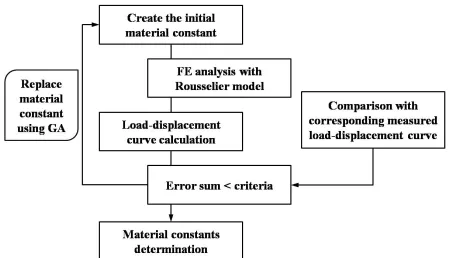
3.3 Optimized procedure for calibration of damage parameters
Figure 2. Calibration procedure using multi-island genetic algorithm
Table 1. Optimization parameters of multi-island genetic algorithm
Size of subpopulation 5 Rate of Crossover 1
No. of Island 5 Rate of Mutation 0.01
No. of Generations 10 Rate of Migration 0.5
Gene Size 32 Interval Migration 5
Table 2. Objective function and design variables
Objective Function Minimize !
= "#
$ %&
' (
n
i i
y D
f f f i f
1
2 ) 1 , , 0 ,
( )
Design Variables ff, f0, D, 1
Boundary Condition
f0=0.00007(Y5), 0.0003(G91)
0.01< ff <0.5
1.0< D<5.0
4
CALIBRATION OF DAMAGE PARAMETERS
4.1 Experimental raw data
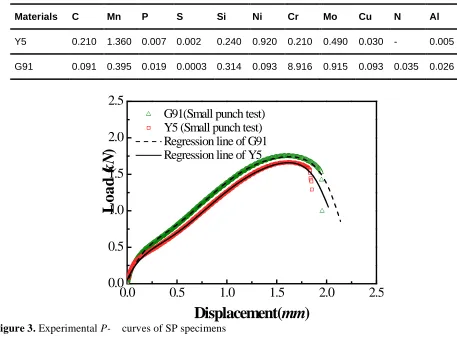
In the author’s previous works, small punch tests were performed to obtain load-displacement curves of the materials, Y5 and G91. Table 3 summarizes chemical compositions of Y5 and G91. Mechanical properties of the materials such as the values of yield strength ( YS) and ultimate tensile strength ( UTS) of Y5 are 400MPa and 596MPa, and the values of those of G91 are 480MPa and 687MPa, respectively. Fig. 3 depicts resulting experimental load-displacement curves. To calculate error sum between the SP test data and numerical data, polynomial equations of each material were developed as shown in Table 4.
Table 3. Chemical composition of Y5 and G91 (wt%)
Materials C Mn P S Si Ni Cr Mo Cu N Al
Y5 0.210 1.360 0.007 0.002 0.240 0.920 0.210 0.490 0.030 - 0.005
G91 0.091 0.395 0.019 0.0003 0.314 0.093 8.916 0.915 0.093 0.035 0.026
0.0
0.5
1.0
1.5
2.0
2.5
0.0
0.5
1.0
1.5
2.0
2.5
G91(Small punch test)
Y5 (Small punch test)
Regression line of G91
Regression line of Y5
Load
(k
N
)
Displacement(mm)
Figure 3. Experimental P- curves of SP specimens
Table 4. Polynomial equation of Y5 and G91 (P=C1 6
+ C2 5
+C3 4
+C4 3
+C5 2
+C6 +C7)
Materials C1 C2 C3 C4 C5 C6 C7
Y5 -0.950 5.684 -13.327 14.927 -7. 954 2.801 0.088
G91 -0.914 5.778 -14.247 16.792 -9.653 3.587 0.057
4.2 FEA results based on SP simulation
4.3 Calibration results
Franklin proposed a well-known formula to estimate the initial void volume fraction of particles (f0) based on manganese and sulphur contents like the followed equation.
!
"
#
$
%
&
'
=
=
.
%
001
.
0
%
054
.
0
0Mn
S
f
f
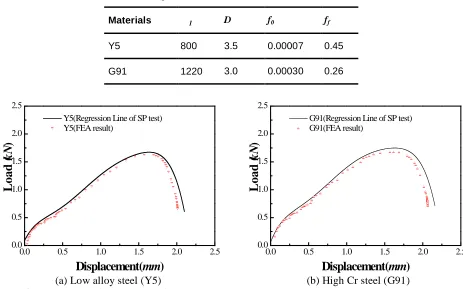
v (2)The f0 value of Y5 was calculated as 0.00007 from Eq. (2) and used for prediction of J-R curve in the later section. On the other hand, the f0 value of G91 calculated from the equation was too small. So, to simplify the complex calibration process, it was set to 0.0003 which was quoted from the author’s previous research. Table 5 summarizes resulting values of the calibrated parameters and Fig. 4 depicts the estimated load-displacement curves of the SP specimens comparing with the corresponding experimental ones.
Table 5. Calibrated micro-mechanical parameters
Materials 1 D f0 ff
Y5 800 3.5 0.00007 0.45
G91 1220 3.0 0.00030 0.26
0.0 0.5 1.0 1.5 2.0 2.5
0.0 0.5 1.0 1.5 2.0 2.5
Load
(k
N
)
Displacement(mm)
Y5(Regression Line of SP test) Y5(FEA result)0.0 0.5 1.0 1.5 2.0 2.5
0.0 0.5 1.0 1.5 2.0 2.5
Load
(k
N
)
Displacement(mm)
G91(Regression Line of SP test) G91(FEA result)(a) Low alloy steel (Y5) (b) High Cr steel (G91) Figure 4. Comparison of P- curves of SP specimens
5
VERIFICATION OF THE DAMAGE PARAMETERS
5.1 FE analyses of CT specimens
Figure 5. Two-dimensional FE model of CT specimen
5.2 FE analysis results
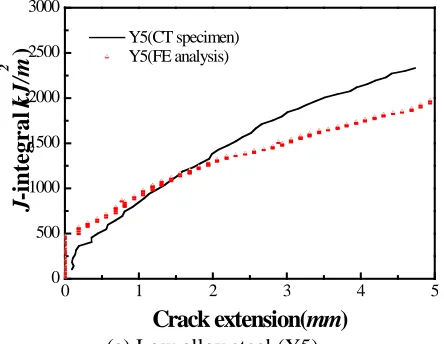
Fig. 6 shows J-R curves of CT specimens predicted by using Rousselier model compared with the corresponding experimental ones quoted from the author’s previous paper. In case of Y5 material, maximal difference between estimated J-integral and corresponding experimental one was 25% and mean difference was 15%, approximately. In case of G91 material, maximal difference was 33% and mean difference was 21%, approximately. The discrepancy which may be caused by anisotropic feature of test data and so forth is somewhat larger than expected one. However, if taking into account different features between SP and CT tests, the estimated J-R curves seems reasonably good.
0 1 2 3 4 5
0 500 1000 1500 2000 2500 3000
J
-integral (
k
J
/m
2
)
Crack extension(mm)
Y5(CT specimen)Y5(FE analysis)
0 1 2 3 4 5
0 500 1000 1500 2000 2500 3000
J
-integral (
k
J
/m
2
)
Crack extension(mm)
G91(CT specimen)G91(FE analysis)
(a) Low alloy steel (Y5) (b) High Cr steel (G91) Figure 6. Comparison of J-R curves of CT specimens
6
CONCLUSION
In the present paper, an optimized calibration procedure was introduced by employing multi-island genetic algorithm. The proposed method was applied to determine damage parameter of Rousselier model in use of small punch specimens for two types of typical nuclear materials – a low alloy steel and a high Cr steel. Then, FE analyses in conjunction with the damage model were carried out for standard CT specimens to demonstrate validity of the calibrated parameters and efficiency of the proposed method. Consequently, it was proven that the local approach by adopting the Rousselier model and MIGA algorithm is applicable to predict J-R curves when it is not easy to extract standard specimens from archival materials or installed components.
Acknowledgements. The authors are grateful for the support provided by a grant from Korea Atomic Energy
REFERENCES
Abendroth, M. and Kuna, M., 2006, Identification and validation of ductile damage parameters by the small punch test, Engineering fracture mechancis, Vol. 73, P. 710-725.
Chang, Y. S., Kim, J. M., Choi, J. B., Kim, Y. J., Kim, M. C., and Lee, B. S., 2008, Derivation of ductile fracture resistance by use of small punch specimens, Engineering fracture mechanics, Vol. 75, P. 3413-3427.
Chu, C. C. and Needleman, C. A., 1980, Void nucleation effects in biaxially stretched sheets, Journal of Engineering Material Technology, Vol. 102:3, P. 249-256.
Cho, T. M., Ju, B. H., Jung, D. H. And Lee, B. C., 2006, Reliability estimation using two–staged kringing metamodel and genetic algorithm, Transaction of the KSME (A), Vol. 30:9, P. 1116-1123.
Foulds, J. R. and Viswanathan, R., 1994, Small punch testing for determining the material toughness of low alloy steel components in service, Journal of Engineering Materials and Technology, Vol. 116, P. 457-464.
Franklin, A. G., 1969, Comparison between a quantitative microscope and chemical methods for assessment of non–metallic inclusions, Journal of Iron and Steel Institute, Vol. 207, P. 181-186.
Garrison, W. M. and Moody, N. R., 1987, Ductile fracture, Journal of the physics and chemistry of solids, Vol. 48:11, P. 1035-1074.
Goldberg, D. E., 1989, Genetic algorithm in search, operation and machine learning, Addison-wesley publishing company inc.
Gurson, A. L., 1977, Continuum theory of ductile rupture by void nucleation and growth: Part 1 - Yield criteria and flow rules for porous ductile media, Journal of engineering material and technology, Vol. 99, P. 2-15.
Ha, J. S. and Fleury, E., 1998, Small punch tests to estimation the mechanical properties of steels for steam power plant: II. Fracture toughness, International Journal of Pressure Vessels and Piping, Vol. 75, P. 707-713
Rousselier, G., 1987, Ductile fracture models and their potential in local approach of fracture, Nuclear engineering and design, Vol. 105:1, P. 97-111.