Doctor of Psychology (PsyD) Theses and Dissertations
1-1-2015
Consistency Among Visual Memory Measures
Jeffrey A. SchloemerGeorge Fox University, [email protected]
This research is a product of the Doctor of Psychology (PsyD) program at George Fox University.Find out moreabout the program.
This Dissertation is brought to you for free and open access by the Theses and Dissertations at Digital Commons @ George Fox University. It has been accepted for inclusion in Doctor of Psychology (PsyD) by an authorized administrator of Digital Commons @ George Fox University. For more information, please [email protected].
Recommended Citation
Consistency Among Visual Memory Measures
by
Jeffrey A. Schloemer
Presented to the Faculty of the
Graduate Department of Clinical Psychology
George Fox University
in partial fulfillment
of the requirements for the degree of
Doctor of Psychology
in Clinical Psychology
Newberg, Oregon
Abstract
Many instruments have been developed to assess human visual memory functioning, though
little research has been done to identify interrelationships among current visual memory
measures with each other. The present study explores concurrent validity of the following visual
memory tasks: Wechsler Memory Scale - IV (WMS-IV) Visual Reproductions I & II and
Designs I & II subtests, the Wide Range Assessment of Memory and Learning, Second edition
(WRAML2) Picture Memory and Design Memory subtests, the Brief Visuospatial Memory Test,
Revised (BVMT-R), and the Rey Complex Figure Test (RCFT). Two age groups (18-25 and
65-79) of healthy adults were used to approximate the polar ends of adulthood. Findings
demonstrated that the WRAML2 Picture Memory subtest stood apart from the others as a
distinctive measure, exhibiting weak correlations with visual memory measures as well as with
processing speed (WAIS-IV Coding) and verbal memory (WRAML2 Verbal Learning),
regardless of age group measured. In addition, the BVMT-R highlighted significant differences
between younger adult performance (compared to same-aged peers) and older adult performance
(compared to same-aged peers), suggesting it may be a tool that is more sensitive to decline than
other visual memory measures. Results suggest these two measures to be a prudent addition to
Acknowledgements
In a project such as a doctoral dissertation there are no pure solo efforts. Much of the
credit due for the assistance in the completion of this project is warranted to the many GFU
faculty, friends and family members who contributed timely encouragement, support, and a
steady reminder that we have only arrived where we are because of where we have been.
Namely, I would like to thank: Wayne Adams for his mentorship in rigorous research
design and for his demonstration of unparalleled commitment to integrity. Celeste Flachsbart and
Kathleen Gathercoal who contributed many hours of assisting me in the analyses for this project.
Working with each of you has continued to crystalize what it means to conduct research all the
way through the process to the final stages. My wife, Sheri Lynn, for her perpetual affection and
interminable words of affirmation to be only as I am and to bring forth the highest efforts I can
muster. My parents, Jewel and LeRoy Schloemer, thank you for your bottomless encouragement
to continue the work I started, for finding volunteers, and for investing so much curiosity into my
education. Maggie Freese, our accidental academic acquaintance has become an unexpected
blessing. Thank you for recruiting volunteers and for your tremendous interest in my success.
This was an immense relief and a great help in moving this project into a reality.
The George Fox University students, Friendsview Community and Newberg Methodist Church
for hosting such wonderful volunteers. And, finally. I thank the brave volunteers who contributed
their time and efforts into the success of this project as well as the contribution to research in the
field of visual memory.
Table of Contents
Abstract ... iii
Acknowledgements ... iv
List of Tables ... vii
List of Figures ... x
Chapter 1: Introduction ... 1
Utility of Visual Memory Measures ... 1
Evolution of Visual Memory Measures ... 3
Known inter-relationships between visual memory measures ... 7
Gaps In Known Relationships Among Common Visual Memory Measures ... 22
Rationale for the Present Research Project ... 24
Hypotheses for the present study ... 26
Chapter 2: Method ... 28
Participants ... 28
Materials ... 32
Design Memory and Picture Memory from the WRAML2...39
Designs and Visual Reproduction subtests from the WMS-IV ...41
Rey Complex Figure Test ...44
Brief Visuospartial Memory Test - Revised ...46
Coding subtest from the WAIS-IV ...47
Verbal Learning from the WRAML2 ...48
Chapter 3: Results ... 51
Chapter 4: Discussion ... 72
Conclusion/Implications ... 76
Limitations ... 77
References ... 79
Appendix A Letter to Older Adult Participant ... 89
Appendix B Screening Administration Instructions and Procedure ... 90
Appendix C Informed Consents... 94
Appendix D Approximate Administration Time by Measure and Trial ... 96
Appendix E Test Battery Arrangements ... 97
List of Tables
Table 1: Summary of Known Interrelationships among Visual Memory Measures ... 10
Table 2: Correlations betweenWRAML2, WMS-III, and CMS Visual Memory Indexes ... 12
Table 3: Correlations between WRAML2 Visual Memory Index and TOMAL Non-Verbal
Memory Index ... 12
Table 4: Correlations between WMS-IV Visual Memory Subtests and CMS Visual Memory
Subtests and Indexes ... 13
Table 5: Correlations between WMS-IV Visual Memory Subtests and Indexes with RBANS
Visual Memory Subtest... 13
Table 6: Correlation between RBANS Visual Memory Indexes, RCFT, and WMS-R Visual
Memory Factors, Subtests and Indexes ... 14
Table 7: Correlation between RBANS Visual Memory Indexes, RCFT, and WMS-R Visual
Memory Factors, Subtests and Indexes ... 14
Table 8: Correlation between RCFT, BVRT, BVFDT, and HVOT Total Scores ... 15
Table 9: WRAML2 Correlations with Other Memory Measures and Visual Memory Indexes
... 15
Table 10: Correlations between Construct Validity Coefficients of BVMT-R, WMS-R and
RCFT ... 16
Table 11: Correlations between RCFT-R, BVFD, BVRT, and WAIS-R Visual Memory Trials,
Subtests and Indexes ... 16
Table 12: Intercorrelations of the WMS-IV and WRAML2 Visual Memory and Verbal
Table 13: Additional Validity Information of Suggested Measures for Investigation ... 18
Table 14: Example of Unknown Visual Memory Measure Interrelationships ... 20
Table 15: Correlations Between WMS-III and WMS-IV Visual Memory, WAIS-IV Subtests, and WRAML2 Verbal Memory ... 21
Table 16: Summary of How Well the Six Tests Meet the Six Test Selection Criteria ... 36
Table 17: Variables Used in the Present Study ... 37
Table 18: Sample mean scaled scores and T scores compared to population means ... 53
Table 19: Skewness, Kurtosis, and Normality of visual memory subtests ... 54
Table 20: Correlations of mean scores among visual memory measures for entire sample ... 62
Table 21: Pearson r correlation coefficients for younger adult performances on visual memory measures ... 63
Table 22: Pearson r correlation coefficients for older adult performances on visual memory measures ... 64
Table 23: Correlations between visual memory and non-visual memory measures for entire sample ... 65
Table 24: Correlations between visual memory and non-visual memory measures for older adults ... 66
Table 25: Correlations between visual memory and non-visual memory measures for younger adults ... 67
Table 27: Mean z-scores on visual memory measures for younger and older adult groups
List of Figures
Figure 1: Frequency distribution for education of sample population ... 29
Figure 2: Participant scaled score performances on WRAML2 visual memory subtests ... 55
Figure 3: Young Adult scaled score performances on WMS-IV Designs subtests ... 56
Figure 4: Participant of scaled score performances on WMS-IV visual reproductions subtests 57
Figure 5: Participant T-score performances on RCFT immediate and delayed recall trials ... 58
Figure 6: Participant T-score performances on BVMT-R immediate and delayed recall trials . 59
Figure 7: Participant scaled score performances on WRAML2 verbal learning subtests ... 60
Figure 8: Participant scaled score performances on WAIS-IV coding subtest ... 61
Figure 9: Mean scores converted to z-scores for immediate and delayed performances among
Chapter 1
Introduction
Human visual memory is a fascinating neurological phenomenon. All the colors, shapes,
and designs of the world create a wonderful three dimensional canvas of “visual sensory” which
can be further processed perceptually before being transferred to memory. Visual memory
typically refers to the recall and recognition of stimuli entered through the visual system
(McIntyre, 1997).
Utility of Visual Memory Measures
Visual memory is a critical and complicated cognitive system. According to Luck and
Hollingworth (2008), visual memory is more than information stored from visual reception. “To
qualify as visual memory, the memory must retain properties of the original perceptual state
when the memory was encoded” (Luck & Hollingworth, 2008, p. 3). The literature contains
many sub-domains of visual memory including iconic memory, visual short-term memory, visual
long-term memory, non-verbal memory, and visual working memory. Tests related to these
sub-domains vary by stimuli exposure time (200 milliseconds to several minutes; (Lezak, Howieson,
Bigler, & Tranel, 2012; McIntyre, 1997; Phillips & Baddeley, 1971), duration of delay prior to
recall (seconds, minutes, hours, days to years; (Lezak et al., 2012; McIntyre, 1997), and amount
of cognitive manipulation or reordering of visual stimuli for recall (no manipulation to
The capacity to hold items in memory for recall is sensitive to aging and is known as age
related decline (Peich, Husain, & Bays, 2013;Spencer, & Raz, 1995). Disproportionate declines
in visual memory have also been detected to predict early onset of Alzhiemers’ disease (De Anna
et al., 2014; Hori, Sanjo, Tomita, & Mizusawa, 2013; Smith & Bondi, 2013). According to
Carlozzi, Grech, and Tulsky (2013), individuals who suffer from traumatic brain injury and mild
cognitive impairment also experience a variety of memory deficits. Visual memory measures
have been used for over 55 years to detect, measure severity, and monitor recovery from brain
injury (Bender, 1938; Benton, 1990, as cited in Benton, Sivan, Hamsher, Nills, & Spreen, 1994;
Gilbert, Levee, & Catalano, 1968; Graham, & Kendall, 1946, 1960; Meyers & Meyers, 1995;
Payne, 1960; Spreen, 1960).
The literature shows that, in addition to traumatic brain injury, visual memory measures
have been useful in assessing the impact of lateralized memory loss (Ariza et al., 2006;
McIntyre, 1997) multiple sclerosis (MS; Tinnefeld et al., 2005), lateralized strokes, tumors, and
lesions (Butters, Samuels, Goodglass, & Brody, 1970; Luukkainen-Markkula, Tarkka, Pitkänen,
Sivenius, & Hämäläinen, 2011; McIntyre, 1997), epilepsy (Bonelli et al., 2010), visual agnosias
(Ogden, 1993), generalized cerebral dysfunction (McIntyre, 1997), Huntington’s disease
(Lawrence, Watkins, Sahakian, Hodges, & Robbins, 2000), Parkinson’s disease (Lee et al.,
2010), as well as Alzheimer’s Disease and other forms of dementia (Budson & Solomon, 2011;
Kawas et al., 2003; Lezak et al., 2012).
Even relatively mild insults to the brain can significantly affect one’s memory ability,
including recall and recognition of visual stimuli (De Anna et al., 2014). Therefore, it is not
clinical samples, typically including brain insults, normal aging, alcohol abuse, dementia,
neuro-cognitive diseases such as MS, as well as several psychiatric diagnoses such as intellectual
disability, attention deficit/hyperactivity disorder, anxiety, depression, and schizophrenia (Lezak
et al., 2012). To some researchers, visual memory measures provide such significant utility in
detecting cognitive decline they consider a battery, which does not include a visual memory
measure, to be inadequate (Smith & Bondi, 2013).
Evolution of Visual Memory Measures
While it is important to know the present state and utility of visual memory measures, it
is also pertinent to understand the historical origins from which today’s measures evolved.
Researchers have been interested in investigating and measuring visual memory since the late
1800‘s and over the years visual memory measurement methods have undergone notable
revisions and become increasingly sophisticated. Galton (1880; 1883), Ebbinghaus (1913),
Whitehead (1896), Hawkins (1897), and Binet & Simon (1916), have contributed to the
foundational understanding of visual memory through their research and formulation of methods
to measure this construct.Their methods of measuring visual memory included asking
participants to recall his or her breakfast table contents later in the day (Galton, 1880), recalling
visual arrays of numbers, letters, or words (Ebbinghaus, 1913; Hawkins, 1897; Whitehead,
1896), pictures of faces (Galton, 1883), visual arrays of figures (Binet & Simon 1905, as cited in
Becker, 2003), and documenting recall by using verbal description or drawn reproduction.
Among the first visual memory measures was Drawing Designs from Memory, a subtest
from the original 1905-version of the Binet-Simon Scale, eventually evolving into drawing
of letters or numbers Binet and Simon identified a method of measure visual memory using
material far more difficult to verbally encode than alternative methods (Becker, 2003; Binet &
Simon, 1916; Lezak et al., 2012; McIntyre, 1997), thus, forcing the examinee to rely heavily on
his or her visual memory system. This method gained popularity when it was brought to the
United States from France and was re-introduced as the Memory for Designs subtest in early
editions of the Stanford-Binet Intelligence Test (Becker, 2003; Terman, 1916; Terman & Merrill, 1937; 1973). These early contributions provided a foundation for development of more
sophisticated visual memory measures, such as the Rey-Osterrieth Complex Figure Test
(Osterrieth,1944; Rey, 1941; as cited in Meyers & Meyers, 1995), Visual Reproductions subtest
from the Wechsler Memory Scale (Wechsler, 1945), Memory For Designs Test (Graham &
Kendall, 1946), and the Visual Retention Test (Benton, 1946). Each of these employed a similar
testing format using a brief 5 to 10 second initial exposure to a printed visual array which the
examinee was later asked to draw from memory (Benton, 1946; Graham & Kendall, 1946, 1960;
Terman & Merrill, 1937, 1973).
Today’s visual memory measures utilize recall, recognition, or both formats. The most
common free recall method involves a brief exposure of 2 to 10 seconds to a visual array and
then immediately and/or after a delay interval, the examinee is asked to demonstrate recall by
drawing the array from memory (Benton, 1990; Benedict, Schretlen, Groninger, Dobraski &
Shpritz, 1996; Brannigan & Decker, 2003; Meyers & Meyers, 1995; Randolph, 1998; Sheslow &
Adams, 2003; Sivan, 1991). Measures utilize multiple intervals of delayed recall to measure the
gradual decay in visual memory (Benedict et al., 1996; Meyers & Meyers, 1995; Wechsler,
Other measures utilize only a recognition format for measuring visual memory by
sequentially exposing an examinee to up to a hundred or more geometric figures or simple
pictures of objects, with several repeated target figures (Larrabee, Trahan, & Curtiss, 1992;
Tombaugh, 1996; Trahan & Larrabee, 1997). The examinee is later asked using a forced-choice
format to correctly identify the previously seen target from target and foil figure pairings
(Larrabee et al., 1992; Tombaugh, 1996). Other visual recognition measures use novel visual
arrays such as colored pictures of doors (Baddeley, Emslie, & Nimmo-Smith, 1994) or faces
(Benton, 1990; Benton et al., 1994; Reynolds, & Voress, 2007; Wechsler, 1997) which also are
briefly shown (two to three seconds) then later shown again to the participant while paired with
one or more foil items. A participant must then identify a previously seen door or previously
seen face when paired with a novel door or face (Lezak et al., 2012; Wechsler, 1997).
It is well known among visual memory researchers and clinicians that visual memory
recognition is a robust memory system (Lezak et al., 2012). Most neurologically intact patients
perform nearly perfectly on many visual recognition tasks (Cooperstien & Vitelli, 2001;
Wechsler, 2009). Accordingly, using poor performances on a visual recognition measure has
been developed as a method to evaluate possible test malingering (Tombaugh, 1996). Otherwise,
results from visual recognition measures are typically most useful in cases of significant memory
deficits, such as dementia (Lezak et al., 2012; Wechsler, 2009).
Finally, some measures utilize both recall and recognition formats. Some of these
measures typically utilize a recognition trial following a recall trial in a subsequent fashion such
as those used in the Brief Visuospatial Memory Test, Revised or the Rey Complex Figure Test.
subtest from the Wechsler Memory Scale-IV, uses an original 4 x 4 grid containing unique
geometric designs. The examinee is later asked to correctly identify the previously seen designs
using a pile of cards, half of which are foils (Wechsler, 2009). Thereafter, spatial memory is
assessed by having the examinee try to correctly place each card in its correct grid location. A
similar format to assess visual memory recall and recognition is used by the Picture Memory
subtest from the Wide Range Assessment of Memory and Learning, Second edition (Sheslow &
Adams, 2003); examinees briefly view a scene of people engaged in everyday activities, and then
immediately following are asked to detect scene alterations when shown a similar, but modified
scene. Four trials using different scenes are administered. About 20 minutes later the examinee is
shown different portions of those scenes each paired with an equal number of foils, and asked to
correctly identify which of each pair belonged to an original or modified scene (Sheslow &
Adams, 2003).
Since there are several terms that may be used to reference tests and their components,
the following are defined in the manner they are used throughout this document. A measure is
considered to be a stand-alone test or a subtest from a battery. The components used to make up
index performances in these measures are referred to as trials (e.g., copy trial, immediate recall
trial, delayed recall trial). Performance across trials generates a score that may sometimes be
combined with other trial scores to comprise the total score of a test, or measure. The skill
demands associated with these trials are referred to as tasks (e.g., drawing, circling, selecting
cards from a pile, vocalizing, and pointing). For example, the Wechsler Memory Scale-IV is a
immediate recall and delayed recall trials. These trials include tasks such as drawing with a
pencil and selecting cards of previously seen items to reconstruct a visual grid.
Known inter-relationships between visual memory measures. As the number of
published neuropsychological measures has increased authors such as Bradley and Kapur (2012),
Lezak et al. (2012), Luck and Hollingworth (2008), and Strauss, Sherman, and Spreen (2006)
have provided encyclopedic texts or chapters which describe numerous neuropsychological
measures, their demonstrated utility, critiques and existing norms from a variety of sources;
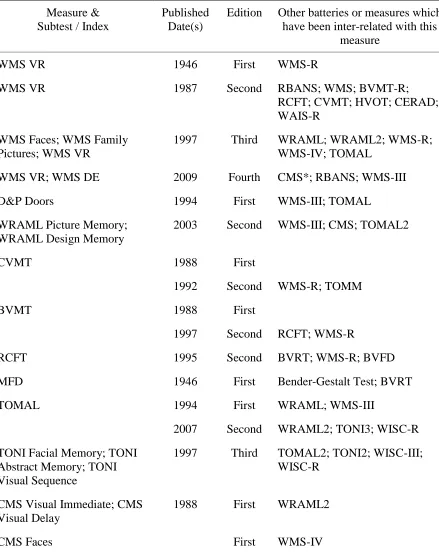
visual memory measures are among those included. Table 1 offers a representative sampling of
that information.
Correlations between many of the visual memory measures listed in Table 1 are found in
Tables 2 through 12. Table 1 was generated from inter-measure relationships reported in test
manuals and the literature including Wechsler (1997; 2008; 2009), Sheslow & Adams (2003),
Benedict et al. (1997), Meyers & Meyers (1995), Krishnan & Donders (2011), Johnstone &
Wilhelm (1997), Hoelzle, Nelson, & Smith (2011), Spangenberg, Henderson, & Wagner (1997),
Okura (2001), and Lezak et al. (2012). In Table 1 the reader will notice that visual memory
measures of the WMS-III have been correlated with those of the WRAML2 and WMS-IV,
however, the visual memory measures’ relationship between WMS-IV and WRAML2 is not
established. Similarly, the relationship between the RCFT and BVMT is known, and the
relationship between RCFT and WMS-R is known. The relationships, however, between RCFT
and the current editions of the BVMT-R and WMS-IV, are not established.
Among visual memory measures, it is critical to know that measures which each claim to
multiple visual memory measures, however, there are gaps between many of the current editions
of visual memory measures commonly used today. Between six commonly used visual memory
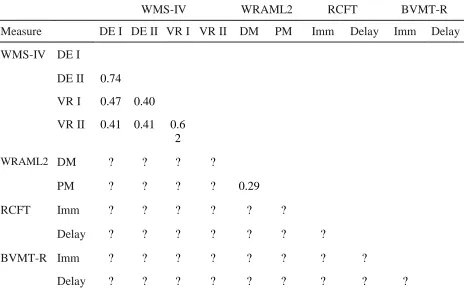
measures and their immediate and delay trials, only seven inter-relationships are known. Table
14 provides the reader with an example of the known and unknown interrelationships among the
visual memory components of six contemporary visual memory measures. Only 7 of the 45
(16%) interrelationships have been established.
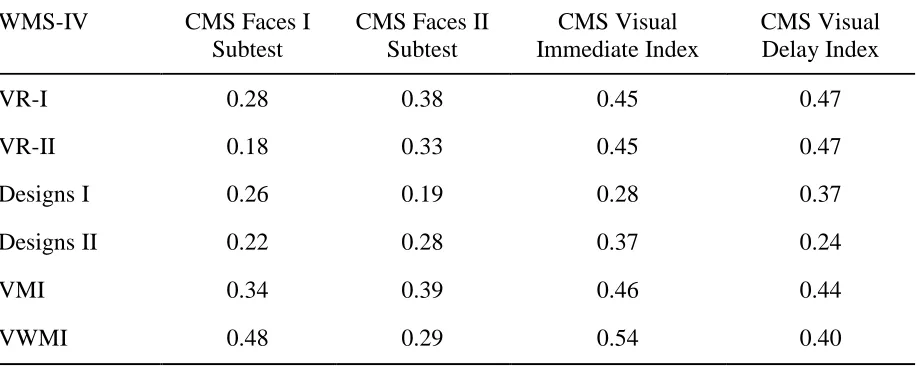
Some other interesting observations can be made in the tables that follow. In Table 4, the
reader will notice correlations range from .18 - .54 between subtest each purporting to measure
visual memory. For measures that assess the same construct, it should be expected that their
interrelationships would have less variability. In Table 8 the reader will notice, in general, the
measures which are most similar in format for measuring visual memory (e.g. RCFT and BVRT)
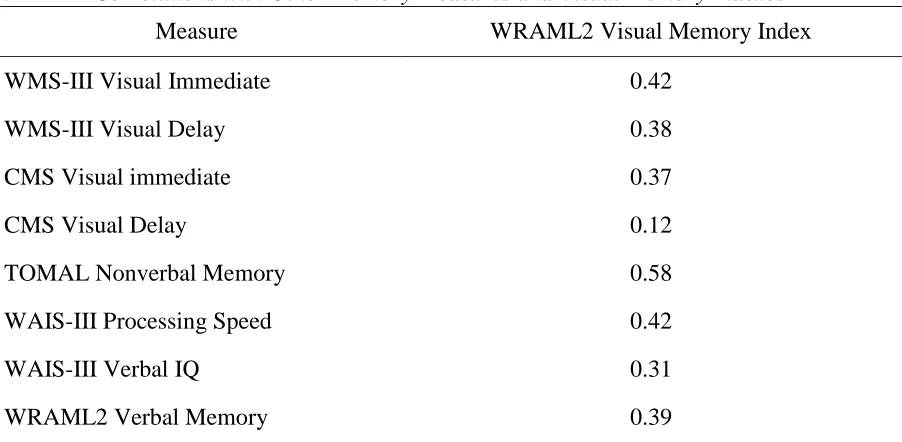
are more highly correlated than those which use different formats, as expected. In Table 9, the
WAIS-III Processing Speed and WMS-III Visual Immediate Index each were correlated at .42
with the WRAML2 Visual Memory Index. This seems contradictory since visual memory and
processing speed are presumably independent constructs. Similarly, in Table 12, it can be seen
that the WRAML2 Design Memory subtest correlates higher with the WRAML2 Verbal
Learning subtest than with the WRAML2 Picture Memory subtest. Again, this seems
contradictory since research suggests that visual memory and verbal memory are relatively
independent constructs (Larrabee & Curtis, 1995; Okura, 2001). That is, visual memory
measures are expected to correlate more highly with other visual memory measures and lower
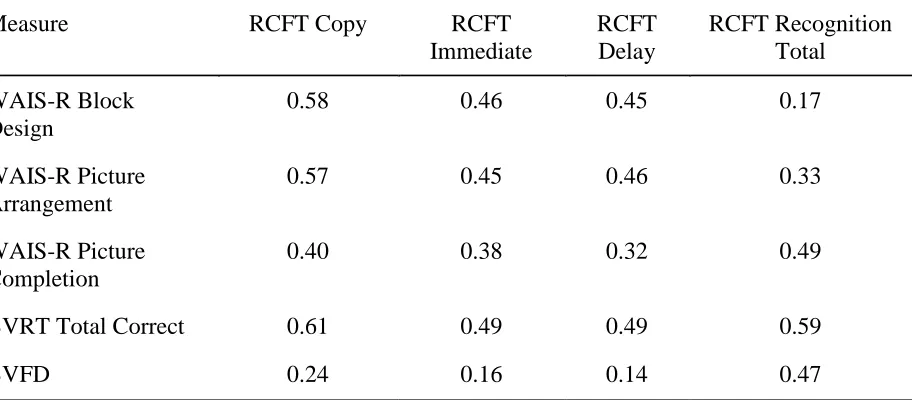
with non-visual memory measures. In Table 11, it can be seen that the RCFT and BVRT are
measures, such as the WAIS-R subtests and the BVFD. However, the correlation differences
between the same-construct and different-construct measures are less than would be expected for
purportedly different constructs. In Table 15, the WAIS-IV non-visual reasoning subtests show
correlations of .42 or less with visual memory measures and indexes of the III and
WMS-IV. Finally, Tables 13, 14, and 15 summarize validity information taken from the test manuals of
the WRAML2 (Sheslow & Adams, 2003), WMS-IV, (Wechsler, 2009), BVMT-R, (Benedict et
al., 1997), and the RCFT (Meyers & Meyers, 1995). Each of the four measures claims to have
discriminant validity with diagnostically similar clinical samples, but none has been correlated
with a current edition of other visual memory measures found in this table. As the reader can
note, for each measure there is a summary of available construct, discriminant, content, or
Table 1
Summary of Known Interrelationships among Visual Memory Measures
Measure & Subtest / Index
Published Date(s)
Edition Other batteries or measures which have been inter-related with this
measure
WMS VR 1946 First WMS-R
WMS VR 1987 Second RBANS; WMS; BVMT-R;
RCFT; CVMT; HVOT; CERAD; WAIS-R
WMS Faces; WMS Family Pictures; WMS VR
1997 Third WRAML; WRAML2; WMS-R;
WMS-IV; TOMAL
WMS VR; WMS DE 2009 Fourth CMS*; RBANS; WMS-III
D&P Doors 1994 First WMS-III; TOMAL
WRAML Picture Memory; WRAML Design Memory
2003 Second WMS-III; CMS; TOMAL2
CVMT 1988 First
1992 Second WMS-R; TOMM
BVMT 1988 First
1997 Second RCFT; WMS-R
RCFT 1995 Second BVRT; WMS-R; BVFD
MFD 1946 First Bender-Gestalt Test; BVRT
TOMAL 1994 First WRAML; WMS-III
2007 Second WRAML2; TONI3; WISC-R
TONI Facial Memory; TONI Abstract Memory; TONI Visual Sequence
1997 Third TOMAL2; TONI2; WISC-III;
WISC-R
CMS Visual Immediate; CMS Visual Delay
1988 First WRAML2
Measure & Subtest / Index
Published Date(s)
Edition Other batteries or measures which have been inter-related with this
measure
RBANS Visuospatial Construction
1998 First WMS-IV; WMS-R; WAIS-R
BVRT 1992 Fifth RCFT; HVOT; BVFD
Stanford-Binet Memory For Designs
1937 First WAIS
TOMM 1996 First CVMT
BVFD RCFT; HVOT; BVRT
TCFT 2003 First RCFT
HVOT 1983 Second RCFT; BVMT; BVFD
CERAD 1997 First WMS-R
Table 2
Correlations betweenWRAML2, WMS-III, and CMS Visual Memory Indexes
WMS-III Visual Memory Indexes CMS Indexes
WRAML2 Indexes Visual Immediate Visual Delay Visual Immediate Visual Delay
Visual Memory 0.42 0.38 0.37 0.12
Visual Recognition 0.43 0.36 0.32 0.12
Note: WRAML = Wide Range Assessment of Memory Learning, Second Edition; WMS-III = Wechsler Memory Scale, Third Edition; CMS = Children’s Memory Scale. (Sheslow & Adams, 2003, pp. 131 - 132).
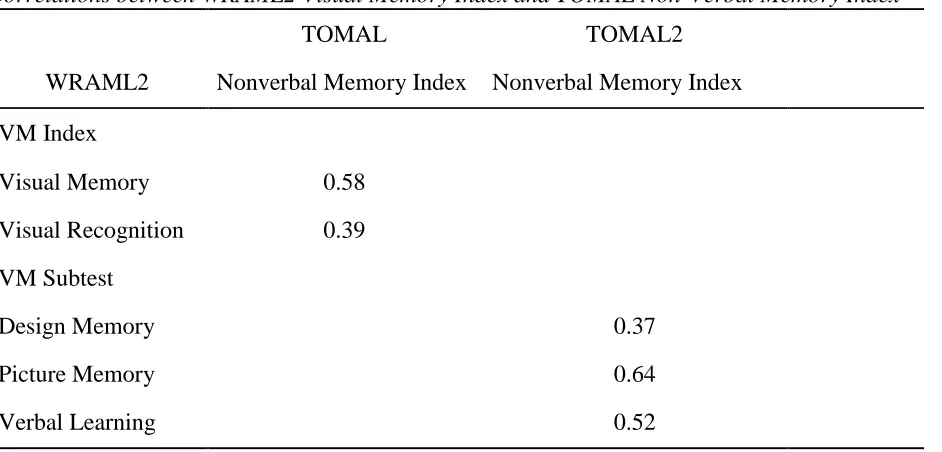
Table 3
Correlations between WRAML2 Visual Memory Index and TOMAL Non-Verbal Memory Index
TOMAL TOMAL2
WRAML2 Nonverbal Memory Index Nonverbal Memory Index
VM Index
Visual Memory 0.58
Visual Recognition 0.39
VM Subtest
Design Memory 0.37
Picture Memory 0.64
Verbal Learning 0.52
Note: WRAML2 = Wide Range Assessment of Memory and Learning, Second Edition; TOMAL
Table 4
Correlations between WMS-IV Visual Memory Subtests and CMS Visual Memory Subtests and Indexes
WMS-IV CMS Faces I
Subtest
CMS Faces II Subtest
CMS Visual Immediate Index
CMS Visual Delay Index
VR-I 0.28 0.38 0.45 0.47
VR-II 0.18 0.33 0.45 0.47
Designs I 0.26 0.19 0.28 0.37
Designs II 0.22 0.28 0.37 0.24
VMI 0.34 0.39 0.46 0.44
VWMI 0.48 0.29 0.54 0.40
Note: WMS-IV = Wechsler Memory Scale, Fourth Edition; CMS = Clinical Memory Scale; VR-I = Visual Reproduction VR-I; VR-VR-IVR-I Visual Reproduction VR-IVR-I; VMVR-I = Visual Memory VR-Index, VMWVR-I = Visual Working Memory Index; VM = Visual Memory. (Wechsler, 2009, p. 73).
Table 5
Correlations between WMS-IV Visual Memory Subtests and Indexes with RBANS Visual Memory Subtest
Wechsler Memory Scale-IV
Subtests Indexes
RBANS Visual
Reproduction I
Visual Reproduction II
Visual Memory Visual Working
Memory
V-S
Construction
0.53 0.41 0.50 0.52
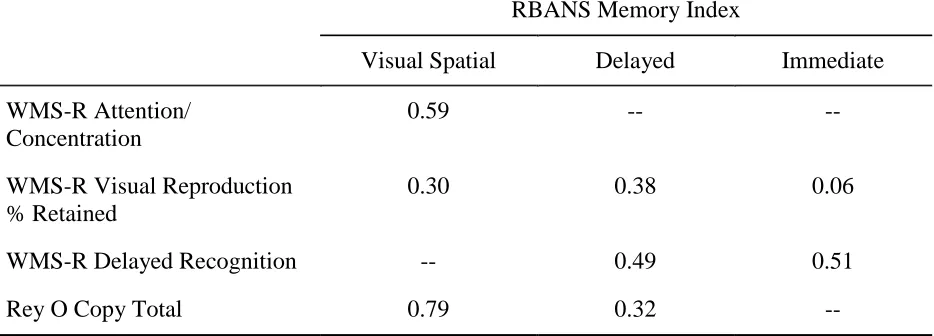
Table 6
Correlation between RBANS Visual Memory Indexes, RCFT, and WMS-R Visual Memory Factors, Subtests and Indexes
RBANS Memory Index
Visual Spatial Delayed Immediate
WMS-R Attention/ Concentration
0.59 -- --
WMS-R Visual Reproduction % Retained
0.30 0.38 0.06
WMS-R Delayed Recognition -- 0.49 0.51
Rey O Copy Total 0.79 0.32 --
Note: RBANS = Repeatable Battery for the Assessment of Neurological Status; WMS-R = Wechsler Memory Scale, Revised; Rey O = Rey Osterieth Complex Figure Test. (Randolph, 1998, pp. 48 - 52).
Table 7
Correlation between TOMAL-2 Visual Memory Subtests and TONI-3 Total Score
TOMAL2 Subtests
Facial Memory
Abstract Visual Memory
Visual Sequence
Visual Selective
NonVerbal Memory Index
TONI3 0.40 0.27 0.57 0.22 0.46
Table 8
Correlation between RCFT, BVRT, BVFDT, and HVOT Total Scores
RCFT BVRT Total Correct BVFDT VFD HVOT VOT
Copy 0.64 0.26 0.48
Immediate Recall 0.49 0.16 0.35
Delayed Recall 0.49 0.14 0.38
Note: RCFT = Rey Complex Figure Test; BVRT = Benton Visual-spatial Retention Test;
BVFDT = Benton Visual Form Discrimination Test; VFD = Visual Form Discrimination. HVOT = Hooper Visual Organization Test; VOT = Visual Organization Test. (Meyers & Meyers, 1995, p. 70).
Table 9
WRAML2 Correlations with Other Memory Measures and Visual Memory Indexes
Measure WRAML2 Visual Memory Index
WMS-III Visual Immediate 0.42
WMS-III Visual Delay 0.38
CMS Visual immediate 0.37
CMS Visual Delay 0.12
TOMAL Nonverbal Memory 0.58
WAIS-III Processing Speed 0.42
WAIS-III Verbal IQ 0.31
WRAML2 Verbal Memory 0.39
Note: WRAML2 = Wide Range Assessment of Memory and Learning, Second Edition; WMS-III = Wechsler Memory Scale, Third Edition; CMS = Children’s Memory Scale; TOMAL = Test of Memory and Learning; WAIS-III = Wechsler Adult Intelligence Scale, Third Edition.
Table 10
Correlations between Construct Validity Coefficients of BVMT-R, WMS-R and RCFT
Measure BVMT-R Total
Recall BVMT-R Delayed Recall BVMT-R Discriminant Index BVMT-R Recognition Bias WMS-R Visual Reproduction
0.68 0.78 0.46 0.02
RCFT Copy 0.65 0.62 0.39 0.02
RCFT Immediate Recall 0.75 0.77 0.53 0.11
Note: BVMT-R = Brief Visuospatial Memory Test, Revised Edition; WMS-R = Wechsler Memory Scale-Revised; RCFT = Rey Complex Figure Test. (Benton et al., 1997, p. 29).
Table 11
Correlations between RCFT-R, BVFD, BVRT, and WAIS-R Visual Memory Trials, Subtests and Indexes
Measure RCFT Copy RCFT
Immediate RCFT Delay RCFT Recognition Total WAIS-R Block Design
0.58 0.46 0.45 0.17
WAIS-R Picture Arrangement
0.57 0.45 0.46 0.33
WAIS-R Picture Completion
0.40 0.38 0.32 0.49
BVRT Total Correct 0.61 0.49 0.49 0.59
BVFD 0.24 0.16 0.14 0.47
Table 12
Intercorrelations of the WMS-IV and WRAML2 Visual Memory and Verbal Learning Subtests
Measure WRAML2
Design Memory
WRAML2 Picture Memory
WMS-IV Designs I
WMS-IV Visual Reproduction I
WRAML2 Design Memory
-- -- -- --
WRAML2 Picture Memory
0.29 -- -- --
WRAML2 Verbal Learning
0.35 0.25 ? ?
WMS-IV Designs I ? ? -- --
WMS-IV Visual Reproduction I
? ? 0.47 --
Table 13
Additional Validity Information of Suggested Measures for Investigation
Battery / Measure
Sample of Validity Information Available on 4 Visual Memory Measures
WRAML2 Construct validity was demonstrated with signficicant factor loads that included visual memory (Sheslow & Adams, 2003, p. 120).
Discriminant validity was demonstrated using clinical groupsincluding alcohol abuse, Alzheimer’s and Parkinson’s disease, Traumatic Brain Injury, and learning disability (Sheslow & Adams, 2003, p. 141).
Concurrent validity correlations are reported between three measures of visual memory, including WMS-III, CMS, and TOMAL (Sheslow & Adams, 2003, p. 130).
WMS-IV Construct validity demonstrated using factor loading including that include visual and visual working memories.
Discriminant validity was demonstrated using clinical groups including normal, Traumatic Brain Injury, Mild Cognitive Impairment; Mild, and Moderate Intellectual Disability, Alzheimer's disease, epilepsy, anxiety, depression, schizophrenia, and learning disability patients (Wechsler, 2009, pp. 84 - 106).
Content validity is demonstrated by reported research supporting visual and other memory domains.
Concurrent validity correlations are reported between measures of visual memory including WMS-III, WMS-III Abbreviated, CMS, III, WAIS-IV, and RBANS (Wechsler, 2009, p. 63).
RCFT Construct validity correlations are reported between the RCFT constructs including: Copy, time to copy, Immediate and delayed recalls, Recognition total correct, Recognition false positives, and Recognition false negatives. (Meyers & Meyers, 1995, pp. 67-82).
Discriminant validity demonstrated using clinical groups of psychiatric and brain damaged patients. (Meyers & Meyers, 1995, pp. 67-82).
Convergent validity demonstrated using correlations with other RCFT components, including: Visuospatial Recall, Visuospatial recognition, Response Bias, Processing Speed, and Visuospatial Constructional ability. (Meyers & Meyers, 1995, pp. 67-82).
Battery / Measure
Sample of Validity Information Available on 4 Visual Memory Measures
BVMT-R Construct validity intercorrelations have been reported among Total recall, Delayed recall, Discrimination Index, and Recognition Response Bias (Benedict, 1997, pp. 25-35).
Discriminate validity was demonstrated using clinical groups including psychiatric, and neurologic patients. (Benedict, 1997, pp. 25-35).
Convergent validity Convergent validity data not reported.
Concurrent validity Intercorrelations reported among its six alternate test forms.
Note: WRAML2 = Wide Range Assessment of Memory and Learning, Second Edition;
Table 14
Example of Unknown Visual Memory Measure Interrelationships
WMS-IV WRAML2 RCFT BVMT-R
Measure DE I DE II VR I VR II DM PM Imm Delay Imm Delay WMS-IV DE I
DE II 0.74
VR I 0.47 0.40
VR II 0.41 0.41 0.6 2
WRAML2 DM ? ? ? ?
PM ? ? ? ? 0.29
RCFT Imm ? ? ? ? ? ?
Delay ? ? ? ? ? ? ?
BVMT-R Imm ? ? ? ? ? ? ? ?
Delay ? ? ? ? ? ? ? ? ?
Table 15
Correlations Between WMS-III and WMS-IV Visual Memory, WAIS-IV Subtests, and WRAML2 Verbal Memory
Measure WMS-III
Visual Imm WMS-III Visual Delay WMS-IV DE I WMS-IV DE II WMS-IV VR I WMS-IV VR II WAIS-IV Symbol Search
0.23 0.18 0.32 0.25 0.40 0.33
WAIS-IV Coding
0.13 0.14 0.36 0.26 0.38 0.28
WAIS-IV Cancelation
0.13 0.10 0.28 0.26 0.26 0.29
WAIS-IV Information
0.18 0.22 0.30 0.25 0.41 0.31
WAIS-IV Digit Span
0.18 0.20 0.36 0.34 0.38 0.30
WRAML2 Verbal Memory
0.41 0.32 -- -- -- --
Note: WMS-III = Wechsler Memory Scale, Third Edition; WMS-IV = Wechsler Memory Scale, Fourth Edition. (Wechsler, 2008, p. 83; Wechsler, 2009, p. 75; Sheslow & Adams, 2003)
It can be expected that visual memory measures claiming to assess the same construct
should highly correlate. While viewing the tables just described, and as noted above, the visual
memory measures usually correlate more highly with one another, and lower with non-visual
memory measures. However, the magnitude of correlations in these relationships varies. In some
cases, visual memory measures have revealed higher than expected inter-correlations with
non-visual memory measures. Additionally, two or three non-visual memory measures have been used
variability exits among past and current editions visual memory measures in their reported
inter-relationships with other visual memory measures and with non-visual memory measures.
Gaps In Known Relationships Among Common Visual Memory Measures
The reader will note in Tables 2 - 14 the relatively limited number of measures with
known relationships with other visual memory measures, especially among the most current
versions of the various measures. Updating these correlations with the current test editions needs
to be done to make known their current interrelationships and to determine if the new
relationships are similar to prior test versions. Relatedly, Lezak et al. states the following:
Unfortunately, some new test revisions may carry the same name but with significant
item, scoring, or norming differences; and newly published batteries may include some
tests quite different from those in previous editions while omitting others. These changes,
sometimes subtle, sometimes not, make it incumbent upon test users to compare and
recognize when test data may be interchangeable and when they are not (2012, p. 103).
Until an updated multi-measure comparison is completed, the magnitude of correlations between
currently used visual memory tests remains unknown.
In addition to the information found in the respective test manuals just reported, the
assessment literature contains a limited number multi-measure investigations of visual memory.
A Canadian research study in 1997 conducted by Nancy McIntyre provided an investigation of
nearly a dozen visual recall and recognition measures for the purpose of developing a new visual
recognition measure. The measures cited and reviewed in McIntyre’s research included Visual
Reproductions, Visual Paired Associates, and Figural Memory subtests from the Wechsler
Rey Complex Figure Test (Osterieth, 1944; Rey, 1941), the Taylor Complex Figure Test (Taylor,
1969; 1979), the Biber Figure Learning Test (Glosser et al., 1989), the Picture Reproductions
subtest from the Randt Memory Test (Randt & Brown, 1983; Randt, Brown, & Osborn, 1980),
the Rivermead Behavioral Memory Test (Wilson et al., 1985), the Recognition Memory Test
(Warrington, 1984), the Recurring Figures Test (Kimura, 1984), the Continuous Visual
Recognition Test (Trahan et al., 1988). While descriptions of each of the measures were
provided, unfortunately, correlations among these measures were not reported because
presumably those data did not exist. Even if they had, most of the measures included by
McIntyre (1997) have since been updated to more recent editions. Further, additional key visual
memory measures currently available were published after McIntyre’s review such as the visual
memory measures from the WRAML2 (Sheslow & Adams, 2003) and WMS-IV (Wechsler,
2009). It is reasonable to conclude, given its established clinical utility, newer tests like the
Designs (Wechsler, 2009), Picture Memory and Design Memory (Sheslow & Adams, 2003)
measures would have been included in the research done by McIntyre (1997) if the study were to
be repeated today (Dunn & Haynes, 2005). Similarly, the Brief Visuospatial Memory Test,
Revised (Benedict et al., 1997) was released in the same year McIntyre’s study was published
and would likely have been another inclusion.
Other studies which have included multiple visual memory measures did so to conduct a
factor analysis. Larrabee, Kane, Schuck, and Francis (1985) included the Visual Reproduction
subtest, and the Benton Visual Retention Test and Larrabee and Curtis (1995) included the
Continuous Visual Memory Test and Visual Reproduction of the WMS-R. The authors
general memory factors and were also a more valid measure of visual memory than immediate
visual reproduction trials (Larrabee et al., 1985; Larrabee & Curtis, 1995). The authors implored
future researchers to consider examining these findings with other tests purporting to measure
visual memory. Presently, there continues to be a gap in the research. There is a lack of studies
providing evidence that current editions of these visual memory measures produce similar
findings.
Okura (2001) performed a factor analysis using verbal and visual memory measures,
including those from the WMS-III, WRAML, and TOMAL. Okura (2001) found that the visual
memory measures contributed independent variance that was different from that generated by the
verbal memory factor (Okura, 2001). Additional interrelationships among the WRAML2,
TOMAL2, and WMS-III can be found in Tables 2 and 3. Since the data available are equivocal
regarding relationships among and between verbal and non-verbal measures, Okura (2001)
suggests clarity might result by an investigation using only current measures.
Rationale for the Present Research Project
Lezak et al. (2012) implore researchers and clinicians to be keenly aware of the changes
from previous to current editions of assessment measures. They echo the sentiment expressed by
Brown (2009) who stated, “Practitioners must be confident that the tests and measures that they
use to evaluate clients are assessing what they purport they do in a rigorous and robust manner”
(p. 519). Consequently, given limited available data, an investigation which identifies
performance similarities and differences across commonly utilized visual memory measures
would assist clinicians wanting to select one or more of these measures. It is crucial for them to
reason the present investigation has compared six commonly used visual memory measures in
order to supply clinicians and researchers with current comparability data.
Since it is known that visual memory tends to naturally decline through aging (Peich et
al., 2013), becoming most prominent after age 65 (Lezak et al., 2012), the current researcher
employed the use of both younger adults and older adults with visual memory measures. An
older adult age band of 65 - 79 is used in this investigation as well as a younger adult age band of
18 - 25. The use of these age groupings approximates polar ends of normal adulthood. Whether
an adult’s visual memory ability is poor or very superior each visual memory measure should
yield consistent performance results for individuals in each age group.
In order to better understand whether these visual memory measures are principally
measuring the same construct, each was correlated with a non-visual memory measure such as
processing speed and verbal memory and magnitudes of those relationships were evaluated. A
sample of previously established magnitude of relationships between visual memory measures
and presumably different constructs commonly measured along with visual memory are found in
Tables 3, 9, 11 12, and 15. As can be seen, each measure of processing speed has been correlated
with visual memory measures at less than .42, suggesting small to low moderate relationships
with visual memory. Such as in Tables 3 and 9, the WRAML2 Visual Memory Index has been
correlated with the WAIS-III Processing Speed and Verbal IQ at .42 and .31, respectively, while
also showing correlations with the Nonverbal Memory Index of the TOMAL and TOMAL2 are
between .37 and .64. Similarly, as shown in Table 12, the WRAML2 Verbal Learning subtest, a
measure of verbal memory, correlates with the WRAML2 visual memory measures of Picture
inter-relationships between visual memory, verbal memory, processing speed and verbal
information are shown. Additionally, many of the correlations shown in Tables 1-15 are reported
from many past editions or outdated measurers.
Overall, visual memory tends to achieve lower correlations with verbal memory, verbal
IQ, perceptual reasoning, and processing speed. Just like those with visual memory, many of the
correlations between non-visual memory measures span one, two, or even three changes in
updated editions of the reported measures. Presumably, if revised editions of visual memory and
non-visual memory measures are modified to better assess their intended constructs, an
evaluation of these current relationships should correspond with in their demonstrated
relationships. That is, if only current editions of visual memory measures and current editions of
non-visual memory measure are analyzed, it should be expected that same-construct measures
(visual memory) achieve higher inter-relationship correlations with less variability while
achieving lower inter-relationship correlations with non-visual memory construct measures.
Similarly, the present investigation anticipates finding higher interrelationship correlations
between current visual memory measures and lower relationship correlations between current
visual memory and non-visual memory measures than many of those reported from past editions.
Hypotheses for the present study
Because of the lack of data regarding comparability across commonly used measures of visual
memory, the following hypotheses will be investigated.
Hypothesis 1. The visual memory measures used in the present study will be
Hypothesis 2. The visual memory measures will correlate at lower levels with the non-visual memory measures.
Hypothesis 3. Across visual memory measures, immediate recall trials and delayed recall trials will generate comparable scores, respectively. That is, mean recall scores achieved across
the various visual memory measures and the delayed recall scores will be comparable across
measures.
Hypothesis 4. The magnitude of correlations across the various visual memory measures for each age group will be comparable.
Chapter 2
Method
Participants
Power analysis (Cohen, 1992) indicated a sample size of 60 participants were necessary
for an assumed effect size of .50 and a power level of .80. This investigation utilized 60
participants separated into two age groups: 29 participants in the younger adult group, and 31
participants in the older adult group. The young adults were ages 18 to 25 with a mean of 20.7
and standard deviation (SD) of .4. The older adults were ages 66 - 79 with a mean of 72.9 and SD
of .77. The sample was 81.7% European-American descent, 8.3% were of Asian descent, 6.7%
were of Latino-American descent, 1.7% were of African-American descent, and 1.7% were of
Native American descent. 3.3% of the sample reported less than a high school education, and
1.7% reported some high school education. 11.7% reported having a high school education,
31.7% reported some college, 21.6% reported having a college degree, 21.6% reported earning a
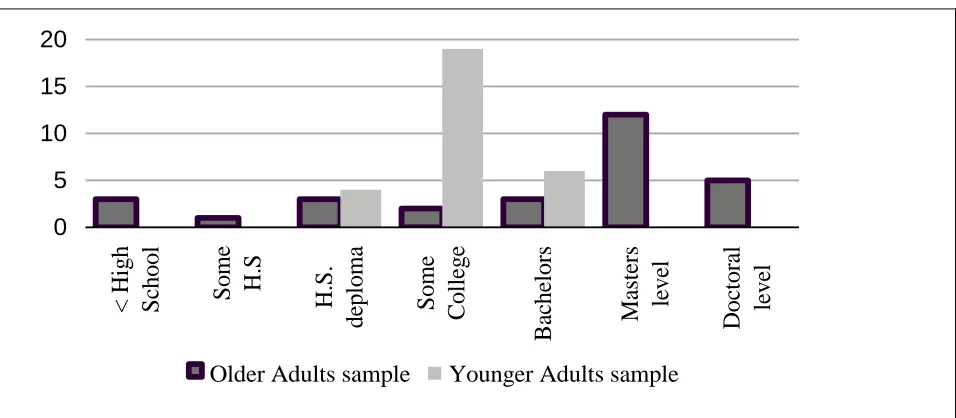
Master’s degree, and 8.3% reported having a doctoral level of education. The older adult sample
was negatively skewed with higher education than the younger adult group (ϗ2 (6) = 37.12, p <
.001). This is determined to be credited to older adults having substantially more time to acquire
further education than the younger adults. Below, Figure 1 shows the education levels for
Figure 1. Frequency distribution for education of sample population. 0 5 10 15 20 < H ig h Sc h o o l So m e H .S H .S. d ep lo m a So m e Co lle g e Ba ch elo rs M aste rs le v el D o cto ra l le v el
Older Adults sample Younger Adults sample
Note: Frequency distribution of education is negatively skewed for the older adults compared to younger adults.
Older adults were selected from volunteers who respond to: (a) Community
Announcements via Retirement Community Activities Directors/Advocate, (b)
Church/community flyer announcement, or (c) word of mouth. A letter was given to the
Retirement Community Activity Director for distribution to interested residents who desired to
participate in this investigation. A copy of this letter can be found in Appendix A.
In order to complete the demands of this investigation, all older examinees were required
to demonstrate basic abilities in several functional domains using a brief screening assessment. A
copy of this assessment can be found in Appendix B. The details of this screening are described
below. As part of the screening for participation, volunteers were queried for having a
Parkinson’s Disease, seizure disorder (epilepsy), or MS: if reported, the volunteer was excluded
from the study.
Screening for volunteer participation took place in two phases for all participants. The
first phase, upon first contact, occurred in person or over the phone. The participant was thanked
for their interest in volunteering for the study, and before beginning any testing the examiner
asked a few questions to ensure the participant met inclusion criteria. These initial questions
included,
1. “What is the year of your birth?”
2. “How much education have you received?”
3. “Do you wear corrective lenses or hearing aids?”
4. “Have you received a diagnosis of Alzheimer's’?, dementia?, Multiple Sclerosis?,
Traumatic Brain Injury?, or anything which has significantly affected your ability to
remember things?”
5. “Do your medications make it hard to remember things?”
6. “Can you use a pencil to draw some simple shapes?” and,
7. “This study has many tasks which will ask you to look at and remember things; are you
still interested in being a part of this project?”
These questions were asked at a normal conversational volume and tone to assess for adequate
hearing. Answers to these questions determined suitability to proceed. Answers to question 1 and
2, regardless of their content, were not grounds for exclusion. Answers to questions 3, 4, and 5
lead to exclusion of unqualified volunteers from the study. A volunteer who indicated a need for
them. If the volunteer expressed difficulty in hearing the examiner, it was permissible for the
examiner to speak at a louder volume.
In the second phase of the screening, two tasks were administered to further establish
adequate hearing, vision, and ability to draw simple shapes. The screening assessment took approximately two minutes.
For the purpose of assessing adequate drawing ability participants were asked to copy
three rudimentary shapes using a number two pencil. These figures are items 10, 13, and 14 of
the Wide Range Assessment of Visual Motor Abilities (WRAVMA) Visual-Motor Drawing
subtest (Adams & Sheslow, 1995), and are shown in Appendix B. These items are estimated to
be at a 5-to 7-year-old level of perceptual motor skill (Adams & Sheslow, 1995). These items
were selected as they most closely simulated the demands of the drawing tasks of the visual
memory measures used in the study. Scoring criteria provided in the WRAVMA Manual will be
used to judge a pass or fail of each of the three shapes. The participant must pass at least two of
the three shapes to be eligible for this study.
For assessing adequate visual acuity participants were asked to read a single 12-point font
sentence typed in black ink on sheet of white, 8.5-inch by 11-inch paper, instructing the
participant to use a pencil to circle one of five common shapes to be found below the sentence.
The participants were to read the sentence independently and circle the correct shape to pass this
component of the screening.
For those “passing” the screening procedure, a written informed consent procedure then
informed consent for younger adults and older adults can be found in Appendix C. Upon
receiving written consent the formal testing procedure was started.
Materials
The measures utilized in this investigation were selected based on meeting six criteria: (a)
assesses visual recall or visual recall and recognition, (b) demonstrates satisfactory reliability and
validity, (c) shown to have clinical utility, (d) common enough to generate 16,000 or more hits in
a literature search from 1995 to 2014, (e) can be appropriately administered to younger and older
adults, and (f) takes no longer than 15 minutes to administer in order to allow several measures
to be administered without exceeding one hour, thereby allowing adequate test comparisons
without creating excessive cognitive fatigue. Below, a rationale for each of the six criteria is
provided.
1) Visual Recall and Recognition and Visual Recall Only. Measures which use
methods of recall and recognition or recall only to measure visual memory were selected since it
has been shown that measures which utilize a free recall format when measuring visual memory
are most sensitive to individuals with visual memory impairments (Tombaugh, 1996; Trahan &
Larrabee, 1997; Wechsler, 2009). In contrast, recognition memory remains relatively intact until
significant cognitive decline is experienced (Wechsler, 2009) The present study included adults
whose histories are free of dementia, traumatic brain injury, or other neurological diagnoses
associated with notable memory deficits, such as seizure disorder. Therefore, it was reasonable
not to include visual measures which only utilize a visual recognition format.
2) Satisfactory Psychometrics.A minimum cut-off for test-retest reliability was chosen
memory measures, and < .35 for relationships with several non-visual memory measures were
chosen as reasonable cut-offs in order to allow for selection of visual memory measures that
have, in the past, shown some adequate concurrent and divergent validities. Due to the
complexity of reporting validity psychometrics, validity has not been reported in Table 16. For
reference of specific known and unknown inter-relationship validity with other visual memory
measures, the reader may reference Tables 1-15 for visual memory, and Tables 3, 9, 11, 12, and
15 for visual memory divergent relationships with verbal memory and processing speed
matching >.35 and <.35 for visual memory concurrent and divergent relationships, respectively.
3) Documented Review for Clinical Utility.Visual memory measures selected will have
been reviewed and documented to haveclinical utility in the field by being included in a
published peer reviewed publication such as the Buros Mental Measures Yearbook.
4) Hits in Literature Search. Each measure selected met an arbitrary minimum hit-rate
of 16,000 hits in searches using the name of the measure with an applicable subtest, and “visual
memory” as search terms within internet Google Scholar, from 1995 and 2014. Search criteria
included the name of the measure and relevant subtest with “visual memory” as search terms.
Table 16 records the number of search hits for each measure was uncovered; the reader will note
a consistency among search hits for measures selected to be between 16,000 and 19,000.
5) Age Range. The measures which were selected had to accommodate ages ranging
from young adult (age 18 - 25) to older adult (age 65 - 79). Since it is known that visual memory
tends to decline with age (Peich et al., 2013), especially after age 65 (Lezak et al., 2012),
examining test comparability at both younger and older ages is clinically meaningful. One
subtests from the WMS-IV. The Designs subtest has a ceiling age of 64, however, given that the
WMS-IV has been claimed to be one of the most widely used assessments of memory (Bradley
& Kapur 2012; Strauss et al., 2006), it was decided to be included with the younger adult
subgroup.
6) Administration Time.Although more measures could have been chosen, the present
investigation limited the number of tests in order to minimize visual array confusion (i.e., the
examinee will know what measure he/she is to recall from the several visual arrays which have
been presented) and to minimize excessive cognitive fatigue, which increases with testing time.
A total of one hour of testing was the limit that was set, allowing a reasonable number of
measures to be used without incurring excessive inter-task confusion or significant fatigue.
Using the above criteria, six measures were selected for comparison. The measures and
details related to how each measure satisfies the above criteria are shown in Table 16.
Concurrent validity data are not presented in Table 16 since what few studies that are available
have already been noted in Tables 2 - 15. The reader will notice two non-visual memory
measures that will also be used as measures that will allow divergent validity comparisons.
Divergent validity information has already been relayed in Tables 3, 9, 11, 12, and 15.
Measures which do not meet the above criteria despite being commonly used are not
included in the present investigation. For example, the RBANS Visuospatial Construction
subtest (Randolf, 1998) does not adequately achieve the desired hit rate and does not have an
adequate age range, so it was not utilized for this study. The CVMT (Trahan & Larrabee, 1997)
& Voress, 2007) does not offer norms past age 59 and utilizes a recognition format of
assessment, precluding its use in the present study.
As listed in Table 17, 10 visual memory scores and three non-visual memory scores are
used in this investigation; they include the Design Memory and Picture Memory subtests from
the WRAML2 (Sheslow & Adams, 2003), the Designs I and II and Visual Reproductions I and II
from the WMS-IV (Wechsler, 2009), immediate, and delay recall trials of the RCFT (Meyers &
Meyers, 1995), and the immediate and delay recall trials of the BVMT-R (Benedict, 1997).
Non-visual memory measures and trials include the Coding subtest from the WAIS-IV (Wechsler,
2008), and the Immediate and Delay trials of the Verbal Learning subtest from the WRAML2
Table 16
Summary of How Well the Six Tests Meet the Six Test Selection Criteria
Reviewed Measure Google Scholar
Search Hits
Test-Retest Reliability
Recognition / Recall / Both
Age Band Test Time Clinical Utility WRAML2 Visual Memory
19,200 5-90
WRAML2 Picture Memory
19,600 0.63 Both 5-90 5 YES
WRAML2Design Memory
19,800 0.59 Recall 5-90 5 YES
WMS-IV Visual Memory
16,200 16-90
WMS-IV Visual Reproduction
16,300 0.93 Recall 16-90 7 YES
WMS-IV Designs 16,100 0.85 Both 16-69 8 YES
RCFT Visual Memory
19,400 0.80 Recall 18-79 7 YES
BVMT-R Visual Memory
17,400 .60-.84 Recall 18-79 12 YES
WRAML2 List Learning
21,300 0.78 None 5-90 4 YES
WAIS-IV Coding 10,400 0.86 None 16-90 2 YES
Note: WRAML2 = Wide Range Assessment of Memory and Learning, Second Edition; WMS-IV = Wechsler Memory Scale, Fourth Edition; RCFT = Rey Complex Figure Test; BVMT-R = Brief Visuospatial Memory Test, Revised Edition; TOMAL2 = Test of Memory and Learning, Second Edition; RBANS = Repeatable Battery for the Assessment of Neurological Status; CMS = Children’s Memory Scale; CVMT = Continuous Visual Memory Test; D&P = Doors & People Battery; WRAML2 = Wide Range Assessment of Memory and Learning, Second Edition;
Table 17
Variables Used in the Present Study
Battery/Test Subtest Domain Measured Dependent
Variable to be Analyzed WRAML2 Design Memory Visual Immediate Memory Scaled Score
Picture Memory Visual Immediate Memory Scaled Score
WMS-IV Designs I Visual Immediate Memory Scaled Score
Designs II Visual Delay Memory Scaled Score Visual Reproduction I Visual Immediate Memory Scaled Score Visual Reproduction II Visual Delay Memory Scaled Score
RCFT Immediate Visual Immediate Memory T- Score
Delay Visual Delayed Memory T- Score BVMT-R Trial I, II, & III Visual Immediate Memory T- Score Delay Visual Delayed Memory T- Score WRAML2 Verbal Learning Verbal Immediate Memory Scaled Score
Verbal Delayed Memory Scaled Score
WAIS-IV Coding Processing Speed Scaled Score
Note: Designs I & II measures will only be administered to younger adults group.
The WRAML2 visual memory measures were selected for their use of meaningful
depictions of people performing everyday activities as well as less meaningful tasks involving
recall of shapes and spatial locations. The RCFT and BVMT-R measures were also selected for
their use of novel figures and shapes in testing both immediate and delayed recall. Additionally,
visual and spatial elements of minimally meaningful figures. They also require minimal fine
motor skills in contrast with the RCFT and BVMT-R which each require, comparatively, more
drawing to assess visual recall. The WAIS-IV Coding and the WRAML2 Verbal Learning
subtests were chosen as divergent validity measures to serve for comparison with the visual
memory tasks. The WAIS-IV Coding subtest was selected because it is a brief measure of
processing speed known to have minimal correlations with at least some visual memory
measures. The WRAML2 Verbal Learning subtest was selected for its use in measuring
immediate and delayed verbal memory. Although completion of the Coding subtest requires
visual perception as do visual memory tasks, the subtest, nonetheless shows low correlation with
visual memory. For example, the RBANS Visuospatial/Construction and WMS-III Visual
Immediate Indexes have yielded correlations of .15 and .14 respectively with the WAIS-IV
Coding subtest (Randolph, 1998; Wechsler, 1997; 2009).
As listed in Table 16, the visual memory measures used in this investigation were
selected for being frequently referenced in memory research publications. They also are
commonly chosen to be included in various tests’ technical manual’s descriptions of concurrent
validity. Additionally, each measure was selected because: (a) the author(s) explicitly claim that
the respective procedure measures visual memory, provided some validity measures supporting
that claim, (b) it was deemed to be in common use amongst current clinicians, and (c) the test
demonstrated satisfactory psychometric characteristics. In addition, each measure has
satisfactorily achieved the six criteria described Table 16. To summarize, these measures use
immediate recall and delayed recall phases of assessment, as well as utilize drawing or
Though many of these measures also include recognition trials, the psychometrics of recognition
subtests show healthy individuals perform quite well unless significantly impaired. For instance,
the WMS-IV manual reports that apart from examinees with neurological damage most healthy
individuals score nearly perfect on the recognition trials of the Designs recognition and Visual
Reproduction subtests (Wechsler, 2009). As a result, the recognition-only portions were not
included in the current study. Since this investigation did not intend to utilize clinical samples, it
is reasonable to eliminate the recognition trials given the minimal variability found in
non-clinical samples.
What follows are detailed descriptions of each measure and the intended trials used in
this investigation.
Design Memory and Picture Memory from the WRAML2 (Sheslow & Adams,
2003). The WRAML2 is a memory battery containing measures of verbal, visual, and working
memories. The battery was designed to be used either as an entire test, or as selected subtests of a
domain of interest (Hartman, 2007). The two subtests comprising the battery’s visual memory
domain will be used: Design Memory and Picture Memory. The Design Memory subtest requires
examinees to look at a 4 inch x 6 inch card on which is drawn simple geometric designs (e.g.,
line, circle, triangle, rectangle) and after a 5-second exposure and 10-second delay, to draw the
designs in their proper places on a blank card. Five different cards, and therefore five separate
trials are administered. The task takes about 5 minutes to administer. The total raw score across
the five trials were converted into an age-based scaled score and used as a dependent measure for
The Picture Memory subtest asks clients to scan a scene of people doing everyday tasks
for 10-seconds and then, using a similar scene, identify content that has been added, removed or
changed. Four different scenes are sequentially administered, each accruing a score which
accumulates a total score which was converted to an age-based scaled score and used as a
dependent variable for analyzed. The Picture Memory subtest takes about five minutes to
administer.
The WRAML2 test manual also reports test-retest reliability and validity data that
provide an adequate basis to judge each subtest as a reliable and valid measure for both age
groups utilized in this investigation. Person Separation Reliability for core subtest range from .85
to .92 for the Picture Memory and Design Memory, respectively (Sheslow & Adams, 2003).
Coefficient alpha data reported for the 18 - 24 year age group for Design and Picture Memory
subtests are .86 and .74 respectively (Sheslow & Adams, 2003). Similarly, for the age subgroups
within the 65 - 75 year age range, coefficient alphas are .87 and .84 for the Design and Picture
Memory subtests, respectively (Sheslow & Adams, 2003). Coefficient alpha reliability for
WRAML2 Visual Memory Index ranges from .84 - .92 between the ages 18 and 79. Specifically,
Coefficient Alpha reliability for Design Memory ranges from .86 - .89 between ages 18 and 74;
and .74 - .88 between ages 18 and 74 for Picture Memory (Sheslow & Adams, 2003). WRAML2
earned a test-retest reliability of .59 for Design Memory, and .63 for Picture Memory with .69 for
the Visual Memory Index (Sheslow & Adams, 2003). WRAML2 inter-correlations for ages 9 to
adult earned .41 for both Design memory and Picture memory (Sheslow & Adams, 2003). For
external validity psychometrics with other past and current measures noted in technical manuals
Design Memory and Picture Memory subtests can be located in the WRAML2 Administration
and Technical Manual (Sheslow & Adams, 2003, pp. 30 - 3; 40 - 41).
Designs and Visual Reproduction subtests from the WMS-IV (Wechsler, 2009). Like
the WRAML2, the WMS-IV is a memory test battery comprised of multiple components which
measure domains of verbal, nonverbal-visual, and auditory memories, and allow the examiner to
assess immediate and delayed aspects of each domain. The two subtests comprising WMS-IV’s
visual memory battery include Designs I and II, and Visual Reproduction I and II. Together,
scores from these test portions compile a Visual Memory Index (VMI).
The Designssubtest requires examinees to look at a 4 x 4 grid containing four, six, or
eight, various basic geometric shapes (circles, lines, dots, squares, triangles, etc.) and after a
10-second exposure the examinee is immediately asked to select the figures just seen from an array
of 8, 12, or 16 cards showing exact or foil design figures from the original grid and then correctly
place these cards in a new, blank 4 x 4 grid. There are six, unique, grid arrangements for each of
the six separate portions of the recall trial. The task takes approximately 10 minutes. The raw
score over the six portions will be converted to an age based scaled score. This score was one of
the dependent variables measured to be analyzed. The Designs subtest also contains a delay trial
(Designs II). In this trial, 20 - 30 minutes following Design I, the examinee is asked to recall and
correctly place the shapes previously seen on a blank 4 x 4 grid, just the same as the examinee
did in Designs I. The examinee is asked to reconstruct each of the six grids, one at a time, in the
same sequence it was introduced. The task takes approximately 10 minutes. Immediately
following the delayed portion, a recognition trial is administered in which the examinee is