HOPKINS, DANIEL CORY. Characterizing the Spatial Variation in Particle Aggregation due to Heterogeneous Turbulence in a Flocculation Reactor. (Under the direction of Dr. Joel J. Ducoste)
ABSTRACT
CHARACTERIZING THE SPATIAL VARIATION IN PARTICLE AGGREGATION DUE TO HETEROGENEOUS TURBULENCE IN A
FLOCCULATION REACTOR by
DANIEL CORY HOPKINS
A thesis submitted to the Graduate Faculty of North Carolina State University
in partial fulfillment of the requirements for the Degree of
Master of Science
CIVIL ENGINEERING Raleigh
2002 APPROVED BY:
___________________________________ Dr. Allen Chao
___________________________________ Dr. Francis de los Reyes
___________________________________ Dr. Joel Ducoste
BIOGRAPHY
I was born on March (A), 1977 in (B). My family moved to (C), NC in the later part of (D) because my father obtained a new job with (E). The next (F) years of my life were spent here. I grew up addicted to sports thanks to my (G). When it was time to leave the nest, I chose to attend (H) and enrolled in the (I) program. After two and a half years and (J) additional course hours later, I finally settled down on a major in Environmental Engineering. I graduated with my bachelor’s degree in 2000, but had not yet finished by my life in the world of (K). Therefore, I jumped right in to graduate school at North Carolina State even though I was also accepted to (L). The past two years of my life have been spent toiling over my course work and research with an emphasis in (M). I would fill you in on the rest of my future plans, but, hey, I don’t even know. Anyway, to complete the story of my life, please answer the questions below. Enjoy!
A 121
B 3 words: not east but; the underside of your hand; rhymes with peach C unscramble: I H L R G A E
D the year the Yankees won the World Series in baseball and Seattle Slew won the Triple Crown in horse racing
E This Company later merged with Memorex and begins with the letter T F Age when you can become president minus 17
G Fill in the blank from this famous Star Wars quote: Luke, I am your ___! H The school responsible for beating the 2002 NCAA National Champions
(Maryland) in basketball in the semifinal of the ACC tournament that same year
I Fill in the blanks: F _ R _ _ _ E A _ C _ L _ E _ E J A baker’s dozen + 1
K unscramble: E C A A I M A D
ACKNOWLEDGEMENTS
TABLE OF CONTENTS
LIST OF FIGURES...v
LIST OF TABLES ... vi
INTRODUCTION...1
MATERIALS AND METHODS ...7
SRW and coagulant solution ... 7
Experimental system... 8
Experimental procedure ... 10
Analysis of PDA data ... 11
RESULTS AND DISCUSSION ...13
Impact of SRW particle concentration and coagulation mechanism on floc growth... 14
Impact of SRW particle concentration and coagulation mechanism on steady-state Ratio value ... 17
Impact of SRW particle concentration and coagulation mechanism on steady-state variance ... 20
CONCLUSIONS ...23
LIST OF FIGURES
Figure 1. Experimental setup... 31
Figure 2a. Ratio curve with one steady-state region. ... 32
Figure 2b. Ratio curve with two steady-state regions. ... 33
Figure 3. Differences in floc structure and its association to variance... 34
Figure 4. Best-fit line approximation of linear growth region. ... 35
Figure 5. Slope vs. G value. ... 36
Figure 6. Ratio vs. G value... 37
LIST OF TABLES
INTRODUCTION
Flocculation is simply the process of generating particle interaction through turbulent mixing to form larger flocs that would successfully be removed in downstream solid/liquid separation processes (Letterman et al., 1999). Turbulent mixing in a flocculation reactor is typically described by the average characteristic velocity gradient, G [s-1] (Saffman and Turner, 1956):
ν ε =
G (1)
where ε is the reactor average turbulent energy dissipation rate and ν is the kinematic viscosity of the fluid. Currently, G is being used as a design parameter to determine the orthokinetic flocculation rate in reactors.
However, researchers have shown that G has shortcomings when describing the turbulent mixing in flocculators. Local energy dissipation rates were found to vary greatly between the impeller discharge region and the bulk region of the reactor (Schwartzberg and Treybal, 1968; McConnachie, 199; Ducoste et al., 1997). In addition, some of the energy provided to the suspension in the reactor dissipates as heat at the impeller or at the walls of the reactor (Letterman et al., 1999). Using G as described by Equation 1 in this sense assumes a homogeneous ε everywhere in the reactor that may be unrealistic when dealing with turbulent mixing involving impellers.
n max
G C
d = (2)
where dmax is the maximum steady-state floc diameter, C is the coefficient related to
the binding energy of the floc particles, and n is the coefficient corresponding to the fractal dimension (D) of the floc, the floc breakup mode, and the size of the dissipative eddies in the fluid (Ducoste and Clark, 1998a). However, researchers have shown that the floc size distribution decreased with increasing reactor size regardless of impeller type at a constant G (Oldshue and Mady, 1978; Clark and Fiessinger, 1991; Clark et al., 1994; Ducoste and Clark, 1998a). Additionally, changes in flocculation performance were also found when using different impeller types at constant G
(Drobny, 1963; Argaman and Kaufman, 1970; Patwardhan and Mirajgaonkar, 1970; Hanson and Cleasby, 1990; Clark et al., 1994; Sajjad and Cleasby, 1995; Ducoste and Clark, 1998a). In their study, Ducoste and Clark (1998a) attributed the change in the volume mean floc size to the turbulence intensity in the impeller discharge region and not to G. Therefore, considering that energy dissipation rate varies depending on reactor location, Ducoste and Clark (1998a) found that using G to calculate the dmax
could be erroneous in floc size determination particularly in different reactor sizes, reactor geometries, or impeller types.
reactor. Not incorporating strain rate and G fluctuations found within a reactor erroneously determined orthokinetic coagulation performance (Kramer and Clark, 2000).
In a recent study, Ducoste (2002) proposed that spatial variations in floc size distribution could exist at low G values making it possible for large flocs formed in the bulk region to be fractured primarily in the impeller discharge zone. Ducoste (2002) suggested that these large flocs could be broken up by larger scales of turbulent motion in the impeller discharge zone that cannot be described by the local energy dissipation rate. Further, it was proposed that the structure of these flocs would be different than those formed in the impeller discharge region and may be formed under different aggregation kinetics (Ducoste, 2002).
Spatial differences in the growth, size, and structure of flocs could be explained through a comparison of circulation and aggregation time scales. The circulation time in a reactor impacts the frequency of the exposure of flocs to the breakup in the impeller discharge region and is determined as follows:
p c
Q V
=
τ (3)
where V is the reactor volume and Qp is the primary flow through the impeller
Aggregation time is determined as the elapsed time taken to develop flocs that are just visible. For orthokinetic aggregation of monodisperse fractal particles, the aggregation time can be computed as:
) q 1 ( ) D 3 ( 4
D 1 D 3
o
c − − −
−
= φ
γ π τ
! (4) where γ! is the shear rate/velocity gradient, φo is the volume fraction of primary
particles, D is the fractal dimension of the particles, and q is the ratio of the size of the just visible floc to the primary particle size (Bremer et al., 1995). D describes the space-filling ability and porous structure of a floc whose value ranges from 1 (a linear floc) to 3 (a compact, or space filling floc) (Selomulya et al., 2001). Note that this equation is only valid for particles with D < 3. Kaolin clay particles, used in this study, have been shown to have flocs with D ≈ 1.8 (Jiang and Logan, 1996). If the circulation time scales were much smaller than the aggregation time scales, then the local particle size distribution would not display any spatial variation in the reactor. If, however, the circulation time scales are on the same order of magnitude or larger than the aggregation time scales, then spatial variations in the floc size distribution could exist and possibly produce the scenario where larger flocs from the bulk region are fractured by large scale turbulent motion in the impeller discharge region (Ducoste, 2002).
concentration is a phenomenon where dense particles accumulate around the periphery of vortices in fluid flow due to particle centrifugation from the vortex cores (Maxey, 1987; Squires and Eaton, 1991; Wang and Maxey, 1993; Eaton and Fessler, 1994). Studies have shown that the collision frequency rate may increase by as much as two orders of magnitude in regions where preferential concentration was found (Reade and Collins, 2000). The particle Stokes number (St), according to Reade and Collins (2000), appears to be the crucial parameter controlling preferential concentration. St is calculated as: 2 p 18 1 St = η σ ρ ρ (5)
where ρp is the particle density, ρis the fluid density, σ is the particle diameter, and η
is the Kolmogorov length scale (Reade and Collins, 2000). Reade and Collins (2000) also explain that this phenomenon tends to occur at St ≈ 1. For larger St values, shorter aggregation time scales can still occur as a result of particles dissociating with the fluid causing velocities between the particles to increase and, thus, trigger more frequent collisions (Reade and Collins, 2000).
regions at low G values in the bulk region of the flocculation reactor. These chaotic/non-chaotic zones in the bulk region would foster cluster-cluster aggregation and assist in the production of larger flocs that can be fractured by large scales of motion in the impeller discharge region. Ducoste (2002) used this concept to explain conditions where tank size and impeller type can influence flocculation results under constant G. Escalating the collision rates in the bulk region as a result of cluster-cluster aggregation or preferential concentration indicates that aggregation time scales could be on the same order or less than circulation time scales at low G values. At higher G values, non-chaotic regions of flow may be less evident in the reactor. Yet, researchers have not investigated whether there are distinct differences in floc growth, steady-state size, and variance about the steady-state size in different reactor regions. This type of data would be necessary to confirm or refute the existence of spatial variation in floc growth, size, and variance and possibly explain some of the research studies involving scaleup/impeller type impact on flocculation performance.
MATERIALS AND METHODS
SRW and coagulant solution
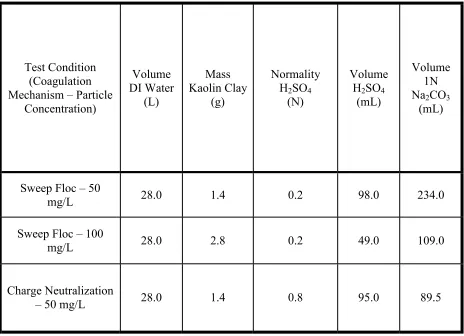
Three different experimental SRWs were developed in the study and are displayed in Table 1. The SRW tested in the flocculation experiments was made by mixing kaolin clay with deionized (DI) water. Average clay particle size was less than 1 µm in diameter. DI water was produced using a reverse osmosis/filtering system. 1 L kaolin clay slurries were developed to transfer the particles to the flocculation reactor. pH adjustment at the beginning of the flocculation experiment was achieved with the addition of H2SO4 or NaOH. Na2CO3 provided the desired alkalinity of the SRW. The
chemical additions in Table 2 were determined after scaling up volumetric amounts computed using a titration technique (Greenberg et al., 1992) from smaller volume samples.
Aluminum Sulfate (Al2SO4·nH2O where n is approximately 12-14) was the
ECA 2000P Electrokinetic Charge Analyzer. Charge neutralization conditions are characterized by a neutral charge in the water at a pH = 6. The final alum concentration was chosen from tests that produced an overall electrokinetic charge of zero. Table 3 provides the volumetric additions of the alum stock solution for each set of experimental conditions.
Experimental system
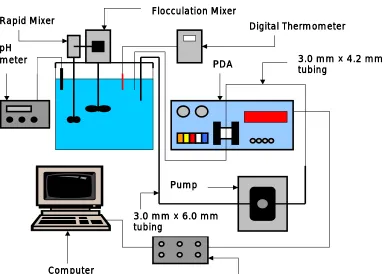
Figure 1 displays a schematic of the flocculation setup. The flocculation reactor was constructed out of 0.5 inch thick Plexiglas and has dimensions of 1.0ft L × 1.0ft W × 1.5 ft H. A metal support, harnessing the flocculation mixer, was centered and attached to two opposing sides of the reactor.
A Cole-Parmer Glas-Col Variable Speed Reversible Precision Stirrer provided the mixing for the flocculation step of the experiments. Attached to the stirrer shaft was an axial impeller with a diameter of 4.5 inches. The rapid mixer (Cole-Parmer Stir-pak laboratory mixer) for the flocculation experiments was attached to a metal extension to the flocculation motor. pH was monitored during the initial mixing of the SRW and the flocculation step using a Fisher Scientific Accumet model 10 pH meter. Calibration of the pH meter occurred daily. The temperature of the SRW was recorded once during initial mixing and once during the flocculation step of the experiment using a Cole-Parmer Digi-Sense Thermometer.
provided here. Changes in the number of particles present in the SRW causes fluctuations in the light intensity measurements that are recorded by the photodiode of the PDA (Rank Brothers). The PDA then converts light intensity measurements into a two-component (AC-DC) voltage, and following a Poisson distribution, Root Mean Square (RMS) values are developed for the fluctuations in the amplified AC component of the voltage (Rank Brothers). RMS values have previously been used to identify the state of aggregation in a flowing suspension (Gregory and Nelson, 1984). The trend is that the larger the RMS value, the greater the state of aggregation of the flowing suspension. Ratio values were reported digitally by the PDA by converting the RMS values using the following equation:
10 DC RMS
Ratio = × (6)
Ratio values are proportional to RMS values signifying that Equation 6 indicates the state of aggregation in a flowing suspension also.
were recorded using National Instruments NI-DAQ Data Acquisition Driver Software and later imported into Microsoft Excel spreadsheets for analysis.
Experimental procedure
Components of the SRW were mixed together in the flocculation reactor using the rapid mixer at approximately 500 rpm for 30 minutes. During this time period pH adjustments were provided, and the temperature of the water was monitored. Flocculation experiments were conducted at room temperature (22 ± 1 °C). Additionally, the rate of flow through the PDA tubing was adjusted to approximately 19 mL/min to ensure minimal shearing of the flocs during the flocculation step of the experiment (Rank Brothers).
Following the blending of the SRW, the rapid mixer was increased to approximately 600 rpm and the coagulant dose was added. The coagulant/SRW mixture was allowed to mix thoroughly for 1 minute. 50 seconds into the rapid mix process, the data recorder was started to ensure capturing Ratio values at the very beginning of the flocculation process.
At the end of the one-minute rapid mix step, the rapid mixer was shut off and removed from the reactor. The flocculation mixer was then started at the appropriate G
value. The mixture was flocculated for approximately 29 minutes. The pH and temperature were checked during the flocculation process. In addition, Ratio values and time measurements are recorded.
Analysis of PDA data
less porosity (Tambo and Watanabe, 1979a; Oles, 1992). Furthermore, restructuring the floc to a more compact size due to more frequent shearing reduced the steady-state floc size, after reaching a maximum size (Spicer et al., 1996; Selomulya et al., 2000).
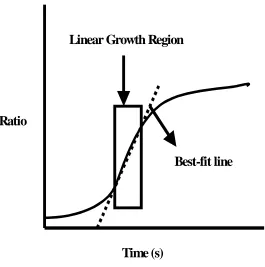
Three pertinent calculations were performed to analyze the data collected during the flocculation experiments. These calculations included the slope of the initial growth region, a weighted average steady-state Ratio value, and a time-weighted variance of the steady-state Ratio values. The slope of the linear initial growth region indicated the rate at which flocs developed. Similar methods have been used by researchers to analyze aggregation rates (Ching et al., 1994). A best-fit line was constructed for the approximate linear growth region of the Ratio curve (Figure 4). From the best-fit line, the slope was determined as:
(7)
The time-weighted average steady-state Ratio value was computed as:
∑
∑
= = ⋅ = N 1 i i N 1 i i i Time ) Time Ratio (Ratio (8)
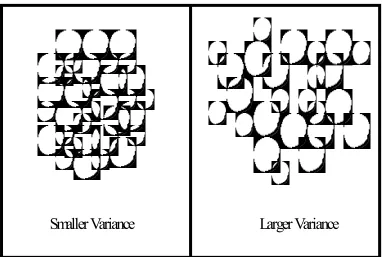
Ratiorepresents the state of aggregation obtained over a steady-state time interval. Obtaining the time-weighted variance of the Ratio values of a steady-state region provided an indicator of the severity of breakup as well as a measure of floc structural differences. Generally, a smaller variance signified a tighter floc size distribution and a more homogeneous, dense, and less porous floc structure in the
sampled reactor region. This concept is explained more thoroughly in a later section. Equation 9 below was used to calculate the time-weighted variance.
= Variance
(
)
[
]
∑
∑
= = ⋅ − N 1 i i N 1 i i 2 i Time Time io AverageRat Ratio (9)RESULTS AND DISCUSSION
In this study, a constant sweep floc mechanism was selected for the experiments investigating the impact of particle concentration while a fixed particle concentration of 50 mg/L was used to study the impact of coagulation mechanism. As discussed earlier, a second steady-state region in the Ratio value was found with higher G values (≥ 70 s-1 and occasionally at 50 s-1). The second region represented the final state of aggregation in the higher G experiments. The Ratio values along with the variance in these regions were used to develop Figures 5 – 7.
Producing flocs larger than what is measurable by the PDA under the existing gain control settings provides Ratio values that are less than what actually pertain to the floc sizes in the flowing suspension (Rank Brothers). Substantial overload to the PDA, as experienced with the larger SRW particle concentration at G = 40 s-1, skewed the Ratio values recorded. This directly provided erroneous results for the analysis of the initial growth rate, steady-state Ratio value, and steady-state variance. Therefore, data collected under these experimental conditions has been left out for discussion (note Figures 5 – 7). It is thought that if proper gain control settings were available for the range of floc sizes encountered, the data would conform to trends observed for the lower particle concentration.
Impact of SRW particle concentration and coagulation mechanism on floc growth
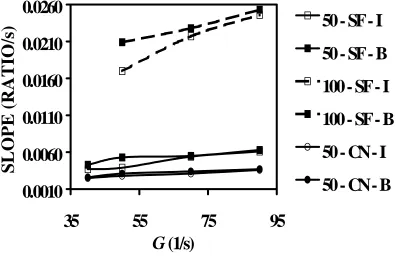
Figure 5 displays the floc growth determined at different reactor regions for the two particle concentrations and coagulation mechanisms over the range of G values tested. Slope values of the linear growth region were averaged for several experiments. In Figure 5, floc growth was found to increase with increasing G
regardless of particle concentration or coagulation mechanism. As seen by others, the higher growth rates are the result of more particle collisions occurring with increased
investigation of the impact of particle concentration on a colloid system with a low salt level (< 1 M KNO3) concentration.
The results in Figure 5 also showed that floc growth was larger in the bulk region than in the impeller discharge region at lower G values (i.e. G = 40 s-1 to occasionally 50 s-1). Cluster-cluster collisions have been used to characterize aggregation in the bulk region (Ducoste, 2002). As discussed in Ducoste (2002), at low G, the bulk region may contain chaotic and non-chaotic zones. Research has shown that floc collision is favored at the boundaries of these chaotic and non-chaotic zones in the bulk region (Danielson et al., 1991; Hansen and Ottino, 1996). As a result, cluster-cluster aggregation would be favored in the bulk region making the growth rate seem larger. In the impeller region, particle collision is mostly dominated by primary-primary or primary-cluster aggregation. The resulting growth rate in the impeller discharge region would consequently be lower due to these types of particle collisions. These collision patterns are the result of the turbulence heterogeneity and may be the result of the magnitude of aggregation time scales versus the reactor circulation time scales.
tested (G = 90 s-1). As discussed earlier, cluster-cluster collisions may be more pronounced at higher particle concentrations in the bulk region at the border of these chaotic and non-chaotic regions. This action would further push the time scales of collisions towards the reactor circulation time scales and, hence, increase the G
required to produce growth rate convergence between the impeller discharge region and bulk region.
In Figure 5, the results showed higher floc growth moving from the charge neutralization mechanism to the sweep floc mechanism. In sweep floc, the precipitate, Al(OH)3(s), a product of hydrolyzing alum, develops an amorphous floc structure with
porous openings available to enmesh suspended particles as it “sweeps” through the suspension (Reynolds and Richards, 1996). Charge neutralization involves reducing the diffusive layer of suspended particles by lowering the energy required for other suspended particles to contact one another through adsorption of the coagulant onto suspended particle surfaces (Letterman et al., 1999). It was found that greater particle collision efficiency occurred between less dense, porous flocs, as seen with the sweep floc mechanism, compared to that observed with solid particles (Kusters et al., 1997). Increasing collision efficiency will increase the floc growth rate and produce larger sizes.
larger than the circulation time scales of the reactor. As a result, floc growth in the reactor never exhibited a heterogeneous quality at lower G values.
Impact of SRW particle concentration and coagulation mechanism on steady-state Ratio value
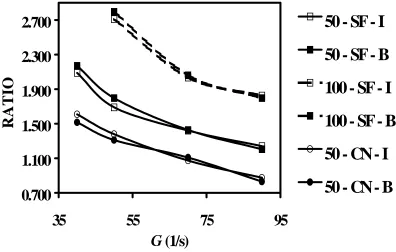
Figure 6 displays the impact of particle concentration and coagulation mechanism on the Ratio values determined at different reactor locations as a function of G. In Fig. 6, the results showed that the Ratio values decreased as G increased regardless of particle concentration and coagulation mechanism. As confirmed by others, higher breakup rates were shown to decrease floc size as G increased (Oles, 1992; Parker et al., 1972; Tambo and Watanabe, 1979a; Spicer and Pratsinis, 1996; Selomulya et al., 2000). The range of flocs vulnerable to breakup increases as flocs grow (Kusters, 1991). Considering floc growth proved to increase at higher shear rates (Selomulya et al., 2000; Ching et al., 1994), larger G values would also increase the breakup rate and the range of flocs affected. The end result is a flocculation environment that produces a smaller steady-state mean floc size in a shorter amount of time with increasing G values.
In Figure 6, increasing the particle concentration of the SRW increased the Ratio value over the range of G values tested. Particle collisions are more frequent with a larger number of particles present in the reactor and, as a result, produce a larger floc size. Researchers have suggested that cluster-cluster collisions of the bulk region flocs (Ducoste, 2002) with a looser and weaker floc structure (Oles, 1992; Tang
the impeller discharge region (Ducoste, 2002). The results in Figure 6 seems to slightly confirm that possible scenario since the Ratio value of the bulk region was greater than the impeller discharge region Ratio value at G < 70 s-1.
As G increased, the Ratio values obtained in the two different reactor regions merged to the same value for both tested particle concentrations (Figure 6). Data collected for both the 50 mg/L and 100 mg/L concentration indicated that near G = 70 s-1, little difference was found in the floc size between the impeller discharge region and the bulk region. At higher G values, the flocs are circulated more frequently through to the impeller discharge region where any loosely attached particles to a floc created in the bulk region are eroded. The remaining floc has a stronger floc binding energy similar to the flocs formed from primary-primary collisions (Yeung et al., 1997; Dyer and Manning, 1999).
In Figure 6, the results clearly showed that sweep floc coagulation produced larger Ratio values than charge neutralization coagulation over the range of G values tested. This trend supports the difference noted earlier in floc structure between the two different coagulation mechanisms. The results suggest that tighter, less porous floc structures are developed using the charge neutralization mechanism, whereas the amorphous floc structure of sweep floc provides a less dense, porous, and larger floc.
shearing of the impeller discharge region. However, as the G increased, circulation time decreased, and the large bulk region flocs more frequently encountered the higher viscous shearing region (Griffiths, 1996). The looser floc structures of the bulk region (Oles, 1992; Tang et al., 2001) ruptured into smaller flocs. These smaller flocs are stronger than the original bulk flocs from which they were derived due to greater primary-primary collisions (Yeung et al., 1997; Dyer and Manning, 1999). The breakup of the bulk region flocs generated a floc size similar to those of the impeller discharge region producing a homogeneous floc environment in the reactor.
experienced similar collision frequencies that resulted in a common Ratio value at higher G.
Impact of SRW particle concentration and coagulation mechanism on steady-state variance
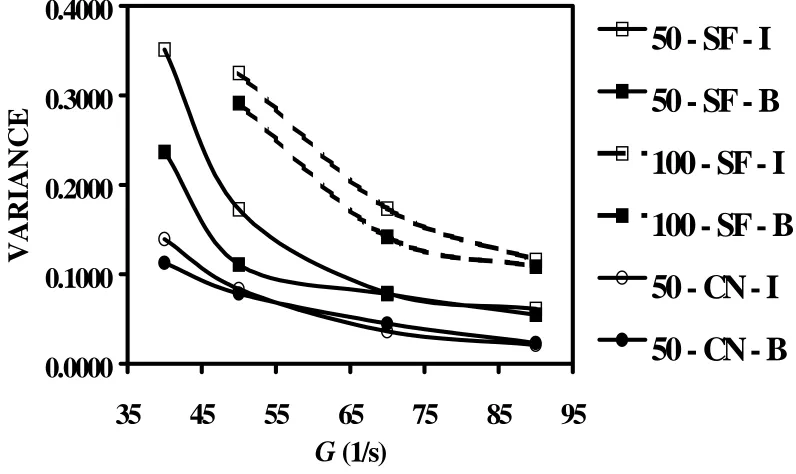
Figure 7 displays the variance values determined at different reactor regions for the different particle concentrations and coagulation mechanisms over the range of
G values tested. In Figure 7, the results showed that variance decreased as G increased within the reactor. A large variance value indicates that a wider range of floc sizes exists at that specific location. A wider range of floc sizes at the lower G values (i.e. greater variance) may suggest that larger particles were being formed in the bulk region than in the impeller discharge region. These larger bulk region flocs are then broken up in the impeller discharge region.
the bulk region may occur from the erosion of primary particles from the structure due to prolonged exposure to high shear stresses, thus trimming the large tail of the floc size distribution. The smaller flocs are relatively unaffected by the higher shear stresses, so that the range of the floc size distribution is reduced mainly due to large floc erosion and restructuring. Therefore, the variance in this study could be considered an indicator of floc structure changes. However, further investigation is required to determine whether variance could measure floc structure changes at low G
values considering little breakup occurs at the lower shear stresses.
In this study, increasing the particle concentration was found to increase the variance in the Ratio values (Figure 7). The increased number of particles available for collision encouraged the formation of a larger, more heterogeneous range of floc sizes. As discussed earlier, a large variance indicates the formation of flocs that are porous, relatively weak, and have a low D value. Past experimental research has proven that as more primary particles were added to growing flocs with a D less than the Euclidean dimension, floc density decreased coupled with an increase in porosity (Clark and Flora, 1991). Therefore, variance may also describe the floc structure observed due to changes in particle concentration. Considering this interpretation of variance, a larger variance found for the higher particle concentration seems to further confirm the findings of Clark and Flora (1991).
discharge region will cause the fracture of bulk region flocs into particles much larger than the primary particle size as well as the erosion of primary particles from these larger flocs. The result is a wide distribution of particle sizes in that zone. In the bulk region, breakup occurs at a much lower rate. As a result, the particle distribution should be narrower (i.e. smaller variance). This means that flocs in the bulk region may be allowed to form larger aggregates due to the preferential concentration of particles at chaotic/non-chaotic boundaries without being fractured until they recirculate into the impeller discharge zone.
As G increased, the variance tends to decrease due to a higher breakup rate from the higher shear stresses in the reactor (Figure 7). In addition, Figure 7 clearly shows that the variance in the bulk and impeller discharge region tends to merge as G
increases. Convergence of the bulk and impeller discharge region variance occurred at a higher G value with increasing particle concentration (G = 70 s-1 for the 50 mg/L concentration; G = 90 s-1 for the 100 mg/L concentration). As discussed earlier, the higher particle concentration tends to further increase the collision rate in the bulk region at the locations where particles are preferentially concentrated (i.e. chaotic/non-chaotic boundaries). Therefore, a higher circulation frequency and impeller discharge region breakup rate is needed to force a homogeneous floc size distribution in the reactor.
variation in floc size as a result of breakup. Flocs formed under sweep floc tend to have open floc structures that are better designed to “sweep” out suspended particles essentially offering several possible locations on the floc surface for particles to attach. However, this open structure produces weaker flocs whose large particles could be easily fractured and generate a wider distribution of particle sizes.
Under charge neutralization, greater variance in floc size was still found in the impeller discharge region at lower G values although the difference between that region and the bulk region was much less than that under sweep floc conditions (Figure 7). Charge neutralization data indicated a homogeneous variance at G = 55 s-1, which is less than that found with sweep floc (G = 70 s-1). These results suggest that the coagulation mechanism plays a significant role in altering the collision rates in both the impeller discharge and bulk region.
CONCLUSIONS
• Floc growth increased as G increased, regardless of particle concentration or coagulation mechanism, as greater particle collision frequency accompanied greater shearing rates. Greater particle concentration increased particle collision frequency in the reactor generating greater floc growth. Moreover, greater floc growth was achieved with flocs produced with sweep floc coagulation mechanism than with the charge neutralization mechanism.
• The flocculation results confirmed previous research that the mean floc size dropped as G increased, regardless of the particle concentration or coagulation mechanism. Furthermore, increasing the number of particles in the SRW increased the floc size developed in the reactor. In addition, larger flocs were also generated by the amorphous, less dense sweep floc structures than by the tighter flocs formed with charge neutralization.
• The variance in the floc size distribution decreased as G increased within the reactor, regardless of particle concentration and coagulation mechanism. The results showed a larger variance with an increase in particle concentration. The increased number of particles in the SRW encouraged the formation of a greater range of floc sizes from primary-primary, primary-cluster, and cluster-cluster collisions. Steady-state floc size variation was less when using the charge neutralization mechanism due to the tight, condensed floc structures developed.
with differences between aggregation and circulation time scales were the main reason for these differences. All but the charge neutralization floc growth data point towards a heterogeneous environment at low G values, with a shift towards a homogeneous environment at high G values. Additionally, variance was found to provide a measure of relative changes in floc structure with changes in G values, particle concentration, and coagulation mechanism, although further investigation is required to determine whether variance is a realistic parameter to judge structural changes in flocs at low G values.
REFERENCES
Argaman, Y. and Kaufman, W.J. (1970) Turbulence and flocculation. Journal of Sanitary Engineering Division ASCE, SA2, 223.
Bremer, L.G.B., Walstra, P., and van Vliet, T. (1995) Estimations of the aggregation time of various colloidal systems. Colloids and Surfaces A: Physiochemical and Engineering Aspects 99 (2), 121-127.
Burns, J.L., Yan, Y.D., Jameson, G.J., and Biggs, S. (1997) A light scattering study of the fractal aggregation behavior of a model colloidal system. Langmuir 13 (24), 6413-6420.
Camp, T.R. and Stein, P.C. (1943) Velocity gradients and internal work in fluid motion. Journal of the Society of Civil Engineering 30, 219-237.
Ching, H.W., Tanaka, T.S., and Elimelech, M. (1994) Dynamics of coagulation of kaolin particles with ferric chloride. Water Research 28 (3), 559-569.
Clark, M.M, Srivastava, R.M., Lang, J.S., Trussell, R.R., McCollum, L.J., Bailey, D., Christie, J.D., and Stolarik, G. (1994) Selection and design of mixing processes for coagulation. AWWARF Report, Denver, CO.
Clark, M.M. and Fiessinger, F. (1991) Mixing and scaleup in mixing in coagulation and flocculation. AWWARF, Denver, CO.
Clark, M.M. and Flora, J.R.V. (1991) Floc restructuring in varied turbulent mixing. Journal of Colloid and Interface Science 147 (2), 407-421.
Danielson, T.J., Muzzio, F.J., and Ottino, J.M. (1991) Aggregation and structure formation in chaotic and regular flows. Physical Review Letters 66 (24), 3128-3131.
Drobny, N.L. (1963) Effect of paddle design in flocculation. Journal of Sanitary Engineering Division, ASCE SA2, 17.
Ducoste, J.J. (2002) A two-scale PBM for modeling turbulent flocculation in water treatment processes. Chemical Engineering Science, in press.
Ducoste, J.J., Clark, M.M., and Weetman, R.J. (1997) Turbulence in flocculators: The effects of tank size and impeller type. AICHE 43 (2), 328-338.
Dyer, K.R. and Manning, A.J. (1999) Observation of the size, settling velocity, and effective density of flocs and their fractal dimensions. Journal of Sea Research 41 (1-2), 87-95.
Eaton, J.K. and Fessler, J.R. (1994) Preferential concentration of particles by turbulence. International Journal of Multiphase Flow 20 (Supp.), 169-209.
Francois, R.J. (1987) Strength of aluminum hydroxide flocs. Water Resources 21 (9), 1023-1030.
Greenberg, A.E., Clesceri, L.S., and Eaton, A.D. (1992) Standard methods for the examination of water and wastewater. APHA, AWWA, and WEF, Washington, D.C., 2-25-2-28.
Gregory, J. (1981) Flocculation in laminar tube flow. Chemical Engineering Science 36, 1789-1794.
Gregory, J. and Nelson, D.W. (1984) In solid-liquid separation. Ellis Horwood, Chichester, 172-182.
Griffiths, S. (1996) Journal of CIWEM 10, 324.
Han, M. and Lawler, D.F. (1991) Interaction of two settling spheres; Settling rates and collision efficiencies. Journal of Hydraulics Division, ASCE 17 (10), 56-73. Hansen, S. and Ottino, J.M. (1996) Aggregation and cluster size evolution in
nonhomogeneous flow. Journal of Colloid and Interface Science 179 (1), 89-103. Hanson, A.T. and Cleasby, J.L (1990) Effect of temperature on turbulent flocculation:
Fluid dynamics and chemistry. Journal AWWA 82 (11), 56-73.
Hsu, J.P. and Glasgow, J.B. (1983) Floc size reduction in the turbulent environment. Particulate Science and Technology 1, 205.
Jiang, Q. and Logan, B.E. (1996) Fractal dimensions of aggregates from shear devices. Journal AWWA 88 (2), 100.
Kusters, K.A. (1991) The influence of turbulence on aggregation of small particles in agitated vessels. Ph.D. thesis, Eindhoven University of Technology, The
Netherlands.
Kusters, K.A., Wijers, J.G., and Thoenes, D. (1997) Aggregation kinetics of small particles in agitated vessels. Chemical Engineering Science 52 (6), 107-121. Letterman, R.D., Amirtharajah, A., and O’Melia, C.R. (1999) Water quality and
treatment: A handbook of community water supplies. McGraw-Hill, New York, 6.47-6.48.
Lu, C.F. and Spielman, L.A. (1985) Kinetics of floc breakage and aggregation in agitated liquid suspensions. Journal of Colloid and Interface Science 103, 95-105. Maxey, M.R. (1987) The gravitational settling of aerosol particles in homogeneous
turbulence and random flow fields. Journal of Fluid Mechanics. 174, 441-465. McConnachie, G.L. (1991) Turbulence intensity of mixing in relation to flocculation.
Journal of Environmental Engineering 117 (6), 731-750.
Oldshue, J.Y. and Mady, O.B. (1978) Flocculation performance of mixing impellers. Chemical Engineering Progress 74 (8), 103-108.
Oldshue, J.Y. (1983) Fluid Mixing Technology. McGraw-Hill, New York, 306. Oles V. (1992) Shear-induced aggregation and breakup of polystyrene latex particles.
Journal of Colloid and Interface Science 154 (2), 351-358.
Parker, D.S., Kaufman, W.J., and Jenkins, D. (1972) Floc breakup in turbulent flocculation processes. Journal of Sanitary Engineering Division, ASCE SA1, 79-99.
Patwardhan, S.V. and Mirajgaonkar, A.J. (1970) Hydraulics of flocculation and paddle characteristics. Journal of the Institute of Engineering (India) Public Health 50, 60. Photometric dispersion analyzer PDA 2000 operating manual. Rank brothers LTD.
Cambridge, England.
Reade, W.C. and Collins, L.R. (2000) Effect of preferential concentration on turbulent collision rates. Physics of Fluids 12 (10), 2530-2540.
Reich, I. and Vold, R.D. (1959) Flocculation-deflocculation in agitated suspensions. I. Carbon and ferric oxide in water. Journal of Physical Chemistry 63, 1497-1501. Saffman, P.G. and Turner J.S. (1956) On the collision of drops in turbulent clouds.
Journal of Fluid Mechanics 1, 16-30.
Sajjad, M.W. and Cleasby, J.L. (1995) Effect of impeller geometry and various mixing pattern on flocculation kinetics of kaolin clay using ferric salt. Proceedings of AWWA National Conference, Anaheim, CA.
Schwartzberg, H.G. and Treybal, R.E. (1968) Fluid and particle motion in turbulent stirred tanks. Ind. Eng. Chem. Fundamentals 7, 1-12.
Selomulya, C., Amal, R., Bushell, G., and Waite, T.D. (2001) Evidence of shear rate dependence on restructuring and breakup of latex aggregates. Journal of Colloid and Interface Science 236 (1), 67-77.
Sonntag, R.C. and Russel, W.B. (1987) Structure and breakup of flocs subjected fluid stresses II: Theory. Journal of Colloid and Interface Science 115 (2), 378-389. Spicer, P.T. (1995) The dynamics of shear-induced flocculation in a stirred tank. M.S.
thesis, University of Cincinnati, Ohio.
Spicer, P.T. and Pratsinis, S.E. (1996) Shear-induced flocculation: The evolution of floc structure and the shape of the size distribution at steady-state. Water Research 30 (5), 1049-1056.
Spicer, P.T., Keller, W., and Pratsinis, S.E., (1996) The effect of impeller type on floc size and structure during shear-induced flocculation. Journal of Colloid and Interface Science 184 (1), 112-122.
Squires, K.D. and Eaton, J.K. (1991) Preferential concentration of particles by turbulence. Physics of Fluids A 3 (5), 1169-1178.
Tambo, N. and Watanabe, Y. (1979) Physical aspect of flocculation process I. Fundamental treatise. Water Research 13, 429-439.
Tang, S., Ma, Y., and Shiu, C. (2001) Modeling the mechanical strength of fractal aggregates. Colloids and Surfaces A: Physicochemical and Engineering Aspects 180 (1), 7-16.
Wang, L.P. and Maxey, M.R. (1993) Settling velocity and concentration distribution of heavy particles in homogeneous isotropic turbulence. Journal of Fluid
Mechanics 256, 27-68.
Figure 1. Experimental setup. PDA PDA PDA PDA Flocculation Mixer Flocculation Mixer Flocculation Mixer Flocculation Mixer Rapid Mixer Rapid Mixer Rapid Mixer Rapid Mixer pH pH pH pH m eter m eter m eter
m eter 3.0 m m 3.0 m m 3.0 m m 3.0 m m ×××× 4.2 mm 4.2 mm 4.2 mm 4.2 mm tubing
tubing tubing tubing
3.0 m m 3.0 m m 3.0 m m
3.0 m m ×××× 6.0 mm 6.0 mm 6.0 mm 6.0 mm tubing tubing tubing tubing Pump Pump Pump Pump Interface Board Interface Board Interface Board Interface Board Com puter
Com puterCom puter Com puter
Figure 2a. Ratio curve with one steady-state region.
R a tio C u rv e
0
1
2
3
4
5
6
0
5 0 0
1 0 0 0
1 5 0 0
T im e (s )
Ra
ti
o
Growth Region
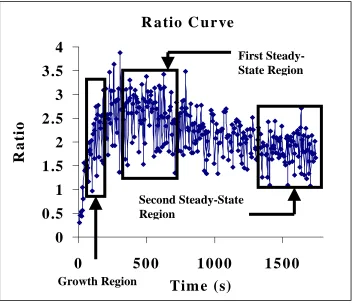
Figure 2b. Ratio curve with two steady-state regions.
R a tio C ur ve
0
0 .5
1
1 .5
2
2 .5
3
3 .5
4
0
5 0 0
1 0 0 0
1 5 0 0
Tim e (s)
Ra
ti
o
Growth Region
First Steady-State Region
Figure 3. Differences in floc structure and its association to variance.
Figure 4. Best-fit line approximation of linear growth region.
Linear Growth Region
Ratio
Time (s)
Figure 5. Slope vs. G value.
Comparison of floc growth at different experimental conditions. 50 = 50 mg/L; 100 = 100 mg/L; SF = sweep floc; CN = charge neutralization; I = impeller discharge region; B = bulk region.
0.0010
0.0060
0.0110
0.0160
0.0210
0.0260
35
55
75
95
G (1/s)
SLOPE (RATIO/s)
50 - SF - I
50 - SF - B
100 - SF - I
100 - SF - B
50 - CN - I
Figure 6. Ratio vs. G value.
Comparison of floc size at different experimental conditions. 50 = 50 mg/L; 100 = 100 mg/L; SF = sweep floc; CN = charge neutralization; I = impeller discharge region; B = bulk region.
0.700
1.100
1.500
1.900
2.300
2.700
35
55
75
95
G (1/s)
RATIO
50 - SF - I
50 - SF - B
100 - SF - I
100 - SF - B
50 - CN - I
Figure 7. Variance vs. G value.
Comparison of the variance in the steady-state floc sizes at different experimental conditions. 50 = 50 mg/L; 100 = 100 mg/L; SF = sweep floc; CN = charge neutralization; I = impeller discharge region; B = bulk region.
0.0000
0.1000
0.2000
0.3000
0.4000
35
45
55
65
75
85
95
G (1/s)
VARIANCE
50 - SF - I
50 - SF - B
100 - SF - I
100 - SF - B
50 - CN - I
Table 1. Experimental conditions.
Test Condition #
Kaolin Clay Particle Concentration
(mg/L)
Coagulation
Mechanism pH
Alkalinity (mg/L CaCO3)
1 50 Sweep Floc 8.0 83.0
2 100 Sweep Floc 8.0 83.0
3 50 Charge
Table 2. Experimental SRW component additions.
Test Condition (Coagulation Mechanism – Particle
Concentration)
Volume DI Water
(L)
Mass Kaolin Clay
(g)
Normality H2SO4
(N)
Volume H2SO4
(mL)
Volume 1N Na2CO3
(mL)
Sweep Floc – 50
mg/L 28.0 1.4 0.2 98.0 234.0
Sweep Floc – 100
mg/L 28.0 2.8 0.2 49.0 109.0
Charge Neutralization
Table 3. Alum dosage and volumetric additions.
Test Condition
(Coagulation Mechanism – Particle Concentration)
Alum Dosage
(mg/L) Volume 1 g/L Alum (mL)
Sweep Floc – 50 mg/L 9.88 280.0
Sweep Floc – 100 mg/L 9.94 280.0
Charge Neutralization – 50 mg/L 9.33 263.0