Comparative Study of Probability Models for
Compound SinIilarity Searching
Naomie Salim
Faculty of Computer Scienceand Information Systems Universiti Teknologi Malaysia
Abstract -
The quality of a chemical retrieval system heavily depends on its molecular similarity function which returns a similarity measurement between the target compound and each molecule in the collection. Compounds are sorted according to their similarity values with the query and those with high ranks are returned to the users. Most current chemical retrieval systems use the vector space model for similarity calculation. In this paper, the use of probability of relevance for compound retrievalis explored. It reports on the effectiveness of the probability model for compound similarity searching by using Binary Independence Model and Binary Dependence Madelon two different databases. The result based on fusion of queries for both models is also discussed. The results show that in all cases, Binary Independence Retrieval model performed better than Binary Dependence model.It is also found that fusion does not give better results than the un-fused queries.
Keywords: molecular similarity searching, probability model, data fusion
1
Introduction
Calculation of similarity between two molecules is an important tool in a chemoinformatics software. A common application of similarity searching is in the rational design of new drugs and pesticides where the nearest neighbours for an initial lead compound are sought in order to find better compounds. Similarity searching is also used for property prediction purposes where the properties of an unknown compound are estimated from those of its nearest neighbours. Underpinning these applications of molecular similarity measure is the similar property principle which states that structurally similar molecules will exhibit similar physiochemical and biological properties. Related to the similar property principle is the concept of neighbourhood behavior which states that compounds within the same neighbourhood or similarity region have the same activity. Unknown biological or physicochemical properties of a molecule can be predicted from the properties of molecules that lie within the same neighbourhood region. In lead fmding, selection of compounds whose neighbourhood regions overlap one another should be avoided. In lead
Mercy Trinovianti Mulyadi
Program Pengajian Diploma, Universiti Teknologi Malaysiaoptimisation, if a particular compound is found to be active, compounds that lie in the same neighbourhood region can be tested to frod one with the most optimum activity.
Molecular similarity searching generally consists of two steps. The first step is to define a representation for the molecules. The molecules can be represented in one-dimensional, two-dimensional and three-dimensional representations. The second step is to compare the selected representations of two or more molecules by calculating similarity coefficient to assign a similarity index. Chemical similarity searching using 2D molecular representations or bit-strings with the Tanimoto similarity coefficient seems to work reasonable well in terms of both efficiency and effectiveness [I]. Algorithms developed for the processing of textual database are also applicable to the processing of chemical structure database [2]. In this paper, another alternative for compound similarity searching based on Probability Model is proposed. Probability Model ranks chemical compounds in decreasing order of their probability of being similarly active to the target compound. According to the Probability Ranking Principle (PRP), if the ranking of the compounds is in decreasing probability of usefulness to the user, then the overall effectiveness of the system to its users will be the best [3].
As an introduction, we will briefly explain the concept of the two Probability Models (PM) used: the Binary Independence Retrieval Model (BIR) and the Binary Dependence Model (BDM). Then, we will show the results of a pilot experiment which that applied PM for chemical compound retrieval. In section 5 we will elaborate the results of experiments on a different database with a wider range of activities.
2
Binary Independence Model for
Chemical Compound Retrieval
The simplest of the PM models is based on the presence or absence of independently distributed bits in active and inactive structures, i.e. the distribution of any given bit over the collection of structures is assumed to be independent of the distribution of any other bit. The probability of any given bit occurring in an active structures is independent of the probability of a.ny other bit occurring in an active structure (and similarly for inactive structures). The model is referred to as the
a(N -A-n+a)
Wi=
(A-aXn-a)
Wi=
(a
+
O.SXN -
A+
a
+
0.5)
(A
-a
+
O.SXn
-a
+0.5)
It should be noted that in the bit relevance model described above, the probabilities of relevance and non relevance, given bi and the corresponding logodds
functionWi,are based entirely on the presence or absence of each bit in active and inactive structures. A bit bi is
favored, i.e given a highWi>if it appears more frequently in active structures than in inactive structures. Ithowever received no "extra credit" for appearing more frequently than another bit biin active structures.
Binary Dependence Model for
Chemical Compound Retrieval
3
proportion of active structures containingtj),and qi as
(n-a)(N-A) (the proportion of inactive structures contlining
b;). Obviously, this assumes that "the bit distribution in the active items previously retrieved is the same as the distribution for the complete set of active items, and that all non-retrieved items [N-A] can be treated as inactive"[5]. The latter assumption is necessary to allow us to assume that N-A (all retrieved inactive structures plus all non-retrieved structures) equals the total number of inactive structures. The former assumption allows us to treat the proportion of active structures containingbiin the retrieved sampleascharacteristic of the proportion in the complete collection, for allbi'
Equivalently, the odds of bi appearing in an active structure is (a/A)/(l-a/A)~ a/(A-a), and the odds of bi
appearing in inactive structure is
(n-a)/(N-A)/[l-(n-a)/(N-A)]=(n-a)/(N-A -n +a)
Inserting these values into the formula forWi,we obtain:
This formula forWiobviously breaks down if Pi equals one (a=A) or zero (a=O). Similarly,Wibreaks down if qi
equals to one (n-a=N-A) or zero (n=a). Statistical theory has been used to justify modifying the formulas for Pi and qi to avoid these singularities by adding a constant c to the numerator and one to the denominator, where c=0.5 or c=n/N [6]. However, there are always cases where these constants dominate the computation and distort the results. Shaw [7] proposes to avoid these problems by using the unmodified formulas for all cases except for singularities where alternative formulas are specified. If
the constant 0.5 is inserted in the formula forWi,the result is:
No. of No. of Total
Active Inactive
Structure Structures
s
No. of structures a n-a n
including bit b·
No. of structures A-a (N-R)-(n-r) N-n
excluding bit b
Total A N-A N
The "odds" of biappearing in a active structure is
p/(l-pJ. Similarly, the "odds" of bi appearing in a
inactive structures is q/(l-qJ. Hence, Wi measures the odds ofbi appearing in a active structure divided by the
odds of biappearing in a inactive structure, i.e., the odds
ratio. Taking the log makes this function symmetric: w,=O if PFqi, is positive if Pi>qi, and is negative if Pi<qi' Wi is a good measure of how well a bit can distinguish active from inactive structures. The functionWi is called the "term relevance" weight or "term relevance function" or "logodds," i.e., the log of the odds ratio forbi. Plainly, Wiwill be a very large positive number for a bit that has a high probability of appearing in a active structure and very low probability of appearing in a inactive structure (and a very large negative number if the probabilities are reserved). Moreover, if the set of index bits in a structure collection satisfies the BI condition, the odd ratio (odds of active divided by odds of non-active) for a given structure Sis merely the odds ratios of all the bi bits appearing inS, i.e, the product of all the correspondingWj. Hence the log of the odds ratio forScan be computed as the sum of the
WI. In other words, the logodds of S being active is
computed as the sum of thew,for index bits appearing in S. The trick is to find a way of computing Pi and qi' If
active data is available, e.g from manually evaluating a previous run with the same query against the same collection or against a training set, then Pi and qi can be estimated from a 2x2 "contingency" Table1summarizing the relevance judgments as given below:
Table 1. ContIngency table of relevance Judgments "binary independent"(BI) model. This model also known as the relevance weighting theory in the more general literature of information retrieval [4]. We start with Pi' the probability that bit biappears in a structure given that the structure is active andqbthe probability that biappears in a structure given that the structure is inactive. Using Bayes' rule of inference and the BI assumption, one can derive a function for ranking structures by probability of relevance. In this function, each bit bi receives a weight wigiven by:
Bit dependell.cies refer to the presence or absence of a bit, which provides information about the probability of presence, or absence of another bit. Assume vector structure,S= {bl, b] ... bn } are binary values. Itis arbitrarily complex to capture all dependence data as we HereN is the total of structures in the collection, n is
Probability Model on the AIDS
Dataset
where
N-isthe number of structures in database
n,-refers to the frequency of structure containing bit bi
nj(irrefersthe frequency of structure containing bit
0(1)
. .
nili(irrefers to the frequency of structure contammg both bitbiand bitbj(i)
A-isthe total number of active structures a-refers to the total number of active structures containing a particular bit b
b,-refers to bit b at location i,
bj(irrefersto bit b at locationj(l)where bitbj(i/is the preceding bit of bitbi,
Pili(i)-isthe probability of both bitbiand bitbjnJ
appearing in active structures,
Pi-isthe probability of both bitbiappearing in active
structures,
qili(iris the probability of both bitbiand bitbj(iJ
appearing in inactive structures,
q ,-is the probability of both bit biappearing in
inactive structures,
pair(bi, bj ) is represented by an edge in the spanningtre~.
The following are the similarity function or RSV of this model, considering only the terms P(SIA) and P(SINA).
The rest remains as a constant and thus are not included in the calculation ofRSV:
P(A[5)=D~lo/(l-'7r)j+ DMf).o/J(Q-P1uUl-lol~Q-qWJ
p(NAj5) ,_/ fjj(J-p,) /-1 PJVI(I-p,) qJl')(I-l})
• PwI(I-f/w) 1 /t(l-q,) wPJIIJ(l-qjVl)j
+l.,bP
[log -0 - g ) I-I)'(~ 'iMn(l-Pv.,Q) q,(l-p,) qJl/l(I-PilllRelevance (activity) information can be considered to be available upon experimentation. To test the algorithm, we used information on the activity of compounds that is available in the database. This model computes the probability of P(SIA) and P(SINA) using the same contingency table as the BIR model (Table 1) and thus producing the following assumption. The adjustment factor is also taken in to consideration to avoid problem resulting from the small value ofA andai'
a)Pi= (aj+0.5) /(A+1)
b)qi=(ni - al+0.5) / (N - A+1) C)pj(i) =(aj(i)+0.5) /(A+1)
d)qj(1)= (nj(i) - aj(l)+0.5) / (N - A+1)
e)Pili(i) =(aili(i)+0.5) /(A+1)'
f) qili(i) = (nili(i) -aili(i)+0.5) /(N - A+1)
(7)
(8)
(9)
o
~ ;(i) ~ ibj(i) = I bj(i)= 0
Hence, the first step in this model is to generate the MST to identify the most important pairwise dependencies. Each given chemical structure collection will construct an MST based on all bits included in the collection. There are many algorithms in generating an
4
MST from pairwise association measures. Weusedthe algorithm by Whitney (1972) which is based on the Dijkstra technique where a maximum spanning tree isgrown by successively adjoining the farthest remaining The objective of the research was to apply the node to a partially formed tree until all node of the graph Probability Model in chemical compound similarity are included in the tree. Next, the dependence treeisthen searching [9] to investigate whether the proposed used to expand the query by taking the original query bits approach yields better performance of screening chemical and adding all bits that are immediately adjacent in the compounds compared to existing methods. The MST. The pairwise term dependencies is obtained for all experiment uses the National Cancer Institute (NCI) bit pairsbiand bj in the expanded query such that each AIDS Database (National Cancer Institute, 1999) as the
303
~~)~~)
(5) (6)
Table 2. Contingency table of maximum likelihood estimates
need to condition each variable in tum on a steadily increasing set of other variables. Hence, to estimate the probability of a structure(P(S))this model captures only the significant pairwise dependence information. Thus
P(S) is the probability of a bitibeing solely dependent on some preceding bitbj(i):
n
P(S)=
n
P(bi1b;(i» i = IA probability distribution that can be represented as in the above expression is called a probability distribution of first-order tree dependence [8], which suggest the construction of aMaximum Spanning Tree (MST) using the Expected Mutual Information Measure (EMIM). EMIM is a measure of a variable containing the information about another variable. Hence, it requires the counting of co-occurrences of bits in a structure, and thus used to measure the dependence between a pair of bits. Let G(V,E) be a connected graph, where V is the set of nodes and Eisthe set of edges. Assigned to each edge (i,
j(i)) is a weight w(i. j(i)). obtained from calculating the
EMIM value of the pair of variables. AnMST is a tree that includes every node and has maximal total weight. It simply maximizes the sum:
L
I(b"b j(,»)l.j
where l(b. bj(iJJ represents the expected mutual information between bitbiandbj(j),
P(b p b j(i») I(bpbj(i»)
=
L
P(bpbj(I»)log P(b)P(b .. )bj,b}(I) 1 l(l)
The contingency table (see Table 2) below further simplify the calculation of EMIM into the following:
Table 3. Result analysis of average GH score for the AIDS database.
5"10 10'% 15"10 20"10 25% 30"10
DIR
(no 29.43 29.51 31.06 3297 35.14 37.27
query fusion)
DD
(no 31.2 30,86 32.26 34,19
36.18 38,16 query
fusion)
-BIR
(query 26,77 26,22 2745 29.38 31.45 33.61
fusion)
DD
(query 28.71 26,9 27,61 29.26 31. I 3 33,12
Fusion)
following: CA, CM and CI. Hence, this simplifies the division of the data sets with each set having equal distribution of CA, CM and CI. Next, an active compound is posted as query, The similarity searching is conducted on the first set and it returns the top 100 compounds. Based on these compounds, the probability ofPIandq,for each biti is computed. Itwill then be used to obtained the ranking score function (RSV) for the second set. The same procedure is repeated again, where the probability ofPi and qi obtained from the top 100 compounds of the second set is used to compute the RSV for the third set. Finally, the probability ofPi and qi
obtained from the top 100 compounds of the third set is used to compute the RSV for the fourth and fmal set. Thus, the result of each query posted will return a total number of 400 compounds obtained by combining the result of each set.
The result readings of GH scores are taken on each 5% interval of structure retrieved, which are 5%, 10%, 15% ... 30%. Rea~iings stop when 30% of the structures retrieved. This means that the final GH score value is obtained when 1732 compounds are retrieved. Retrieval of more compounds than this value is not considered because users normally will only look at the top 1000 compounds. Table 3 and 4 shows the average result of BIR and BD based similarity searching. Generally, the BD has a slightly better performance than BIR and the fused query actually yielded poorer results compared to un-fused queries. For the number of chemical structures retrieved before half of the actives are found, the BIR-based similarity searching attains an average of 1917 compounds and BD with 1859 compounds in the unfused experiment and 2188 compounds for BIR and 2236 for BD in the fusion experiment. In terms of number of active compounds at the top 5% of the ranked list, again the BD has a slightly better performance than BIR and the fused query again yielded poorer results compared to un-fused queries. Itis thus concluded that BD model has better performance than the BIR model. Meanwhile for fusion experiments, both BIR and BD model performs poorly compared to un-fused experiments.
For the first experiment, in the data set, each active compound acts as a probe to search the remainder of the data set. Compounds are then ranked according to the calculated similarity values, from most to least similar, Lastly, the ranked list is analyzed to determine which method is more effective. Mean while for the second experiment the NCI AIDS dataset is divided equally to four sets, with 1443 structures in each set. The NCI AIDS dataset organises compounds according to the test data set. Itrepresents a large data set composed of both active and inactive compounds against a specific therapeutic target and provides a thorough sampling of a particular region in chemical space. This public database contains 5772 compounds, including 247 confirmed active (CA), 802 confmned moderately active (CM) and 4723 conftrmed inactive (Cn. In this data set, both the CA and CM are treated equally as actives and the CI as inactives. For the molecular representation, the BCI 1052-bit structural key-based bit string is used, It is generated based on the presence or absence of fragments in the BCl's standard 1052 fragments-dictionary. Probability model that are used are the Binary Independence Retrieval (BIR) and Binary Dependence (BD) Model. Two sets of experiment were conducted; the fIrst experiment focuses on comparing the effectiveness of the proposed approaches in similarity searching. A series of simulated similarity searching is conducted for both proposed approaches. The second experiment investigates whether fusion of the query of the proposed probability models is better than the unfused query. Data fusion is an approach where data, evidence, or decisions coming from or based on multiple sources, about the same set of objects are integrated to increase the quality of decision making under uncertainty about the objects [10). Three approaches in evaluating the performance of the search methods are used, mainly the GH score, initial enhancement and the number of actives at the top 5% of ranked list.
The GH score gives an indication of how good the retrieved list is with respect to a compromise rate of maximum yield and maximum percent of actives retrieved.
GH= Ha(A+H,) 2AH,
where A is the number of actives structures in the database,
H, is the number of structures in a retrieved list, and
H. is the number of active structures in a retrieved list.
a) Initial enhancements refers to a number of chemical structure retrieved before half of the actives are found. The lesser the value, better is the performance of the similarity searching system.
Initial Average number of enhancement activities at top5%
BIR 1917 133
I(no query fusion)
BD 1859 141
I(no Querv fusion)
BIR 2188 120
(query fusion)
BD 2236 129
(querv Fusion)
Table 4. Result analysis of average initial enhancement and average number of actives at top 5% for AIDS database.
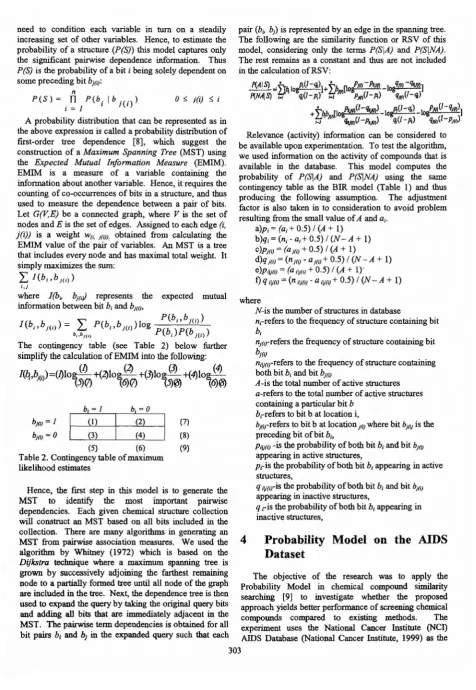
we can conclude that BIR model performed significantly better than the BD model.
AVERAGE GH SCORE
~
" 1 " ' = =
-.'"
~,,~
-2 0 1 - - - : : ; ; , - - - i
5
Probability Model on the MDDR
Dataset
15'J1o 20'10 'JIoMrveU- ... [-+-B1R~_~~~__•eO"(;~~
The second batch of experiments were conducted on the MOOR database, where there are 799 different activities associated with the 113842 compounds in the database. In the MODR database, all these activities are classified under several broad activity classes. A subset of 4448 compounds for testing three activities-Benzodiazepine Agonist, HIV Protease Inhibitor and ACE Inhibitor were built, as shown in Table 5.
Activity Class Compound
Benzodiazepine Anxiolytics 257 Agonist
HIV Protease Agents for AiDS 926 Inhibitor
ACE Inhibitor Antihypertensive 500 Agents
Others 2765
Total 4448
Table 5. Activities and compounds selected from the MOOR database
For testing of the three different active types, all other compounds is ensured to not have the activity tested in order to be treated as inactives. All the data is represented by the BCI bit strings, but the BCI 1056-bit structural key is used instead of the BCI 1052 bit, to make sure that the choice of bit strings does not have any effect on the results. The same methodology as described in section4is repeated. Ail the results shown are averaged over all the targets for the three different types of actives.
Figure I. GH score analysis for BIR and BO model.
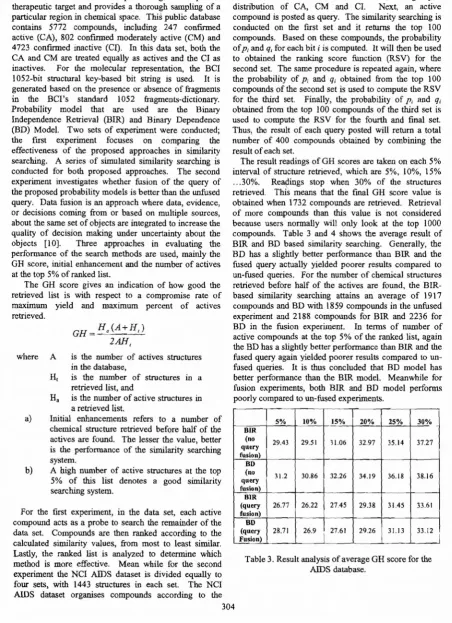
Initial enhancement refers to the number of chemical structures retrieved before half of the actives are found. Figure 2 below shows that again the BD has the highest value of initial enhancement. Itretrieves approximately 2051 more structures before half of the activities are found compared to the BIR model. Here again we can see that BIR model is more superior in terms of average initial enhancement.
AVERAGE INITIAL ENKAHCEIIlENT
Figure 2. Initial enhancement analysis for BIR and BDmodel.
In the following figure(see Figure 1), GH score values at each 5% level of the structure retrieved are plotted for both BIR and BO models. As can be seen in the graph,
5.1
Experiment
Effectiveness
Methods
1:
Comparing
the
of Similarity Searching
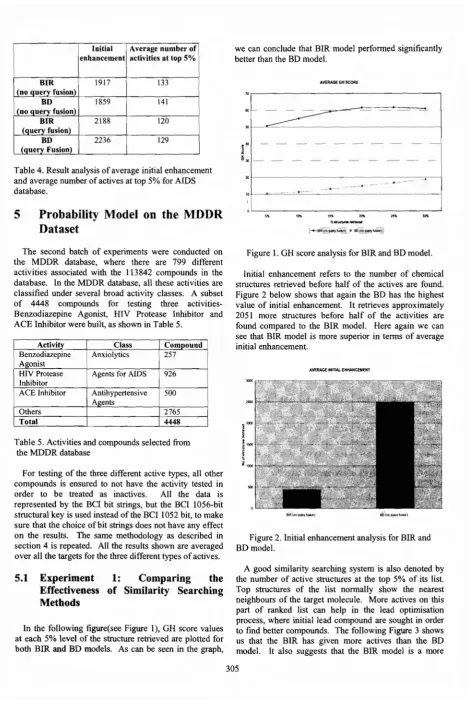
effective similarity searching capability than the BD model.
Figure 3. Average no of actives at top 5% for BIR and BDmodel.
5.2
Experiment
2:
Comparing
the
Performance of Query Fusion Result of
Similarity Searching Methods
Table 7 shows the average initial enhancement and number of actives in the top 5% compounds retrieved for two models in both fused and unfused experiments. Again it can be seen that in the query fusion gives poorer performance compared to unfused query.
6
Conclusion
The results of the experiments show that in many cases, the BIR model is superior to the BD model. However, for the AIDS dataset, the BD model has a slightly better performance than the BIR model. All the experiments using MDDR database shown that BIR model performs better than the BD model, whether with query fusion or non-query fusion approach. Meanwhile, it is found that query fusion results in poorer performance compared to non query fusion. For future work, it is suggested that the models to be tested on a wider range of activities using different bit strings. We also suggest that other probability-based model be explored in the retrieval of chemical compounds from chemical databases.
Table 6. Result analySIS of average GH score for MDDR database
[8] Chow, C. and Liu, C. (1968). "Approximating discrete probability distributions with dependence trees." [5] Salton, G., McGill,M.J, Introduction to modern I'!formation Retrieval, McGraw Hill Publishing Company, New York, 1983.
[4] Efthimiadis, E.N "User Choices: A new yardstick for the evaluation of ranking algorithms for interactive query expansion", Information Processing& Management, Vol 31, No.4, pp605-620, 1995.
[7] Shaw,W.M, ''Term-Relevance Computation and Perfect Retrieval Performance", Information Processing
& Management,Vol 31 ,N04,pp.491-498, 1995.
[6] Robertson,S.E., Spark Jones, "K. Relevance Weighting of Search Terms", Journal of the American Society for International Science, 27,pp.129-146, 1996.
[3 ] Cooper, W.S., "The formalism of probability theory in IT: A foundation or an encumbrance?" Proceeding of the 17'h Annual International ACM SIGIR Conference on Research and Development in Information Retrieval, Dublin Ireland: ACM, pp. 242-247, 1994.
References
[1] Chen, V. Reynolds, C.R, "Performance of similarity measures in 2 D fragment-based similarity searching: comparison of structural descriptors and similarity coefficients",Journal of ChemicaII'!formation Computer Sciences,Vol 42,ppI407-1414, 2003.
[2] Willet , P., "Textual and chemical information processing: different domains but similar algorithms", Information Research, Vol 5 No I, 1999.
Table 7. Result analySIS of Imttal enhancement and Average number of actives at top 5% for MDDR database
In Table 6, it can be seen that in the fusion experiment, the BIR model still exceeds the BD model. Again the results suggest that query fusion here gives poorer results compared to unfused query.
5% to% 15% 20% 25% 30%
BIR (no
50.70 55.16 59.27 61.57 61.79 61.07
query fusion OD
(no
10.31 11.26 13.08 14.88 16.81 18.74
query fusion) BIR
(query 42.22 54.87 58.81 59.53 59.79 60.02
fusion) OD
(query 8.72 9.21 11.63 13.31 15.32 16.83
Fusion)
Average
I
Initial number of
I
enhancement actives at top 5%
BIR (no query
fusion)(MDDR) 438 155
BO (no query
fusion)(MoDR) 2489 29
BIR (query
fusion)(MDOR) 509 143
BD(query
Fusion)(MDOR) 3021 23
IEEE Transactions on Infonnation Theory, 14(3): pp.
462-467, 1968.
[9] Salim, N. and Godfrey, W.W.P. "Effectiveness of Probability Models for Compound Similarity Searching",
Journal ofAdvancing Infonnation and Management Studies, Special Issue on ICT in Health, Medicine and
Biology, accepted.
[10] Salim, N, Analysis and Comparison of Molecular Similarity Measures, University of Sheffield: Ph. D
Thesis, 2002.