United States Department of Agriculture Forest Service
Southern Research Station
General Technical Report SRS-167
Forest Health Monitoring:
2009 National Technical Report
DISCLAIMER
The use of trade or firm names in this publication is for reader information and
does not imply endorsement by the U.S. Department of Agriculture of any
product or service.
November 2012
Southern Research Station
200 W.T. Weaver Blvd. Asheville, NC 28804
www.srs.fs.usda.gov
Front cover map: Bailey’s ecoregion provinces and ecoregion sections for the conterminous United States (Cleland and others 2007) and for
Alaska (Nowacki and Brock 1995).
Back cover map: Forest cover (green) backdrop derived from Moderate Resolution Imaging Spectroradiometer (MODIS) satellite imagery
9
Chapter 1.
Introduction
Kevin M. Potter
F
orests cover a vast area of the United States: 303.1 million ha or approximately one-third of the Nation’s land (Smith and others 2004). These forests are of substantial ecological, economic, and social importance. Both their ecological integrity and their continued capacity to provide goods and services are of considerable concern in the face of a long list of threats, including insect and disease infestation, fragmentation, catastrophic fire, invasive species, and the effects of global climate change.Assessing and monitoring the health of these forests is a critical and challenging task. While there is no universally accepted definition of forest health, the current understanding of ecosystem dynamics suggests that evaluations of forest health should emphasize factors that affect the inherent processes and resilience of forests (Raffa and others 2009). Consistent with this understanding, Kolb and others (1994) listed four characteristics that a healthy forest ecosystem is likely to possess:
• The physical environment, biotic resources, and energy consumption networks to support productive forests during at least some successional stages.
• Resistance to catastrophic change or the ability to recover from catastrophic change at the landscape level.
• A functional equilibrium between supply and demand of essential resources (water, nutrients, light, growing space) for major portions of the vegetation.
• A diversity of seral stages and stand structures that provide habitat for many native species and all essential ecosystem processes. This annual national technical report on the health of the forests of the United States is produced by the Forest Health Monitoring Program (FHM) of the Forest Service, U.S. Department of Agriculture, with three specific objectives. The first is to present information about forest health from a national perspective, or from a multi-State regional perspective when appropriate, using data collected by the Forest Health Protection (FHP) and Forest Inventory and Analysis (FIA) programs of the Forest Service, as well as data from other sources. The first section of the report achieves this objective, with results stemming from the ongoing
Forest H
ealth M
onitoring
10
SECTION 1
Chapter 1
The second objective of the report is to present new techniques for analyzing forest health data as well as new applications of established techniques. Examples in this report are chapter 5, which presents metrics quantifying the invasiveness of nonnative forest tree species and the large-scale potential for ecological impacts on forest communities by nonnative tree species; chapter 10, which describes a newly developed drought index methodology that allows for the comparison of moisture conditions between geographical areas and across periods of time; and chapters 4 and 9, which use a geographical information system (GIS) hot spot analysis to detect significant clusters of forest mortality and defoliation as well as significant clusters of forest fire occurrences.
The third objective of the report, addressed in the second section, is to present results of recently completed evaluation monitoring (EM) projects funded through the FHM national program. These projects determine the extent, severity, and causes of forest health problems (FHM 2009), generally at a finer scale than that addressed by the analyses in the first section of the report. Each chapter in the second section of the report contains an overview of the EM project, key results, and contacts for more information.
Organization of the Report
The Forest Service has adopted the Santiago Declaration and accompanying Criteria and Indicators for the Conservation and Sustainable Management of Temperate and Boreal Forests (Montréal Process Working Group 2007) as a forest sustainability assessment framework (Smith and others 2001, USDA Forest Service 2004). The seven criteria are:
Criterion 1—Conservation of biological diversity Criterion 2—Maintenance of productive capacity of forest ecosystems
Criterion 3—Maintenance of forest ecosystem health and vitality
Criterion 4—Conservation and maintenance of soil and water resources
Criterion 5—Maintenance of forest contribution to global carbon cycles
Criterion 6—Maintenance and enhancement of long-term multiple socio-economic benefits to meet the needs of societies
Criterion 7—Legal, institutional, and economic framework for forest conservation and
11
Chapter 2 addresses Criterion 1,
conservation of biological diversity. The rest of the first section of this report is limited to assessments relating to Criterion 3, maintenance of forest ecosystem health and vitality,
specifically Indicator 15, which quantifies the area and percent of forest affected by biotic agents beyond reference conditions (chapters 3, 4, 5, 6, and 7), and Indicator 16, which quantifies the area and percent of forest affected by abiotic agents beyond reference conditions (chapters 8, 9, and 10).
When appropriate throughout this report, authors use Bailey’s revised ecoregion provinces and sections (Cleland and others 2007) as a common ecologically based spatial framework for their forest health assessments (fig. 1.1). Specifically, when the spatial scale of the data and the expectation of an identifiable pattern in the data are appropriate, authors use ecoregion sections as assessment units for their analyses. In Bailey’s hierarchical system, the two broadest ecoregion scales, domains and divisions, are based on large ecological climate zones, while each division is broken into provinces based on vegetation macrofeatures (Bailey 1995). Provinces are further divided into sections, which may be thousands of km2 in extent and are expected to encompass regions similar in their geology, climate, soils, potential natural vegetation, and potential natural communities (Cleland and others 1997).
Data Sources
Forest Service data sources included in this report are FIA annualized phase 2 survey data, FHP insect and disease survey forest mortality and defoliation data (1997–2008), Moderate Resolution Imaging Spectroradiometer (MODIS) Active Fire Detections for the United States database (2001–08), and forest cover data developed from MODIS satellite imagery by the U.S. Forest Service Remote Sensing Applications Center.
Forest H
ealth M
onitoring
12
SECTION 1
Chapter 1
13
Western ecoregion provincesEastern ecoregion provinces
Adirondack—New England Mixed Forest—Coniferous Forest—Alpine Meadow (M211) Central Appalachian Broadleaf Forest—Coniferous Forest—Meadow (M221) Central Interior Broadleaf Forest (223)
Eastern Broadleaf Forest (221) Everglades (411)
Laurentian Mixed Forest (212) Lower Mississippi Riverine Forest (234) Midwest Broadleaf Forest (222) Northeastern Mixed Forest (211) Ouachita Mixed Forest—Meadow (M231) Outer Coastal Plain Mixed Forest (232) Ozark Broadleaf Forest (M223) Prairie Parkland (Subtropical) (255) Prairie Parkland (Temperate) (251) Southeastern Mixed Forest (231)
American Semi-Desert and Desert (322)
Arizona—New Mexico Mountains Semi-Desert—Open Woodland—Coniferous Forest—Alpine Meadow (M313) Black Hills Coniferous Forest (M334)
California Coastal Chapparal Forest and Shrub (261)
California Coastal Range Open Woodland—Shrub—Coniferous Forest—Meadow (M262) California Coastal Steppe—Mixed Forest—Redwood Forest (263)
California Dry Steppe (262)
Cascade Mixed Forest—Coniferous Forest—Alpine Meadow (M242) Chihuahuan Semi-Desert (321)
Colorado Plateau Semi-Desert (313) Great Plains—Palouse Dry Steppe (331) Great Plains Steppe (332)
Intermountain Semi-Desert (342)
Intermountain Semi-Desert and Desert (341)
Middle Rocky Mountain Steppe—Coniferous Forest—Alpine Meadow (M332) Nevada—Utah Mountains Semi-Desert—Coniferous Forest—Alpine Meadow (M341) Northern Rocky Mountains Forest-Steppe—Coniferous Forest—Alpine Meadow (M333) Pacific Lowland Mixed Forest (242)
Sierran Steppe—Mixed Forest—Coniferous Forest—Alpine Meadow (M261)
Southern Rocky Mountain Steppe—Open Woodland—Coniferous Forest—Alpine Meadow (M331) Southwest Plateau and Plains Dry Steppe and Shrub (315)
Forest H
ealth M
onitoring
14
SECTION 1
Chapter 1
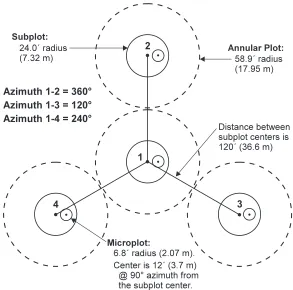
A major source of data for FHM analyses is the FIA program, which collects forest inventory information across all forest land ownerships in the United States. The FIA program maintains a network of more than 125,000 permanent ground plots across the conterminous United States, with a sampling intensity of approximately one plot per 2,428 ha. The FIA program’s phase 2 encompasses the annualized inventory measured on plots at regular intervals, with each plot surveyed every 5 to 7 years in most eastern States, but with plots in the Rocky Mountain and Pacific Northwest regions surveyed once every 10 years (Reams and others 2005). The standard 0.067-ha plot (fig. 1.2) consists of four 7.315-meter radius subplots (approximately 168.6 m2), on which field crews measure trees at least 5 inches in diameter. Within each of these subplots is nested a 2.073-meter radius microplot (approximately 13.48 m2), on which crews measure trees smaller than 5 inches in diameter. A core-optional variant of the standard design includes four “macroplots,” each with radius of 17.953 meters or approximately 0.1012 hectare that originates at the center of each subplot (FIA 2009).
FIA phase 3 plots represent a subset of these phase 2 plots, with one phase 3 plot for every 16 standard phase 2 plots. In addition to traditional forest inventory measurements, data for a variety of important ecological indicators are collected from phase 3 plots, including tree crown condition, lichen communities, down woody material, soil condition, and vegetation
15
structure and diversity. Additionally, data on ozone bioindicator plants are collected on a separate grid of plots. Most of these additional forest health indicators were measured as part of the FHM Detection Monitoring ground plot system prior to 20001 (Palmer and others 1991).
The Forest Health
Monitoring Program
The national FHM Program is designed to determine the status, changes, and trends in indicators of forest condition on an annual basis, and covers all forested lands through a partnership encompassing the Forest Service, State foresters, and other State and Federal agencies and academic groups (FHM 2008). The FHM program utilizes data from a wide variety of data sources, both inside and outside the Forest Service, and develops analytical approaches for addressing forest health issues that affect the sustainability of forest ecosystems. It has five major activities (fig. 1.3):
• Detection Monitoring—nationally
standardized aerial and ground surveys to evaluate status and change in condition of forest ecosystems
1 U.S. Department of Agriculture, Forest Service. 1998.
Forest Health Monitoring 1998 field methods guide. Research Triangle Park, NC: U.S. Department of Agriculture, Forest Service, National Forest Health Monitoring Program. 473 p. On file with: Forest Health Monitoring Program, 3041 Cornwallis Rd., Research Triangle Park, NC 27709.
Forest H
ealth M
onitoring
16
SECTION 1
Chapter 1
• Evaluation Monitoring—projects to determine extent, severity, and causes of undesirable changes in forest health identified through detection monitoring
• Intensive Site Monitoring—projects to enhance understanding of cause-effect relationships by linking detection monitoring to ecosystem process studies and assess specific issues, such as calcium depletion and carbon sequestration, at multiple spatial scales • Research on Monitoring Techniques—work
to develop or improve indicators, monitoring systems, and analytical techniques,
such as urban and riparian forest health monitoring, early detection of invasive species, multivariate analyses of forest health indicators, and spatial scan statistics
• Analysis and Reporting—synthesis of
information from various data sources within and external to the Forest Service to produce issue-driven reports on status and change in forest health at national, regional, and State levels
In addition to its national reporting efforts, the FHM program generates regional and State reports. These reports may be produced with FHM partners, both within the Forest Service and in State forestry and agricultural
departments. Recent examples are Cumming and others (2006, 2007), Keyes and others (2003), Lake and others (2006), Laustsen and others (2003), Morin and others (2006), Neitlich and others (2003), and Steinman (2004). The Forest Health Highlights series, available on the FHM Web site at www.fs.fed.us/foresthealth/ fhm, is produced by the FHM regions in
cooperation with their respective State partners. The FHM program and its partners also produce reports on monitoring techniques and analytical methods, including analyzing forest health data (Smith and Conkling 2004), soils as an indicator of forest health (O’Neill and others 2005), crown-condition classification (Schomaker and others 2007), and sampling and estimation procedures for vegetation diversity and structure (Schulz and others 2009).
For more information, visit the FHM Web site at www.fs.fed.us/foresthealth/fhm. This report is produced by the national FHM research team, part of the Eastern Forest Environmental Threat Assessment Center, which was
17
Literature Cited
Bailey, R.G. 1995. Descriptions of the ecoregions of the United States. 2d ed. Misc. Publ. 1391. Washington, DC: U.S. Department of Agriculture Forest Service. 108 p. Map scale 1:7,500,000.
Cleland, D.T.; Avers, P.E.; McNab, W.H. [and others]. 1997. National hierarchical framework of ecological units. In: Boyce, M.S.; Haney, A., eds. Ecosystem management applications for sustainable forest and wildlife resources. New Haven, CT: Yale University Press: 181-200. Cleland, D.T.; Freeouf, J.A.; Keys, J.E. [and others]. 2007.
Ecological subregions: Sections and subsections for the conterminous United States. Sloan, A.M., tech. ed. Gen. Tech. Rep. WO-76. Washington, DC: U.S. Department of Agriculture Forest Service. [Map, presentation scale 1:3,500,000; Albers equal area projection; colored]. Also on CD-ROM as a GIS coverage in ArcINFO format or at http://fsgeodata.fs.fed.us/other_resources/ecosubregions. html. [Date accessed: March 18, 2011].
Cumming, A.B.; Twardus, D.B.; Smith, W.D. 2006. Maryland and Massachusetts Street Tree Monitoring Pilot Projects. NA-FR-01-06. Newtown Square, PA: U.S. Department of Agriculture Forest Service, Northeastern Area, State and Private Forestry. 23 p. http://na.fs.fed.us/pubs/fhm/street_ trees/md_ma_street_tree_proj_lr.pdf. [Date accessed: March 18, 2011].
Cumming, A.B.; Nowak, D.J.; Twardus, D.B. [and others]. 2007. Urban forests of Wisconsin: pilot monitoring project 2002. NA-FR-05-07. Newtown Square, PA: U.S. Department of Agriculture Forest Service, Northeastern Area State and Private Forestry. 33 p. Available online: Low resolution: http://www.na.fs.fed.us/pubs/fhm/ pilot/pilot_study_wisconsin_02_lr.pdf. High resolution: http://www.na.fs.fed.us/pubs/fhm/pilot/pilot_study_ wisconsin2_02_hr.pdf. [Date accessed: October 19, 2007]. Forest Health Monitoring (FHM). 2003. Forest Health
Monitoring: A National Strategic Plan. http://fhm.fs.fed. us/annc/strategic_plan03.pdf. [Date accessed: August 24, 2011].
Forest Health Monitoring (FHM). 2008. Program description. Forest Health Monitoring Fact Sheet Series. http://www. fhm.fs.fed.us/fact/. [Date accessed: September 3, 2008].
Forest Health Monitoring (FHM). 2009. Evaluation monitoring. Forest Health Monitoring Fact SheetSeries. http://fhm.fs.fed.us/fact/pdf_files/fhm_em_2009.pdf. [Date accessed: December 8, 2009].
Forest Inventory and Analysis (FIA). 2009. The Forest Inventory and Analysis Database: Database Description and Users Manual Version 4.0 for Phase 2 draft (April, 2009). http://www.fia.fs.fed.us/library/database-documentation. [Date accessed: May 1, 2009]. Homer, C.; Dewitz, J.; Fry, J. [and others]. 2007.
Completion of the 2001 National Land Cover Database for the conterminous United States. Photogrammetric Engineering and Remote Sensing. 73: 337–341. Kartesz, J.T. 2009. A synonymized checklist and atlas with
biological attributes for the vascular flora of the United States, Canada, and Greenland. Version 2.0 [CD-ROM]. Chapel Hill, NC: Biota of North America Program, North Carolina Botanical Garden, University of North Carolina. Keyes, C.; Rogers, P.; LaMadeleine, L. [and others]. 2003.
Utah forest health report: a baseline assessment, 1999-2001. Salt Lake City, UT: Utah Dept. of Natural Resources, Division of Forestry, Fire and State Lands. 47 p.
Kolb, T.E.; Wagner, M.R.; Covington, W.W. 1994. Concepts of forest health: Utilitarian and ecosystem perspectives. Journal of Forestry. 92: 10–15.
Lake, M.; Marshall, P.; Mielke, M. [and others]. 2006. National Forest Health Monitoring program monitoring urban forests in Indiana: pilot study 2002, Part 1. Analysis of field methods and data collection. Gen. Tech Rep. NA FR-06-06. Newtown Square, PA: U.S. Department of Agriculture Forest Service, Northeastern Area. http:// www.fhm.fs.fed.us/pubs/ufhm/indianaforests02/
indianaforests02.html. [Date accessed: November 6, 2007]. Laustsen, K.M.; Griffith, D.M.; Steinman, J.R. 2003. Fourth
annual inventory report on Maine’s forests. Newtown Square, PA: U.S. Department of Agriculture Forest Service, Northeastern Research Station and Northeastern Area. 49 p. http://www.maine.gov/doc/mfs/pubs/pdf/ anninv/2002invrpt.pdf. [Date accessed: March 18, 2011]. Montréal Process Working Group. 2007. The Montréal
Forest H
ealth M
onitoring
18
SECTION 1
Chapter 1
Morin, R.S.; Liebhold, A.M.; Gottschalk, K.W. [and others]. 2006. Analysis of Forest Health Monitoring surveys on the Allegheny National Forest (1998-2001). Gen. Tech. Rep. NE-339. Newtown Square, PA: U.S. Department of Agriculture Forest Service, Northeastern Research Station. 102 p. http://www.fs.fed.us/ne/newtown_square/ publications. [Date accessed: November 6, 2007]. Neitlich, P.; Rogers, P.; Rosentretter, R. 2003. Lichen
communities indicator results from Idaho: baseline sampling. Gen. Tech. Rep. RMRS-GTR-103. Fort Collins, CO: U.S. Department of Agriculture Forest Service, Rocky Mountain Research Station. 14 p.
Nowacki, G.; Brock, T. 1995. Ecoregions and Subregions of Alaska, EcoMap. Version 2.0. Juneau, AK: U.S. Department of Agriculture Forest Service, Alaska Region. Map 1:5,000,000; colored.
O’Neill, K.P.; Amacher, M.C.; Perry, C.H. 2005. Soils as an indicator of forest health: a guide to the collection, analysis, and interpretation of soil indicator data in the Forest Inventory and Analysis Program. Gen. Tech. Rep. NC-258. St. Paul, MN: U.S. Department of Agriculture Forest Service, North Central Research Station. 53 p. Palmer, C.J.; Riitters, K.H; Strickland, T. [and others].
1991. Monitoring and research strategy for forests— Environmental Monitoring and Assessment Program (EMAP). EPA 600/4-91/012. Washington, DC: U.S. Environmental Protection Agency, Office of Research and Development. 189 p.
PRISM Group. 2009. 2.5-arcmin (4 km) gridded monthly climate data. ftp://prism.oregonstate.edu//pub/prism/us/ grids. [Date accessed: April 6, 2009].
Radeloff, V.C.; Hammer, R.B.; Stewart, S.I. [and others]. 2005. The wildland-urban interface in the United States. Ecological Applications. 15(3): 799–805.
Raffa, K.F.; Aukema, B.; Bentz, B.J. [and others]. 2009. A literal use of “forest health” safeguards against misuse and misapplication. Journal of Forestry. 107: 276–277. Reams, G.A.; Smith, W.D.; Hansen, M.H. [and others]. 2005.
The Forest Inventory and Analysis sampling frame. In: Bechtold, W.A.; Patterson, P.L., ed. The Enhanced Forest Inventory and Analysis Program—National Sampling Design and Estimation Procedures. Asheville, NC: United States Department of Agriculture Forest Service, Southern Research Station: 11–26.
Schomaker, M.E.; Zarnoch, S.J.; Bechtold, W.A. [and others]. 2007. Crown-condition classification: a guide to data collection and analysis. Gen. Tech. Rep. SRS-102. Asheville, NC: U.S. Department of Agriculture Forest Service, Southern Research Station. 78 p.
Schulz, B.K.; Bechtold, W.A.; Zarnoch, S.J. 2009. Sampling and estimation procedures for the vegetation diversity and structure indicator. Gen. Tech. Rep. PNW-GTR-781. Portland, OR: U.S. Department of Agriculture Forest Service, Pacific Northwest Research Station. 53 p. Smith, W.D.; Conkling, B.L. 2004. Analyzing forest health
data. Gen. Tech. Rep. SRS-077. Asheville, NC: U.S. Department of Agriculture Forest Service, Southern Research Station, 33 p. http://www.srs.fs.usda.gov/pubs/ gtr/gtr_srs077.pdf. [Date accessed: November 6, 2007]. Smith, W.B.; Vissage, J.S.; Darr, D.R.; Sheffield, R.M.
2001. Forest resources of the United States, 1997. Gen. Tech. Rep. NC-219. St. Paul, MN: U.S. Department of Agriculture Forest Service, North Central Research Station. 191 p.
Smith, W.B.; Miles, P.D.; Vissage, J.S.; Pugh, S.A. 2004. Forest resources of the United States, 2002. Gen. Tech. Rep. NC-241. St. Paul, MN: U.S. Department of Agriculture Forest Service, North Central Research Station. 137 p.
Steinman, J. 2004. Forest Health Monitoring in the Northeastern United States: Disturbances and Conditions during 1993-2002. NA-Technical Paper 01-04. Newtown Square, PA: U.S. Department of Agriculture Forest Service, State and Private Forestry, Northeastern Area. 46 p. http:// fhm.fs.fed.us/pubs/tp/dist_cond/dc.shtml. [Date accessed: December 8, 2009].
U.S. Department of Agriculture, Animal and Plant Health Inspection Service (APHIS). 2008. APHIS list of regulated hosts and plants associated with Phytophthora ramorum. http://www.aphis.usda.gov/plant_health/plant_pest_info/ pram/downloads/pdf_files/usdaprlist.pdf. [Date accessed: February 11, 2009].
U.S. Department of Agriculture, Forest Service. 2004. National report on sustainable forests–2003. FS-766. Washington, DC: U.S. Department of Agriculture Forest Service. 139 p.
Potter, Kevin M.; Conkling, Barbara L., eds. 2012. Forest health monitoring: 2009 national technical report. Gen. Tech. Rep. SRS-167. Asheville, NC: U.S. Department of Agriculture Forest Service, Southern Research Station. 252 p.
The annual national technical report of the Forest Health Monitoring Program of the Forest Service, U.S. Department of Agriculture, presents forest health status and trends from a national or multi-State regional perspective using a variety of sources, introduces new techniques for analyzing forest health data, and summarizes results of recently completed Evaluation Monitoring projects funded through the national Forest Health Monitoring program. Landscape pattern assessments are presented for Alaska, Hawaii, and Puerto Rico. Data from detection and monitoring surveys are used to identify trends relating to biotic agents posing forest sustainability concerns. Aerial survey data are used to identify geographic patterns of insect and disease activity. Data from the Forest Inventory and Analysis Program of the Forest Service are used to identify geographic patterns of nonnative tree species occurrence. Forest Inventory and Analysis data from 20 States also are
employed to detect regional differences in tree mortality. A new risk map for Phytophthora ramorum is presented to assist in detection surveys. Quantitative temporal analyses are conducted for five categories of abiotic agents impacting forest health. Satellite data are employed to detect geographic clusters of forest fire occurrence. A new methodology for the comparison of moisture conditions among different geographical areas and time periods is described using multi-year windows. Nine recently completed evaluation monitoring projects are summarized, addressing forest health concerns at smaller scales.
Keywords: Drought, fire, forest health, forest insects and disease, fragmentation, nonnative species, tree mortality.
Scan this code to submit your feedback, or go to www.srs.fs.usda.gov/pubeval