Evaluating Context Selection Strategies to Build Emotive Vector Space Models
Lucia C. Passaro, Alessandro Lenci
CoLing Lab, Dipartimento di Filologia, Letteratura e Linguistica, University of Pisa (Italy) [email protected], [email protected]
Abstract
In this paper we compare different context selection approaches to improve the creation ofEmotiveVector Space Models (VSMs). The system is based on the results of an existing approach that showed the possibility to create and update VSMs by exploiting crowdsourcing and human annotation. Here, we introduce a method to manipulate the contexts of the VSMs under the assumption that the emotive connotation of a target word is a function of both its syntagmatic and paradigmatic association with the various emotions. To study the differences among the proposed spaces and to confirm the reliability of the system, we report on two experiments: in the first one we validated the best candidates extracted from each model, and in the second one we compared the models’ performance on a random sample of target words. Both experiments have been implemented as crowdsourcing tasks.
Keywords:Emotive lexicon, Context selection, Vector Space Models
1.
Introduction
With the proliferating use of social media, textual emotion analysis is becoming increasingly important. Emotion de-tection can be useful in several applications: for instance, in Customer Relationship Management (CRM) it can be used to track sentiments towards companies and their services, products or others target entities. In Government Intelli-gence, it can be used to collect people’s emotions and points of views about government decisions.
Emotion lexica, in which lemmas are associated to the emo-tions they evoke, are knowledge sources that can help the development of detection algorithms and prediction sys-tems. In recent years great attention has been given to sen-timent polarity recognition, but a new trend is leading to the development of novel methods to automatically clas-sify the emotions expressed in an opinionated piece of text (Turney and Littman, 2003; Pang and Lee, 2008; Liu, 2012; Liu, 2015) as well as to the building of annotated lexical resources like SentiWordNet (Esuli and Sebastiani, 2006; Das and Bandyopadhyay, 2010), WordNet Affect (Strappa-rava and Valitutti, 2004) or EmoLex (Mohammad and Tur-ney, 2013).
One major bottleneck of research on emotion detection is the lack of emotive resources. This problem is even more pressing for Italian. In Passaro et al. (2015) we proposed a language-independent distributional semantic method to semi-automatically build an emotive lexicon starting from a small number of seed terms and by exploiting crowd-sourcing methods. The output of this methodology is ItEM (Italian EMotive lexicon), a high-coverage emotion lexi-con for Italian. As a follow-up study, in this paper we compare different context selection approaches to improve emotive VSMs by exploiting the syntagmatic and paradig-matic properties of the target words.
Distributional semantics is grounded on Harris’s distribu-tional hypothesis (Harris, 1954), which states that semanti-cally similar words tend to appear in similar contexts. From a computational point of view, each word is represented by a weighted feature vector, where features correspond to other words that co-occur with the target word in the surrounding context (Turney and Pantel, 2010; Baroni and
Lenci, 2010).
In order to build ItEM, we exploited the distributional hy-pothesis, which we have generalized to emotions:
A wordhwiis strongly associated with an emotionheiif it co-occurs in similar contexts of other words strongly associated withhei.
In order to implement this hypothesis, we represented each emotion as a centroid vector built starting from a set of seed words strongly associated to the target emotion and we measured the paradigmatic similarity between the word and the emotion. Besides co-occurring in similar contexts, words with the same (or similar) emotive connotation also tend to occur together. For this reason, in a second version of ItEM, we have introduced a “syntagmatic boost” to pro-mote the most informative contexts of each emotion. We have organized this paper as follows: In section 2, we present ItEM, which is the starting point of this paper. In section 3 we describe two alternative models based on con-text selection approaches. In section 4 we illustrate the strategies used to evaluate itEM and in section 5 we report the results. In order to evaluate the reliability of the sys-tem, in addition to comparing the best candidates extracted by the various models, we present a test performed on a dataset built with a random sample of target words.
2.
itEM: an Italian emotive lexicon
ItEM (Passaro et al., 2015) is an emotive lexicon for Italian, in which each target term is associated with a score quantifying its association with each emotion in the Plutchik (1994)’s taxonomy: JOY, SADNESS, ANGER,FEAR, TRUST, DISGUST, SURPRISE ANDANTICIPATION.
ItEM is not only a static lexicon, since it also provides a dynamic method to continuously update the emotive value of words, as well as to increment its coverage. ItEM has been built in a three stage process:
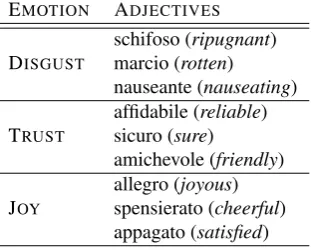
highly associated to one or more Plutchik’s basic emo-tions. To address this issue, 60 Italian native speak-ers of different age groups, levels of education, and backgrounds were asked to list, for each emotion, 5 lemmas for each of our Parts-of-Speech (PoS) of in-terest (Nouns, Adjectives and Verbs). The output of this phase is a lexicon of 347 seed lemmas which we enriched with the names of the emotions such as the nouns “gioia” (joy) or “rabbia” (anger) and their syn-onyms attested in WordNet (Fellbaum, 1998), Word-Net Affect (Strapparava and Valitutti, 2004) and Trec-cani Online Dictionary (www.trecTrec-cani.it/vocabolario). Table 1 shows the most frequent (i. e. the number of elicitations) adjectives for the emotions DISGUST, TRUSTand JOY.
EMOTION ADJECTIVES
schifoso (ripugnant)
DISGUST marcio (rotten)
nauseante (nauseating) affidabile (reliable) TRUST sicuro (sure)
amichevole (friendly) allegro (joyous) JOY spensierato (cheerful)
appagato (satisfied)
Table 1: Sample of seed lemmas
Distributional expansion: We exploited distributional semantic methods to expand the seeds collected in the first phase and populate ItEM. We extracted from La Repubblica corpus(Baroni et al., 2004) and itWaC (Baroni et al., 2009), the list of the 30,000 most frequent nouns, verbs and adjectives, which were used as targets and contexts in a co-occurrence matrix collected using a five-word window centered on the target lemma. For each hemotion, PoSi pair, we built a centroid vector from the vectors of the seeds belonging to that emotion and PoS, obtaining in total 24 centroids.
We re-weighted the co-occurrence matrix using the Pointwise Mutual Information (Church and Hanks, 1990), and in particular the Positive PMI (PPMI), in which negative scores are changed to zero (Niwa and Nitta, 1994). To optimize the vector space, we followed the approach in (Polajnar and Clark, 2014) and we selected the top 240 contexts for each target word.
As a last step, we applied singular value decomposi-tion (SVD), reducing the matrix to 300 dimensions. The VSM allowed us to calculate our emotive scores by measuring the cosine similarity between the target lemmas and the centroid vectors: depending on the PoS of the target lemma, we measured the cosine similarity between the lemma and the eight emotive centroids corresponding to the target PoS.
Evaluation and update: We used a two-step crowd-sourcing approach: first, for eachhemotion, PoSipair we ranked the target words with respect to their cosine similarity with the corresponding emotive centroid. We then selected the top 50 words for each centroid and we collected human ratings about the association of the target with each emotion: Given a target word hwi, for each Plutchik’s emotionhei, three annotators were asked to answer the question “How much ishwi associated with the emotion hei?”. The annotators rated words on a Likert scale ranging from 1 (not associated) to 5 (highly associated). Since words are often associated with more than one emotion, we calculated a distinctiveness score in order to estimate the average degree of association between a word and each emotion.
After ranking the words according to this emotive score, we selected the top 10 distinctive nouns, adjectives and verbs for each hemotion, PoSi pair, in order to further expand the set of the seeds used to build the distributional space. In (Passaro et al., 2015) we showed that the process of stepwise seed expansion used to calculate the emotive centroids may be repeated several times, in order to optimize the system and improve its performance.
3.
Context selection
Another important leverage for optimizing the emotive VSMs is context selection. As an element of novelty with respect to Passaro et al. (2015), we have introduced a method to refine the contexts used to measure the distribu-tional emotive score of the target word under the assump-tion that the emotive connotaassump-tion of a target word is a func-tion of both the paradigmatic similarity between the word and the emotive centroids, and of the syntagmatic associa-tions between the target word and the top neighbors of emo-tion seeds. In this way, we obtained two filtered VSMs. For each word-emotion pairhw,Ei, we calculated a syntag-matic emotive score (SintScore) based on the association measure (AM) such as the PPMI betweenhwiand the seeds ofhEi:
SintScore= X
seed∈EMOTION
AM(w, seedEMOTION) (1)
SintParModel: In this model, we restricted the contexts to the words with a sufficiently high cosine similar-ity with the emotive centroid vectors and a sufficiently high syntagmatic emotive score. In particular, we se-lected the contexts having, at least for one emotion:
CSim∗SintScore >1 (2)
where
CSim(−→w ,−−−−−−→EMOTION) =
−
→w∗−−−−−−→E
MOTION
k−→wkk−−−−−−→EMOTIONk
(3)
Top1000EmoPos: In this second model we followed the algorithm proposed in Zhitomirsky-Geffet and Da-gan (2009) to bootstrap the emotive contexts start-ing from a standard approximation of the similarity space. In particular, we adapted their “Bootstrapped Feature Weight” (BFW) to capture both syntagmatic and paradigmatic properties of the words.
BF W(w, f) = X
v∈WS(f)∩N(w)
SIM(w, v) (4)
The authors demonstrated that the definition of a boot-strapping scheme assures improved feature weights, and hence higher quality feature vectors. We applied their scheme in two steps: in the first one we promoted the most important contexts for each word, and in the second one we generalized the intuition to emotions, by defining a sort of emotion neighborhood, as the top 1000 words for each of them. In the experiments below, we defined WS(f) as the set of words having a positive PMI withf (i.e., the words for whichf is an active feature) and N(w) as the set of the wordsv
having a cosine similarity (SIM) withwgreater than
0.2, which is an empirically fixed threshold (i.e., the semantic neighbourhood ofw). Once the bootstrapped weights have been computed, we calculated a new the syntagmatic emotive score according to the formula (1), using the BFW as association measure.
Starting from these new weights, we ranked the contexts according to these values and we restricted the contexts of the matrix to the top 1,000 nouns, adjectives and verbs for each emotion. Globally, we selected 15,116 distinct contexts (some of them in the Top 1000 of more than one emotion), and we applied SVD reducing the matrix to 300 dimensions.
4.
Evaluation
In this section we compare the two filtered VSMs above (SintParModel and Top1000EmoPos) with respect to the first version of ItEM (henceforth ParModel). To study the differences among the spaces, we performed two different experiments carried out by setting up crowdsourcing tasks on the Crowdflower (CF) platform (http://www.crowdflower.com). In the first one we repeated the evaluation on the top 50 nouns, adjectives and verbs extracted from the three VSMs as in Passaro et al. (2015), by measuring the Precision at a particular rank (P@K). In the second experiment, we compared the models’ perfor-mance on a random set of words, including also possibly neutral words, associated with human ratings about their association or lack of association with emotions. In this case, we measured Precision, Recall and F1-score. The metric used to compare the models is the F1-score at different values of K (F1@K).
In both the experiments, we employedcompetition ranking
so that items that compare with equal CF score receive the same ranking number, and a gap is left in the ranking numbers. For example, if A ranks ahead of B and C (which compare equal) which are both ranked ahead of D, then A
gets ranking number 1, B and C get ranking number 2 and D gets ranking number 4.
4.1.
Precision@K
Precision has been calculated by comparing the vector space model’s candidates against the annotation obtained with crowdsourcing. For each hemotion, PoSi pair we ranked the target words with respect to their cosine sim-ilarity with the corresponding emotive centroid. We then selected the topk words for each centroid and we asked the annotators to provide an emotive score for the selected words. In this experiment, True positives (TP) are the words found among the top kneighbours for a particular emotion and PoS, for which the annotators provided a av-erage association score greater than 3 and False positives (FP) are the words found in the topknouns, adjectives and verbs, but for which the aggregate evaluation of the anno-tators is equal or lower than 3.
4.2.
Performance on a random sample (F1-score)
In the second experiment, we compared the models on a sample of words selected randomly from the most 30,000 frequent targets extracted from itWac (Baroni et al., 2009) and la Repubblica (Baroni et al., 2004), according to the following strategy: We divided the list of the 30.000 target into 30 frequency ranges, and from each of them we se-lected randomly 39 words (13 nouns, 13 adjectives and 13 verbs), for a total of 1170 items.
To obtain highly reliable emotive ratings, we increased the number of annotators. Given a target wordhwi, for each Plutchik’s emotionhei(plus the neutral one), 20 annotators were asked to select the emotions expressed byhwiusing a multi-selection button. Besides the eight emotions, a null option was available in casehwiwas considered emotion-ally neutral.
For each annotated word, CF provides a confidence score describing the level of agreement between multiple raters. The aggregate answer returned by CF is the majority vote, weighted by each contributors’ trust scores. The aggre-gate answer is chosen by considering the response with the greatest confidence.
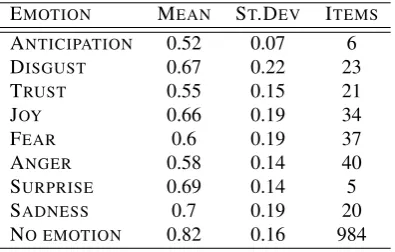
In Table 2, we report the levels of agreement (mean and standard deviation per emotion) and the number of words for which the aggregate answer corresponds to the target emotion. The last row lists the values for the neutral words.
EMOTION MEAN ST.DEV ITEMS
ANTICIPATION 0.52 0.07 6
DISGUST 0.67 0.22 23
TRUST 0.55 0.15 21
JOY 0.66 0.19 34
FEAR 0.6 0.19 37
ANGER 0.58 0.14 40
SURPRISE 0.69 0.14 5
SADNESS 0.7 0.19 20
NO EMOTION 0.82 0.16 984
In Table 3 we report on the distribution of the CF scores in the random sample. High (CF score) is assigned to the words receiving more than 10 ratings for the target emotion (plus the neutral one). Medium is assigned to the words receiving between 5 and 10 ratings, Low is assigned to the words receiving between 1 and 4 ratings and Zero to the others.
EMOTION HIGH MEDIUM LOW ZERO
ANTICIPATION 3 28 303 836
DISGUST 17 31 153 969
TRUST 11 67 305 787
JOY 23 49 255 843
FEAR 23 76 215 856
ANGER 21 56 214 879
SURPRISE 4 12 179 975
SADNESS 15 23 210 922
NO EMOTION 923 152 72 23
Table 3: Distribution of CF scores in the random sample
To compute Precision, Recall and F1, given a hemotion, word-PoSipair, we used a fixed threshold on the number of CF raters and a variable threshold on the cosine similarity (Table 4). In particular, we sorted the candidates according to their cosine similarity for eachhemotion, PoSipair, and the threshold was fixed at the 3rdquartile for each group.
CFSCORE COSINESIMILARITY DEFINITION
>5 > 3rdQuartile True Positive <=5 > 3rdQuartile False Positive
>5 <= 3rdQuartile False Negative <=5 <= 3rdQuartile True Negative
Table 4: Gold Standard entries
5.
Results and discussion
With regard to the Precision@K on the top candidates and F1-score@K on the random sample (cf. Table??and Ta-ble??), most of the emotions seem to take advantage from the context selection, but, at the same time, the different results prompt us to further investigate the quality of the seeds representing emotions. For example, for the emotions
JOY, DISGUSTSADNESSand SURPRISEcontext selection
seems to improve their performance on the top K candi-dates, but such an improvement is not found in the random sample. These effects could be due to the fact that in our feature elicitation experimentANGERterms tend also to be associated withDISGUSTand manyJOYterms are also as-sociated with TRUST andSURPRISE. In other words, the distinctiveness of the seeds impacts on the final results, but the effect is more evident if we consider a random sample of words which includes emotive words with a moderate in-tensity. In addition, we would like to stress that by consid-ering top 50 neighbours, the filtered models reach a higher precision level for all the emotion (except the ANTICIPA
-TION).
Moving to the results by PoS (cf. Table ?? and Table
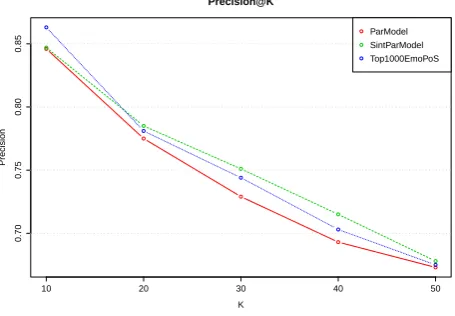
??), though for adjectives the best model is the complete one (ParModel), verbs and nouns are better represented by the filtered models (SintParModel and Top1000EmoPoS). Globally, the filtered models show a more “graceful degra-dation” of precision when K increases and reach their high-est performance with the top 30 neighbours. For example, the precision on the top 30 neighbours raises by 0.4 percent in the case of nouns, and it raises by 0.6 percent in the case of verbs. The same trend (though less pronounced) is ob-served if we consider the F1-score on the random sample.
10 20 30 40 50
0.70
0.75
0.80
0.85
Precision@K
K
Precision
ParModel SintParModel Top1000EmoPoS
Figure 1: Precision@k aggregated by VSM
To see some examples of the candidate emotive words extracted with ItEM, Table 5 shows the top three verbs extracted using the SintParModel for the emotions JOY,
ANGER, SADNESSand FEAR.
EMOTION VERBS COS.SIM.
esultare (to exult) 0.66
JOY applaudire (to applaud) 0.65
eccitare (to excite) 0.62
infuriare (to make angry) 0.68
ANGER inferocire (to enrage) 0.61
indignare (to make indignant) 0.61 deludere (to disappoint) 0.80
SADNESS deprimere (to demoralize) 0.79
amareggiare (to embitter) 0.77 spaventare (to frighten) 0.78
FEAR terrorizzare (to scare) 0.75
impaurire (to scare) 0.73
Table 9: Sample of extracted verbs
10 20 30 40 50
0.45
0.50
0.55
0.60
0.65
0.70
0.75
F1−score@K
K
Precision
ParModel SintParModel Top1000EmoPoS
Figure 2: F1-score@k aggregated by VSM
improvement is not balanced with respect to the emotions. In fact the emotions JOY, DISGUSTSADNESS and SUR
-PRISEreach a higher F1-score in the full model. Thus, a
fu-ture optimization might try to combine different approaches for the various emotions.
6.
Conclusions and ongoing work
We compared different context selection approaches to improve the creation of Emotive Vector Space Models (VSM). We started from the assumption that the emotive connotation of a target word is a function of both its syntagmatic and paradigmatic association with the various emotions.First of all, we believe that this work demonstrates the scalability and reliability of ItEM, which represents a methodology that can be very useful for languages that lack lexical resources for emotion detection.
The results in this study convinced us that different context selection strategies based on syntagmatic and paradigmatic characteristics of the words can be used to improve the performance of the models. In the near future we plan to refine the process of seed and context selection in order to identify the optimal parameter setting for each part of speech and emotion.
7.
Bibliographical References
Baroni, M. and Lenci, A. (2010). Distributional memory: A general framework for corpus-based semantics. Com-putational Linguistics, 36(4):673–721.
Baroni, M., Bernardini, S., Comastri, F., Piccioni, L., Volpi, A., Aston, G., and Mazzoleni, M. (2004). Introduc-ing the La Repubblica Corpus: A Large, Annotated, TEI(XML)-Compliant Corpus of Newspaper Italian. In
Proceedings of the 4th International Conference on Language Resources and Evaluation (LREC’04), pages 1171–1174, Lisbon - Portugal, may. European Language Resource Association (ELRA).
Baroni, M., Bernardini, S., Ferraresi, A., and Zanchetta, E. (2009). The wacky wide web: A collection of very large linguistically processed web-crawled corpora. Language Resources and Evaluation, 43(3):209–222.
Das, A. and Bandyopadhyay, S. (2010). Towards the Global SentiWordNet. InProceedings of the 24th Pacific Asia Conference on Language, Information and Compu-tation, pages 799–808, Sendai - Japan, november. Esuli, A. and Sebastiani, F. (2006). Sentiwordnet: A
pub-licly available lexical resource for opinion mining. In
Proceedings of the 5th International Conference on Lan-guage Resources and Evaluation, pages 417–422, Genoa - Italy, may. European Language Resource Association (ELRA).
C. Fellbaum, editor. (1998). WordNet : an electronic lex-ical database. Language, speech, and communication. MIT Press, Cambridge (Mass.).
Harris, Z. (1954). Distributional structure. Word, 10 (2-3):1456–1162.
Liu, B. (2012). Sentiment Analysis and Opinion Mining. Morgan & Claypool Publishers.
Liu, B. (2015). Sentiment Analysis: mining opinions, sen-timents, and emotions. Cambridge Univ. Press.
Mohammad, S. M. and Turney, P. D. (2013). Crowdsourc-ing a word-emotion association lexicon. Computational Intelligence, 29 (3):436–465.
Niwa, Y. and Nitta, Y. (1994). Co-occurrence vectors from corpora vs. distance vectors from dictionaries. In Pro-ceedings of the 15th International Conference On Com-putational Linguistics, pages 304–309, Kyoto - Japan. Pang, B. and Lee, L. (2008). Opinion mining and
senti-ment analysis. Foundations and trends in Information Retrieval, 2 (1-2):1–135.
Passaro, L. C., Pollacci, L., and Lenci, A. (2015). Item: A vector space model to bootstrap an italian emotive lex-icon. In Proceedings of the second Italian Conference on Computational Linguistics CLiC-it 2015, pages 215– 220, Trento - Italy.
Plutchik, R. (1994). The psychology and biology of emo-tion. Harper Collins.
Plutchik, R. (2001). The nature of emotions. American Scientist, 89:344–350.
Polajnar, T. and Clark, S. (2014). Improving distributional semantic vectors through context selection and normal-isation. In Proceedings of the 14th Conference of the European Chapter of the Association for Computational Linguistics (EACL 2014), pages 230–238, Gothenburg -Sweden.
Strapparava, C. and Valitutti, A. (2004). Wordnet-affect: an affective extension of wordnet. In Proceedings of the 4th International Conference on Language Resources and Evaluation, pages 1083–1086, Lisbon - Portu-gal, may. European Language Resource Association (ELRA).
Turney, P. D. and Littman, M. (2003). Measuring praise and criticism: Inference of semantic orientation from as-sociation.ACM Transactions on Information Systems. Turney, P. D. and Pantel, P. (2010). From frequency to
meaning: vector space models for semantics. Journal of Artificial Intelligence Research, 37:141–188.
EMOTION MODEL P@10 P@20 P@30 P@40 P@50
ParModel 0.7 0.6 0.589 0.542 0.533
ANTICIPATION SintParModel 0.704 0.684 0.552 0.487 0.469
Top1000EmoPoS 0.8 0.633 0.578 0.5 0.487
ParModel 0.9 0.833 0.744 0.675 0.647
DISGUST SintParModel 0.926 0.807 0.759 0.684 0.626
Top1000EmoPoS 0.967 0.817 0.733 0.708 0.653
ParModel 0.533 0.5 0.478 0.483 0.507
TRUST SintParModel 0.519 0.509 0.552 0.564 0.537
Top1000EmoPoS 0.5 0.467 0.478 0.483 0.48
ParModel 0.933 0.9 0.867 0.833 0.78
JOY SintParModel 0.963 0.912 0.908 0.889 0.844
Top1000EmoPoS 0.933 0.9 0.911 0.883 0.847
ParModel 0.867 0.833 0.8 0.75 0.733
FEAR SintParModel 0.926 0.825 0.793 0.778 0.741
Top1000EmoPoS 0.9 0.883 0.8 0.75 0.733
ParModel 0.967 0.867 0.822 0.825 0.82
ANGER SintParModel 0.963 0.895 0.885 0.821 0.782
Top1000EmoPoS 0.933 0.9 0.878 0.842 0.8
ParModel 0.867 0.717 0.633 0.6 0.567
SURPRISE SintParModel 0.852 0.719 0.655 0.624 0.592
Top1000EmoPoS 0.9 0.717 0.678 0.617 0.573
ParModel 1 0.95 0.9 0.833 0.793
SADNESS SintParModel 0.926 0.93 0.908 0.872 0.83
Top1000EmoPoS 0.967 0.933 0.9 0.842 0.827
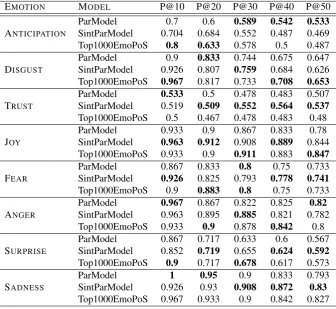
Table 5: Precision@k aggregated by emotion and VSM
MODEL POS P@10 P@20 P@30 P@40 P@50
ParModel 0.9 0.8 0.796 0.763 0.733
ADJECTIVES SintParModel 0.847 0.809 0.767 0.756 0.712
Top1000EmoPoS 0.875 0.825 0.792 0.747 0.728
ParModel 0.788 0.769 0.717 0.669 0.658
NOUNS SintParModel 0.861 0.789 0.754 0.728 0.689
Top1000EmoPoS 0.85 0.756 0.733 0.697 0.675
ParModel 0.85 0.756 0.675 0.647 0.628
VERBS SintParModel 0.833 0.757 0.733 0.66 0.633
Top1000EmoPoS 0.863 0.763 0.708 0.666 0.623
EMOTION MODEL F1@10 F1@20 F1@30 F1@40 F1@50
ParModel 0.433 0.275 0.218 0.169 0.148
ANTICIPATION SintParModel 0.662 0.413 0.304 0.257 0.218
top1000EMOPOS 0.562 0.361 0.265 0.216 0.186
ParModel 0.843 0.661 0.541 0.447 0.402
DISGUST SintParModel 0.817 0.635 0.504 0.413 0.373
top1000EMOPOS 0.817 0.639 0.506 0.414 0.371
ParModel 0.73 0.663 0.546 0.515 0.503
TRUST SintParModel 0.79 0.707 0.556 0.526 0.505
top1000EMOPOS 0.752 0.684 0.561 0.526 0.51
ParModel 0.908 0.811 0.713 0.655 0.627
JOY SintParModel 0.888 0.802 0.695 0.623 0.593
top1000EMOPOS 0.888 0.802 0.695 0.623 0.596
ParModel 0.856 0.804 0.765 0.682 0.663
FEAR SintParModel 0.877 0.815 0.786 0.7 0.673
top1000EMOPOS 0.877 0.815 0.78 0.696 0.669
ParModel 0.945 0.853 0.731 0.629 0.61
ANGER SintParModel 0.945 0.862 0.74 0.637 0.618
top1000EMOPOS 0.945 0.862 0.739 0.634 0.615
ParModel 0.572 0.271 0.175 0.175 0.175
SURPRISE SintParModel 0.572 0.251 0.158 0.158 0.158
top1000EMOPOS 0.572 0.259 0.163 0.163 0.163
ParModel 0.728 0.557 0.42 0.397 0.358
SADNESS SintParModel 0.728 0.557 0.409 0.386 0.347
top1000EMOPOS 0.713 0.551 0.402 0.377 0.338
Table 7: F1-score@k aggregated by Emotion and VSM
MODEL POS F1@10 F1@20 F1@30 F1@40 F1@50
ParModel 0.842 0.699 0.6 0.522 0.506
ADJECTIVES SintParModel 0.835 0.686 0.593 0.516 0.501
top1000EMOPOS 0.835 0.689 0.59 0.511 0.495
ParModel 0.685 0.511 0.429 0.377 0.368
NOUNS SintParModel 0.727 0.534 0.441 0.387 0.367
top1000EMOPOS 0.703 0.519 0.433 0.378 0.362
ParModel 0.728 0.627 0.513 0.476 0.434
VERBS SintParModel 0.793 0.672 0.523 0.485 0.438
top1000EMOPOS 0.759 0.657 0.519 0.48 0.436