Department of Civil Engineering, North Eastern Regional Institute of Science and Technology, Nirjuli, Itanagar, Arunachal Pradesh, India.
Copyright to IJIRSET www.ijirset.com 194
Damage Identification using SAFT Algorithm
Needhi Kotoky1, Shivang Shekhar2
PhD student, Dept. of Civil Engineering, IIT Guwahati, Guwahati, Assam, India 1
MTech student, Dept. of Earthquake Engineering, IIT Roorkee, Roorkee, Utarakhand, India2
Abstract: For the detection of defects and the characterization of materials in concrete ultrasonic testing is an established nondestructive technique. Reconstruction by the synthetic aperture focusing technique (SAFT) is used in ultrasonic testing as it offers a general solution to the difficulties encountered while testing. SAFT algorithm creates a high-resolution image by numerically superimposing pulse-echo signals measured at several positions. Signals are focused in the image to every image point, and structural noise is suppressed by spatial superposition. Hence, a large virtual transducer with variable focus is synthesized. A synthetic aperture imitates a transducer by sampling its area at many points, either by an array of transducers measuring simultaneously, or by a single transducer approaching the aperture points in succession. In this paper, a diagnostic tool for detection and assessment of reflectors for automated large area nondestructive inspection of concrete structures using one-dimensional array is described to overcome limitations of point-by-point inspection technique. The apertures considered in this paper are planar and circular.
Keywords—Imaging technique, Signals, Synthetic
aperture focusing technique, Ultrasonic testing,
Wavelet transform
I. INTRODUCTION
The classical tasks of ultrasonic NDT are detection, sizing and characterisation of structural discontinuities such as cracks, lack of fusion in welds, inclusions of foreign material or de-laminations. In ultrasonic testing the detection is important, nevertheless the characterisation and
sizing are necessary for the acceptance of detected defects. The more exact characterization of the defect gives information for discrimination of defects with regard to volume or planar defects and allows to interpret if the signal is a false call or not.
are thus not appropriate for the pulse-echo technique. To apply the pulse-echo technique, it was necessary to develop transducers of sufficiently short impulse response, and to provide a way to reduce structural noise.
Reconstruction by the synthetic aperture focusing technique (SAFT) offers a general solution to these difficulties. SAFT algorithm numerically superimposes pulse-echo signals measured at several positions, thus creating a high-resolution image.
II. SYNTHETIC APERTURE FOCUSSING
TECHNIQUE
SAFT is one tool for improved understanding of detected ultrasonic signals. The imaging system applied to improve the reliability of the assessment is the use of back propagation of elastic waves in SAFT.
SAFT has been used to restore ultrasonic images obtained either from B or C scans with focusing distortion [6]. With the use of this technique an improvement of the image resolution can be obtained, without the use of the traditional ultrasonic lenses. This work shows the practical implementation of SAFT for scan B, by presenting an algorithm and the resulting image. For SAFT to work properly, it is necessary to know accurately the path traveled by the ultrasound from the transducer to target and back again. Therefore a geometrical model of ultrasonic signal and its correlation to adjacent scan A lines are used to restore the image. In order to minimize the execution time of this algorithm, the correlation is calculated only between few lines adjacent to the analyzed line, in a correlation window.
For focusing the pulse-echo measurements at the synthetic aperture, the received signals are processed using the SAFT algorithm. The SAFT algorithm focuses the received signals to any point of the reconstructed image by coherent superposition. In this way, a large virtual transducer with variable focus is synthesized. A High resolution image result, which is two dimensional (2D SAFT) for the case of the linear aperture, and three dimensional (3D SAFT) for the planar aperture [9].
In recent years, time-frequency analysis has been used extensively for advanced research on NDE and SHM. In time-frequency analysis the frequency content of the signal
time information of the signal. Therefore, time-frequency template of signal can be readily used for identification of reflectors and their feature extraction. Time-frequency analysis based on Wigner-Ville distribution has been used by for impact damage identification in composite plates using ultrasonic guide waves [1].
The synthetic focus is based on the geometrical reflection or ray acoustic model [Figures. 1-3]. In this model the focus of the ultrasonic transducer is assumed to be a point of constant phase which all the sound rays pass through before diverging in a cone whose angle is determined by the diameter of the transducer and the focal length [6]. If a reflecting target is located beneath the focal point and within the cone, it is a simple matter to calculate the path length and the transit time for a signal traveling along the ray. The width of the cone at a given range corresponds to the aperture width that can be synthesized, and the path length that the signal must travel corresponds to the phase shift seen in the signal for that transducer position. With this information one can construct a corrected data set that incorporates the advantages of the larger transducer aperture.
In Fig. 1 the transducer at the point x1 and a wave front just passing the defect zone at the position x2 at distance d2 from the boarder respectively. This transducer characteristics results in an image as shown in Fig. 2 from a single round hole in an iron block of width d.
Department of Civil Engineering, North Eastern Regional Institute of Science and Technology, Nirjuli, Itanagar, Arunachal Pradesh, India.
Copyright to IJIRSET www.ijirset.com 196
Fig.1. Transducer beam width on the test block, showing the inspection position x1 and the defect position at x2[6]
Fig. 2.Distorted image resulting due to the beam width during a B-scan. The defect is at position (x2,d2).[6]
The implemented algorithm uses the geometric model to recalculate points from lines in A-scan and thereafter correlate these signals to improve the obtained image. The sections that follow describe the basis and computational procedures and compare the experimental results.
Fig.3. Schematics of A-scan signals which compose the B-scan image of Fig. 2.[6]
III. NUMERICAL SIMULATION
To study the characteristics of impact induced stress wave of propagation and interaction with variety of simulated structural reflectors detailed 3D numerical simulations are performed in thick concrete slabs using commercially available finite element package LSDYNA for explicit dynamic analysis. 350mm thick plate of solid elements is modeled. Impact balls of different diameters are created as per contact duration requirement, using sphere solid option in LS-DynaPrepost and are position at required height.Simply supported boundary condition has been given along the bottom edge of the slab and the side faces are made as non-reflecting boundaries in order to limit the size of the model and to avoid edge reflections. The termination time is defined such that the multiple reflections are present from both reflecting surface and bottom surface.Mesh size of the plate has been kept 1mm. Simulation is carried out with load curve of impact duration 50
s
. The receivers are added at a distance of 100mm and 200mm away from the impact point.Fig. 4. Nodal displacement at a distance of 100mm from Impact point
It can be observed from the Fig3.2 that initial large depression of the wave is due to Rayleigh wave whose width represent the duration of impact. Further we can see the multiple reflections of the P-wave between the top and bottom surface of the plate and are mentioned as 2P, 4P and 6P. The velocity of P-wave has been evaluated by taking time interval between 4P and 6P and it has found out that velocity of P-wave is 3215.4m/s which is matching with P-wave velocity given by equation-
) 2 1 )( 1 ( ) 1 ( v v v E Cp
To simulate displacement signals at the receiver nodes generated by the optimized impact force are analyzed using Fourier transform to identify the frequency shift that corresponds to the depth of the reflector (void depth). The Fast Fourier Transform of the above nodal displacement in frequency domain is as shown below. The frequency having the maximum amplitude is 4999Hz.
Fig. 5. Amplitude spectrum of nodal displacement at a distance of 100mm from Impact point
The 350mm thick plate model with non-reflecting boundaries is used to find the response of flaw, a square box of dimension 100m
100mm
10mm is created at a depth of 150mm from the impact surface, and impact duration is kept as 50
s
.IV. IMAGE RECONSTRUCTION USING SAFTALGORITHM
Presence of internal void is reconstructed using two types of SAFT algorithms; (a) FFT SAFT and (b) WT SAFT. The first algorithm utilizes the Fourier amplitude spectra of the received signals, and is termed as FFT SAFT. One the other hand the second algorithm uses combined time-frequency analysis based on wavelet transformation (WT) of the received signals, and is termed as WT SAFT. From all of the frequency analysis results we are only able to find only the depth of the reflector, and we are not clear about its position in a vertical plane. So in order to determine the horizontal position of the reflector Time frequency analysis method is used with the help of Vallen wavelet transform [11].AGU-Vallen Wavelet is a tool which allows us to calculate and display the wavelet- and Choi-Williams transformation of individual waveforms. The advantage of the Choi-Williams transformation is the better resolution of frequency vs. time.
A wavelet transform (WT) of an AE signal provides -8E-09 -6E-09 -4E-09 -2E-09 0 2E-09
-5E-05 1E-18 5E-05 0.0001 0.00015 0.0002
D is p la ce m e n t Time
2P 4P 6P
0 1 2 3 4 5 6 7
x 104 0 0.2 0.4 0.6 0.8 1 1.2 1.4 1.6 1.8
2x 10 -7
X: 4999 Y : 1.837e-007
Department of Civil Engineering, North Eastern Regional Institute of Science and Technology, Nirjuli, Itanagar, Arunachal Pradesh, India.
Copyright to IJIRSET www.ijirset.com 198
and time is to be found. In time frequency domain analysis the use of vallen wavelet transform helps to determine the frequency corresponding to multiple reflection from reflectors. The wavelet transform coefficients obtained from wavelet transform will vary for a particular frequency for along the time duration depending upon the reflections from reflectors. The maximum value of wavelet transform coefficient will indicate maximum reflection from the particular surface (void surface or bottom surface of the plate).
The time domain response obtained from receivers are converted to time frequency domain using vallen wavelet transform. The frequency corresponding to particular depth obtained from frequency domain analysis is compared in wavelet transform to recheck the sufficient reflection (good energy content in response of receiver) from the reflectors. The wavelet transforms values with respect to time for that corresponding depth (frequency) of a receiver is taken. This information is used to reconstruct the image for that depth of the concrete slab using SAFT [9].
The basic time-domain 2D SAFT algorithm for reconstruction of a two-dimensional image for any point P(x, y, z) based on impact echo measurements R(t) on a planar aperture is given by-
t
RA
R=
z))
y,
I(P(x,
Where I is the intensity at any point P, R is the receivers and t is the time required to provide maximum value of wavelet transform coefficient of particular frequency for the particular receiver, measured from source to any point P and to the receiver. A is the wavelet transform coefficient of particular frequency. The summation of WTC of all the receivers at different point in an area under imaging will indicate peak at the location of the reflector.
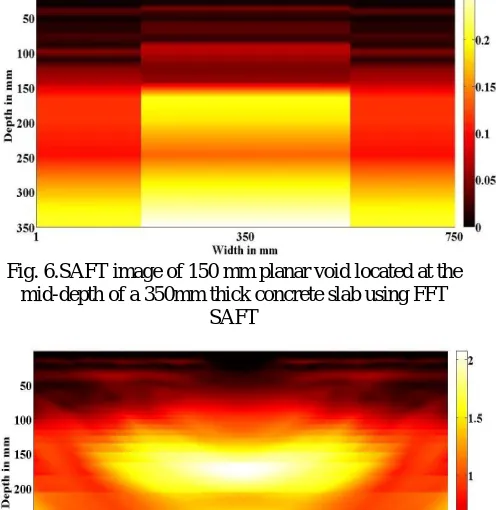
The wavelet transform confirms presence of multiple P-waves reflected from the back wall carrying higher WTC at the thickness frequency, whereas, the void echo is reflected with weak WTC at a higher frequency. The intensity maps in the form of B-scan are generated for various types of planar and circular voids located at the mid-depth of the concrete slab. Intensity maps for a 150mm planar void and a 50mm dia circular void are shown [Figures. 6-9]. While the 150mm planar void is clearly constructed in the SAFT image, the presence of circular void can only be predicted.
Fig. 6.SAFT image of 150 mm planar void located at the mid-depth of a 350mm thick concrete slab using FFT
SAFT
Fig.8.SAFT image of 50 mm dia circular void located at the mid-depth of a 350mm thick concrete slab using FFT
SAFT
Fig.9. SAFT image of 50 mm dia circular void located at the mid-depth of a 350mm thick concrete slab using WT
SAFT
V. CONCLUSION
The surface mapping SAFT algorithm as implemented in the paper shows an efficient and quick process, giving a more accurate image of the void then could be obtained from the raw data. Improved resolution, and decreased position error is produced.LSDYNA simulation studies provide detailed understanding on the nature of the impact signals generated. It should be noted that choice of impact duration and sensor spacing can greatly influence the image resolution capability.
REFERENCES
[1] Banerjee, S. 2003, Lee et al“Impact damage identification in composite plates using ultrasonic guide waves” 2007.
[2] Barkefors,A. 2010. 3D Synthetic Aperture Technique for Ultrasonic Imaging. Uppsala University, Student thesis.
[3] Burr,E., Grosse, C.U. and Reinhardt,H.W. 1997. Application of a modified saft-algorithm on synthetic b-scans of coarse grained materials. Otto-Graf-Journal, vol. 8.
[4] Dengzhi,W. Non-linear Synthetic Aperture Focusing Technology Ultrasonic Imaging Applied In Nondestructive Testing. NDT.net., vol. 12, 9.
[5] Diaz, M.A., Leija, L. and Vera,A. 2007. Image Reconstruction using the Synthetic Aperture Focusing Technique. Pan American Health Care Exchanges, USA.
[7] Pitkanen, J., Oy, P., Olkiluoto and Finland. 2006. SAFT – Is it a Tool for Improved Sizing in Ultrasonic Testing? European Conference on Non-Destructive Testing, poster 211.
[8] Qi, J., Miao,J. and Xie, Y. 2012. Synthetic Aperture Focusing Technique and Contrast Source Inversion Algorithm Applied in Elastic Wave Imaging. Advanced Materials Research, vol. 340, pp 402-408
[9] Schickert, M., Krause, M.and Muller, W. 2003. Ultrasonic Imaging of Concrete Elements Using Reconstruction by Synthetic Aperture Focusing Technique. Journal of materials in civil engineering, vol. 235
[10] Sicard ,R., Goyette, J. and Zellouf, D. 2002. A SAFT algorithm for lamb wave imaging of isotropic plate-like structures. Ultrasonics, vol.39, pp 487–494
![Fig.1. Transducer beam width on the test block, showing the inspection position x1 and the defect position at x2[6]](https://thumb-us.123doks.com/thumbv2/123dok_us/1537376.1188565/3.612.346.515.202.311/transducer-width-block-showing-inspection-position-defect-position.webp)