| GENOMIC SELECTION
Genomic Analysis of Genotype-by-Social Environment
Interaction for
Drosophila melanogaster
Aggressive Behavior
Palle Duun Rohde,*,†,‡,1Bryn Gaertner,§,**,††Kirsty Ward,§,**,††Peter Sørensen,* and Trudy F. C. Mackay§,**,†† *Center for Quantitative Genetics and Genomics, Department of Molecular Biology and Genetics, Aarhus University, 8830 Tjele,
Denmark,†iPSYCH, The Lundbeck Foundation Initiative for Integrative Psychiatric Research, and‡ISEQ, Center for Integrative
Sequencing, Aarhus University, 8000 Aarhus, Denmark, and§Department of Biological Sciences, **Program in Genetics,
and††W.M. Keck Center for Behavioral Biology, North Carolina State University, Raleigh, North Carolina 27695
ORCID ID: 0000-0003-4347-8656 (P.D.R.)
ABSTRACT Human psychiatric disorders such as schizophrenia, bipolar disorder, and attention-deficit/hyperactivity disorder often include adverse behaviors including increased aggressiveness. Individuals with psychiatric disorders often exhibit social withdrawal,
which can further increase the probability of conducting a violent act. Here, we used the inbred, sequenced lines of theDrosophila
Genetic Reference Panel (DGRP) to investigate the genetic basis of variation in male aggressive behavior forflies reared in a socialized and
socially isolated environment. We identified genetic variation for aggressive behavior, as well as significant genotype-by-social
environ-mental interaction (GSEI); i.e., variation among DGRP genotypes in the degree to which social isolation affected aggression. We
performed genome-wide association (GWA) analyses to identify genetic variants associated with aggression within each environment. We used genomic prediction to partition genetic variants into gene ontology (GO) terms and constituent genes, and identified GO terms and genes with high prediction accuracies in both social environments and for GSEI. The top predictive GO terms significantly increased the proportion of variance explained, compared to prediction models based on all segregating variants. We performed genomic prediction across environments, and identified genes in common between the social environments that turned out to be enriched for genome-wide
associated variants. A large proportion of the associated genes have previously been associated with aggressive behavior inDrosophila
and mice. Further, many of these genes have human orthologs that have been associated with neurological disorders, indicating partially shared genetic mechanisms underlying aggression in animal models and human psychiatric disorders.
KEYWORDSDrosophila melanogaster; social isolation; social experience; GBLUP; GFBLUP; GenPred; Shared data resource; Genomic Selection
V
IOLENT behavior is a common comorbidity amonghu-manpsychiatric disorders such as schizophrenia, bipolar
disorder and attention-deficit/hyperactivity disorder (Volavka and
Citrome 2008; Retz and Rösler 2010; Hodgins et al. 2014;
Volavka 2014; Hoptman 2015). Not all patients with a diagnosis of a psychiatric disorder will show elevated aggressiveness; how-ever, such individuals have an increased risk of performing an
aggressive act (Volavka and Citrome 2008; Retz and Rösler
2010; Hodginset al.2014). Social withdrawal is frequently
observed for patients with a psychiatric disorder, which fur-ther contributes to an increased risk of performing a violent
act (Retz and Rösler 2010; Hansen et al.2013) and could
point to a potential genotype-by-social environmental inter-action (GSEI). Some data indicate that GSEI for
aggressive-ness in human populations does exist. Caspi et al. (2002)
provided thefirst evidence for an interaction between
geno-type and early life maltreatment affecting the probability of
developing antisocial behavior later in life. These findings
were later replicated in a laboratory study (Gallardo-Pujol et al.2013).
Studying the genetic basis of aggressive behavior in human
populations is challenging due to the difficulty in quantifying
Copyright © 2017 by the Genetics Society of America doi:https://doi.org/10.1534/genetics.117.200642
Manuscript received January 30, 2017; accepted for publication May 22, 2017; published Early Online May 26, 2017.
Supplemental material is available online atwww.genetics.org/lookup/suppl/doi:10. 1534/genetics.117.200642/-/DC1.
the phenotype, genetic heterogeneity, and uncontrolled en-vironmental conditions. Animal models not only provide a valuable tool for understanding the genetic basis of
aggres-siveness, which is evolutionarily conserved (Lorenet al.2003;
Moscaet al.2012; Jones and Norton 2015), but also provide a
way to investigate how the social environment affects the degree and direction of individual levels of aggressive behav-ior. Aggressive behavior has been studied in several model
organisms, including mice (Miczek et al. 2001), voles
(Gobrogge and Wang 2011), zebrafish (Jones and Norton
2015), and fruit flies (Chen et al. 2002; Edwards et al.
2006; Wang et al. 2008; Kravitz and Fernandez 2015;
Shorteret al.2015). In thefly model, studies have
demon-strated repeatedly that socially isolated individuals exhibit increased levels of aggressive behavior compared to socially
experienced individuals (Wanget al.2008; Zhouet al.2008;
Dankert et al.2009). However, it is unknown whether the
effect of social isolation is genetically variable (i.e., exhibits GSEI) or what the underlying genetic basis of GSEI for ag-gressive behavior is.
TheDrosophilaGenetic Reference Panel (DGRP) consists of 205 largely unrelated inbred lines derived from a natural population with full publicly available genome sequence data (http://dgrp2.gnets.ncsu.edu) (Mackayet al.2012; Huang et al.2014). Since the DGRP lines are inbred, it is possible to assess many individuals of the same genotype in multiple environments, an ideal design for detecting and quantifying the magnitude of genotype-by-environment interactions. To investigate the underlying genetic mechanisms of aggressive behavior, and potentially the genetic mechanisms driving
GSEI, we quantified the aggressive behavior of 87 DGRP lines
for multiple individuals reared under socialized or socially isolated conditions.
We performed a quantitative genetic analysis and showed
there was significant genetic variation for aggression in both
social environments, as well as significant GSEI. We then
performed several genomic analyses to identify genes and gene ontology (GO) terms associated with male aggression, and genomic features determining the interaction term. The genomic analyses included a genome-wide association (GWA) using single marker regression to assess the contribu-tion of individual polymorphic markers on aggressive be-havior in the two environments, and for the difference in aggressiveness between socialized and socially isolated indi-viduals (GSEI). The small sample size of the DGRP, expected small effects of individual genetic markers, and the large number of tests to be performed with sequence data results in limited statistical power to detect true associated genetic
variants (Hirschhorn and Daly 2005; McCarthyet al.2008;
Wanget al.2010a, 2011; Fridley and Biernacka 2011; Rohde et al.2016a). Methods that combine the signals from multiple genetic markers, including set-test approaches [i.e., the
se-quence kernel association test (Wuet al.2011) and
covari-ance association test (Rohde et al. 2016a)] and genomic
prediction models [genomic best linear unbiased prediction
(GBLUP) (Meuwissenet al.2001)], may better capture the
signal from numerous genetic markers with small effect sizes.
Extending GBLUP byfitting multiple genetic components has
been shown to increase predictive ability (PA) (Speed and
Balding 2014; Tuckeret al.2015). In particular,fitting
mul-tiple genetic components can be used to partition genetic
variance by pathway (Edwards et al.2015), or to test the
PA of predefined sets of genes using genomic feature BLUP
(GFBLUP) (Edwardset al.2016; Sarupet al.2016; Fanget al.
2017). The second set of genomic analyses therefore in-cluded genomic prediction models where the aims were to identify sets of genes predictive of the trait variation, but also to investigate means to predict aggression across social rear-ing conditions.
Materials and Methods
Drosophila and establishment of social rearing conditions
87 DGRP lines (Mackay et al. 2012) and an isogenic control
strain, Canton-SB (CSB) (Norgaet al.2003), were maintained
in the Mackay laboratory at North Carolina State University (Raleigh, NC) under controlled conditions
(cornmeal-molasses-agar medium, 25°, 70% humidity, and a 12 hr light-dark cycle).
Two social rearing environments were established by initially
setting up the DGRP lines and an equal number of CSBflies in
two replicate bottles per social group, each consisting of 20 males and 20 females, and allowing them to mate and lay eggs for four consecutive days.
Socially experiencedflies:Twelve days after the initial cross,
the bottles were cleared for emerged flies. The following
morning,flies that had emerged within the last 16 hr were
sorted into two vials, with 24 mixed-sexflies per vial. Three
days later, theflies were lightly anesthetized and sorted by sex.
Up to 24 males/DGRP line were kept, and 16 hr prior to the aggression assay the socially experienced DGRP and CSB males (see below) were transferred to the Flydiator arena (Figure 1), where they had access to food.
Socially isolated flies:Eleven days after the initial cross, the bottles were cleared. The next morning, newly-eclosed (deter-mined by meconium) DGRP males were separated into collection
vials, 24–32 per DGRP line. Individual males were then placed
into cells of a 96-well plate (2.2 ml deep) containingfly food.
16 hr prior to the assay, the isolated DGRP and the social CSB males (see below) were added to the Flydiator arena with ac-cess to food (Figure 1), but separated by cardboard.
Control flies: The same day the socially experienced DGRP
flies were established, two vials of 24 mixed-sex CSBflies
were prepared. Three days later, CSB males were lightly anesthetized and sorted by sex. Twenty-four males were placed in vials corresponding to the number of DGRP lines to be assayed.
Note that our definition of social isolation includes
includes a mating component (socially isolated males are virgins while the normally socialized males are most
likely mated) and a male–male interaction component
(socially isolated flies have no experience with other
males while normally socialized males will likely have participated in, and learned from, previous aggressive encounters).
Drosophila aggression assay: the Flydiator arena
A behavioral arena, the Flydiator arena, was developed to facilitate high-throughput acquisition of aggression data on
pairs of individuals; one DGRP and one controlfly (CSB). The
arena was constructed in transparent polycarbonate (3.5
in.35.0 in.31 in.) with 436 wells (diameter of 0.625
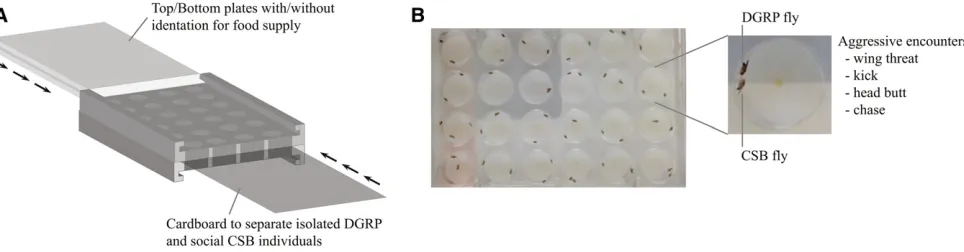
in.). The top and bottom were removable, which allowed exchange between smooth plates and plates with indenta-tions (diameter of 0.25 in.) for food supply. Each well could be divided into separate containers (diameter of 0.625 in., height 0.5 in.) by an interchangeable cardboard barrier to
keep the pair of flies separated until the start of the assay
(Figure 1).
All assays were performed between 8–11AM, andflies were
starved for 90 min prior to the aggression assay. New food was introduced 2 min before the initiation of the assay, and
the barrier separating the isolated DGRPflies and social CSB
flies was removed. Flies werefilmed for 2 min using an iPad
Mini (Apple, Cupertino, CA). Subsequently, the total num-ber of aggressive encounters for the DGRP and the CSB individuals were manually scored using Jwatcher software
(Blumstein et al. 2012). These behaviors included wing
threat (the fly raises both wings to a 45°angle toward the
opponent or flicks wings at a 45°angle while facing away
from the opponent), head butt (strikes the opponent with the head), kicking (extends leg and makes contact with the op-ponent), and chasing (runs after the opponent with close
proximity) (Zwarts et al. 2012). The manual scoring was
accomplished by the same person to minimize variation caused by different persons scoring and to avoid potential bias.
The aggression assay was conducted infive blocks with 21,
17, 15, 23, and 11 DGRP lines represented in each block
(Supplemental Material, Figure S1 in File S1), and
pheno-types were obtained one block at a time.
Genomic data
SNP genotypes were obtained from whole-genome sequence
data (available athttp://dgrp2.gnets.ncsu.edu/). A total of
1,725,755 SNPs with a minor allele frequency (MAF) of
$ 0.05 were present in the 87 DGRP lines, distributed on
the six chromosome arms; 2L, 2R, 3L, 3R, 4, and X. SNPs
were annotated to genes (defined as SNPs within the
tran-scribed region of the gene) using FlyBase annotation v5.49
(flybase.org, Figure S2 inFile S1), and mapped to a total of
10,517 genes. Genes were linked to GO terms using the org. Dm.eg.db package (Carlson 2015) for Bioconductor (Gentleman et al.2004). We only considered GO terms with$10 directly evidenced genes and a minimum of 199 SNPs. This cutoff resulted in a total of 1134 GO terms and a total of 963,207 unique SNPs.
Quantitative genomic parameters
GSEI:An individual’s phenotype can be described as the sum of its genotypic and environmental effects. Genotype-by-environmental interaction occurs when different genotypes respond differentially to environmental changes (Falconer and Mackay 1996; Lynch and Walsh 1998). A two-way
fac-torial mixed model ANOVA was fitted to test for GSEI;
y¼BþEþLþL:Eþe;whereyis a vector of phenotypic
values offlies from both rearing environments (square root
transformed to fulfill assumptions of normality),Bis afixed
experimental block effect,Eis afixed environmental rearing
effect (i.e., social or socially isolated environment), L is a
random line effect, L:E is a random interaction term
be-tween line and rearing environment, and eis the residual.
The significance ofL:Ewas obtained using a likelihood ratio
test comparing the model to a reduced model neglecting the interaction term.
GSEI can be viewed as a trait itself. Here, GSEI was
quantified as the difference in adjusted phenotypic values
(y~) for socially experienced and socially isolatedflies within
each DGRP line, i.e.,~yGSEI¼y~soc2~yiso (seeAdjusted
pheno-types used in genomic association and prediction models).
Figure 1 Assay used to quantify aggressive behavior. (A) Illustration of the Flydiator arena. (B) Top view of the Flydiator arena loaded with pairs of CSB
Estimating variance components: Variance components
were estimated using the R package lme4 (Bates et al.
2015) forflies reared in a socialized environment,flies reared
in social isolation, and for the two-way interaction model (see above). The models within social environment were:
y¼BþLþe; wherey is a vector of phenotypic values of
flies from one of the rearing environments (social or isolated,
square root transformed to fulfill assumptions of normality),
B is a fixed experimental block effect, L is a random line
effect, andeis residual effect. Segregating polymorphic
chro-mosomal inversions (Huanget al.2014) andWolbachia
in-fection status were tested for association with aggressive behavior; none had major effects (results not shown), thus, these were not accounted for.
The proportion of phenotypic variance explained by ge-netic variance within social environment was estimated as H2¼s2
G=ðs2Gþs2eÞ;and across social environments asH2¼
ðs2
Gþs2G:EÞ=ðs2Gþs2G:Eþs2eÞ: s2G is the genetic variance
among lines,s2
G:Eis the genotype-by-environment interaction
variance, ands2
e is the pooled within-line variance.
Cross-environment phenotypic and genetic correlations:
Phenotypic and genetic correlations were computed between DGRP lines from the two social rearing conditions. The
phe-notypic correlation (rp) was computed as Pearson’s
correla-tion using line means, and the cross-environment genetic
correlation was computed as rG¼s2G=ðs2Gþs2G:EÞ; using
the estimated variance components from the two-way ANOVA.
Adjusted phenotypes used in genomic association and prediction models
The phenotypes used in the single marker regressions and the prediction models were the observed number of aggres-sive encounters, transformed by the square root to achieve an approximation of a Gaussian distribution, or GSEI, adjusted
for experimental block effect by fitting the linear mixed
model
y¼XbþZgþe; (1)
where yis a vector of repeated phenotypic observations,X
andZare design matrices linkingfixed and random effects to
the phenotypic values, bis a vector offixed effects,gis a
vector of random genetic effects defined asgNð0;Gs2
GÞ;
andeis a vector of residual effects defined aseNð0;Is2
eÞ:G
is the genomic relationship matrix computed using all
segre-gating markers, G¼WW9=m;wheremis the total number
of genetic markers, and W is a centered and scaled
geno-type matrix. Each column vector of W was computed as
wi¼ai22pi=
ffiffiffiffiffiffiffiffiffiffiffiffiffiffiffiffiffiffiffiffiffiffi
2pið12piÞ
p
;wherepi is the MAF of thei-th
marker, and ai is thei-th column vector of the allele count
matrix,A, containing the genotypes encoded as 0, 1, or 2,
counting the number of minor alleles (VanRaden 2008). Model (1) is an animal model with repeated phenotypes per DGRP line, resulting in the number of estimated genetic
effects (^g) corresponding to the number of DGRP lines. The
residual effects (^e) have the same dimension as the vector of
phenotypes, thus, to retain the replicated structure in the data for the following analyses the adjusted phenotypic
val-ues (~y) were computed as
~
yi¼^giþ^ei; (2)
where~yiis a vector of adjusted phenotypic values for thei-th
DGRP line,^giis the estimated genetic effect for DGRP linei,
and^eiis a vector of residual effects for linei. The estimated
genetic and residual effects were derived using average in-formation restricted maximum likelihood, as implemented in
DMU (Madsenet al.1994).
Single marker regression
Single marker regression, also known as GWA, evaluates the contribution of each segregating genetic marker one at a time, allowing detection of markers with large effects. The test
for association of each genetic marker was a t-test on the
regression coefficient from the regression of estimated
genet-ic effects (g^; equation 1) on each polymorphic marker
(i.e., 1,725,755 SNPs at MAF. 0.05). A nominal P-value
, 131025was used as the significance threshold. The
ge-netic effects were used as the response variable because these
comprise the DGRP line means adjusted forfixed effects and
the genetic structure among DGRP lines.
Identification of predictive SNP sets
The set of causal genetic variants for a given trait should be predictive of the trait value. Therefore, statistical models that allow genomic predictions based on multiple groups of
genetic variants could provide a valuable tool for identifi
-cation of SNP sets containing causal variants. Genetic markers associated with trait variation may not be uni-formly distributed across the genome, but may be enriched
for genes connected in pathways (Allenet al. 2010; Lage
et al. 2012; O’Roak et al. 2012). GO terms are a useful resource of groups of genes with shared biological, molec-ular, or cellular functions (The Gene Ontology Consortium 2000). An extension of the standard GBLUP (Meuwissen et al.2001), which allows the addition of an extra genetic
component for a set of genetic markers, e.g., all those
within a certain GO term, is GFBLUP (Edwards et al.
2015, 2016; Ehsani et al. 2015; Sarup et al.2016; Fang
et al.2017). The genomic feature model is described be-low, along with a method to decompose the genetic vari-ance within a GO term to the varivari-ance explained per gene within a GO term.
Genomic feature models: The following methodology was used to identify groups of genetic markers predictive of the phenotype. First, a NULL model (GBLUP) based on all genetic markers was obtained
~
Then, for all sets of genetic markers (i.e., GO terms), a
sep-arate model wasfitted (GFBLUP),
~
y¼ZfþZrþe; (4)
wherefdenotes the genetic effects captured by the genetic
markers within a subset of markers, andrwas the genetic
effects captured by all genetic markers not included in the
first set. In particular, the random genetic effects were
de-fined as fNð0;Gfs2GfÞ; and rNð0;Grs
2
GrÞ; where
Gf¼WfW9
f=mf andGr¼WrW9r=mr:
Using a standard 10-fold cross validation scheme adapted from animal breeding, the PA was measured as the correlation between the observed genetic values (corresponds to the adjusted line means), and the predicted genetic effects in the validation set. To ensure accurate estimation of PAs, a total of 100 training (t) and validation (v) sets were generated
(Figure S3 inFile S1). For each pair of training and validation
sets the GBLUP (equation 5) and GFBLUP (equation 6)
mod-els werefitted. The genetic effects in the validation set (^gv)
for the GBLUP model were obtained as
^
gv¼
Gv;ts^2G h
Gt;ts^2GþIt;ts^2e i21
ðyt2m^tÞ; (5)
and for the GFBLUP model,
^
gv¼
Gfv;ts^
2
Gf þGrv;ts^
2
Gr
h
Gft;ts^
2
Gf þGrt;ts^
2
GrþIt;ts^
2 e
i21
3ðyt2m^tÞ:
(6)
Predictive GO terms were defined as those that significantly
increased PA compared to the NULL model. To assess whether
a GO term increased PA compared to the NULL model, Welch’s
t-test was applied (Welch 1947). Subsequently, all t-test P-values were adjusted for multiple testing (Bonferroni
cor-rection) and the significance threshold was set atP,0.05.
In addition, 10 random sets of SNPs were generated for each predictive GO term. The properties of these random sets corresponded to that of the true GO term. That is, the archi-tecture of the set was retained, such that the number of SNPs was the same, and the SNPs were clustered in groups corre-sponding to the number of genes in the true GO term. The predictive abilities of these random sets were compared to the
PA of the true GO term using at-test.
Genetic decomposition of predictive SNP sets:GO terms are composed of several genes, and it is unlikely that all genes within a GO term contribute equally to the PA. Therefore, to dissect the genetic contribution of the genes within the pre-dictive GO terms, the genetic variation within the set of predictive GO terms was decomposed to gene level (Rohde et al.2016b).
For each predictive GO term (i.e., those with an adjusted P-value,0.05), the marker effects for those genetic markers
belonging to a particular GO term (^sf) were obtained by
multiplication of the centered and scaled genotypes (Wf)
and the estimated genetic effects corresponding to that par-ticular GO term (f):
^
sf ¼W9f
WfW9f 21
^
gf: (7)
Using^sf;the genetic effects for thexjgenes constituting the
GO term (^ff) were computed as:
^ff;x
j¼
Xmxj
i¼1
Wf;xj;i^sf;i; (8)
where^sf;iis the marker effect of thei-th marker computed for
feature f, andmxjis the number of markers within genexj:
Thus, if a GO term has the genetic effect^gf;and consists ofx
genes, thengf^ ¼Pxi¼1^fi:A measure of the genetic variation
for each feature per gene adjusted for the number of SNPs within gene (VarF), was approximated as:
VarFxj¼Var
^
ff;xj
mxj (9)
Across-environment prediction
Two prediction approaches were used to determine the degree
of shared genetic signal for aggressive behavior forflies reared
in the socialized or socially isolated environment, as well as for GSEI.
Genomic prediction using sets of candidate genes: The GFBLUP models (equation 4) were used to test if the combined set of predictive GO terms and genes within one environment was predictive of the genetic effects within another environ-ment. In this scenario, the feature group contained all the GO terms or genes predictive within a given environment. A total of 18 predictions were performed: nine for the set of predictive GO terms (e.g., to-social, to-isolated, and
social-to-GSEI), and nine for the set of genes capturing .10% of
the genetic variance within the set of predictive GO terms.
Genomic prediction based on single marker regression:
Single marker regressions were performed for each training set (and environment), and genomic predictions (equation 4) were performed within the validation set for each
environ-ment, e.g., social, isolated, and
social-to-GSEI. Here, the feature group contained sets of SNPs that,
from the single marker regression, had a nominal P-value
,131025; ,131024; ,0:001; ,0:01; ,0:05; ,0:1; ,0:2; ,0:3; ,0:4; ,0:5; ,0:6; ,0:7; ,0:8;or ,0:9: The second random genetic component was the genetic ef-fects captured by all genetic variants.
For each within-environment prediction (i.e., social-to-social, isolated-to-isolated, or GSEI-to-GSEI) we applied a resampling scheme to obtain the PA of randomly sampled SNPs. A total of 100 randomly sampled SNP sets were
gen-erated for each P-value threshold. The number of sampled
observed number of SNPs below that threshold (Figure S4 in
File S1).
Enrichment of associated variants within the predictive SNP sets
To link the results from GFBLUP with the single marker regressions, the set of predictive GO terms and the set of
genes explaining .10% of the genetic variance were tested
for enrichment of individual genetic markers with a nominal P-value,0.001. The enrichment test was performed using a standard procedure by applying a hypergeometric
distri-bution (Rivals et al. 2007; de Leeuw et al. 2016). The
enrichment test was performed both within and across
envi-ronments, i.e., the predictive set of GO terms and genes
explaining .10% of genetic variance was tested for
enrich-ment of associated genetic markers from both environenrich-ments and from GSEI (18 comparisons).
Software
All statistical analyses were performed within R version 3.1.0
(R Core Team 2016). The mixed models werefitted using
DMU software (Madsen and Jensen 2013) using the DMU
interface within the R package “qgg” (http://psoerensen.
github.io/qgg/). In particular, GBLUP and GFBLUP models
werefitted with the“reml”function, the genetic
decomposi-tion was done with the funcdecomposi-tion “covSets,” and the
enrichment test was performed with the function“setTest.”
Data availability
The DGRP genotypes can be accessed via the websitehttp://
dgrp2.gnets.ncsu.edu, and the phenotypic data are available inTable S1.
Results
Quantitative genetics of aggressive behavior
We quantified the total number of aggressive encounters (i.e.,
the sum of wing threats, head butting, kicking, and chasing) for 87 DGRP lines reared in a socialized or socially isolated
environment (Figure 2A andTable S1). We used linear mixed
models to infer the genetic variation among lines as well as genetic variation in the social environment interaction term
(GSEI). We observed significant genetic variation for
aggres-sive behavior in each social environment and averaged across
the two environments, as well as significant GSEI (Table 1).
GSEI can be viewed as a trait itself, here quantified as the
difference in aggressive behavior between the social and so-cial isolation environments (Figure 2B). The nature of the GSEI was that some DGRP lines showed elevated aggressive behavior when reared in the socially isolated environment, some DGRP lines became less aggressive when reared in so-cial isolation, and some lines were not affected by the rearing regime (Figure 2). We estimated the broad sense heritability
averaged across the two social environments (H2= 0.14) as
well as for socially reared (H2 = 0.14) and socially isolated
(H2= 0.12)flies (Table 1). An increase in residual variance
(s2e;Table 1) within the social isolation environment resulted
in the decreasedH2estimate for this environment (Table 1).
The estimate of the phenotypic correlation (rp) between
the number of aggressive encounters forflies reared in the
social and socially isolated environment wasrp= 0.52, and
the cross-environment genetic correlation (rg) wasrg= 0.59
(Table 1). Thus, from our quantitative genetic analysis, we infer that the genetic basis of aggression is in part shared between social environments and in part genetically distinct within each environment.
An aggressive encounter requires interaction between two (or more) individuals, and successive encounters may require the individuals to move. Thus, a correlation between mea-sures of locomotor activity and aggression might be expected. Previously, it has been shown that eliminating social
interac-tions affects locomotor activity (McCarthy et al.2015). To
assess whether the differences in aggressive encounters were mainly driven by phenotypic differences in locomotor
activ-ity, we computed Pearson’s correlations between aggressive
behavior in the social rearing conditions and previously pub-lished measures of locomotor activity obtained for the DGRP
(Mackayet al.2012; Harbisonet al.2013). None of the
avail-able measures of locomotor activity were significantly
corre-lated with aggressive behavior (Figure S5 inFile S1).
Genetic markers and genomic features associated with aggressive behavior
An advantage of inbred genetic resource populations, such as the DGRP, is the ability to phenotype multiple animals of the same genotype because it increases the precision of the estimate of the genotypic value of the trait for each genetic background. The heritability of aggressive behavior was low in both the social and socially isolated environment, as expected for behavioral traits. However, the heritability of line means is H2¼
s2G=½s2Gþ ðs2e=nÞ;where s
2
Gand s2e are, respectively,
the among-line and within-line variance of the individual
data, and n is the number of individuals scored per line.
The average number offlies per DGRP line assessed for
ag-gressive behavior was 20 for the social environment and 19 for the socially isolated environment. Therefore, the broad sense heritabilities of line means for the socialized and
so-cially isolated flies are, respectively,H2 = 0.76 and H2 =
0.73. This increases the power of association mapping as well
as PA (Edwardset al.2016).
We first performed GWA analyses using single marker
regressions to identify variants associated with aggressive
behavior forflies reared in a socialized environment andflies
reared in a socially isolated environment, as well as GSEI. At a
nominal P-value ,131025; 25 SNPs in 15 unique genes
were associated with variation in aggressiveness for socially
rearedflies, eight SNPs in six unique genes were associated
with variation in aggressive behavior for flies reared in a
socially isolated environment, and 24 SNPs in 17 genes were
associated with GSEI (Table S2). None of the variants were
significant following correction for multiple tests (Table S2).
evidence of confounding factors inflating the overall signal; however, deviations from the expected probabilities below
P , 131025toward more extreme values were observed,
suggesting enrichment of true positive associations (Figure
S6 inFile S1).
Because methods that consider all variants jointly can capture small polygenic effects, which is not possible in un-derpowered GWA analyses, we asked to what extent a GBLUP NULL model using all variants could predict aggressive be-havior using cross validation. The PA is then the correlation (r) between the predicted and observed phenotypes in the vali-dation set. We found low PAs (6SE) for normally socialized
flies (PA = 0.1860.03), socially isolatedflies (PA = 0.256
0.04), and GSEI (PA = 0.2460.03) (Table S3). Similar low
predictive abilities for the GBLUP NULL model were observed previously for other quantitative traits measured in the DGRP
(Oberet al.2012, 2015; Edwardset al.2016). To put this in
perspective, the maximum PA is H2 ¼r2¼PA2
(Mrode
2005; Goddard 2009). Thus, for normally socialized flies,
the GBLUP NULL model only explains 0.03/0.76 = 3.9% of the observed heritability of line means, while for socially
isolatedflies the NULL model explains 0.06/0.73 = 8.2% of
the observed heritability of line means.
However, the NULL model assumes, unrealistically, that all markers contribute equally to variation in the trait. It is more likely that only a subset of markers affects the trait variation, while the majority have no effect. In this case, strategies to weight markers by the strength of their association in the
training set (Oberet al.2015) or to group markers according
to prior biological information and utilize these feature
groupings in prediction models may offer significant
im-provements over the NULL model (Speed and Balding
2014; Edwards et al. 2016; Sarup et al. 2016). Therefore,
within each environment we performed GWA analyses in the training set and developed prediction models using SNPs
at variousP-value thresholds to assess PA in the validation set
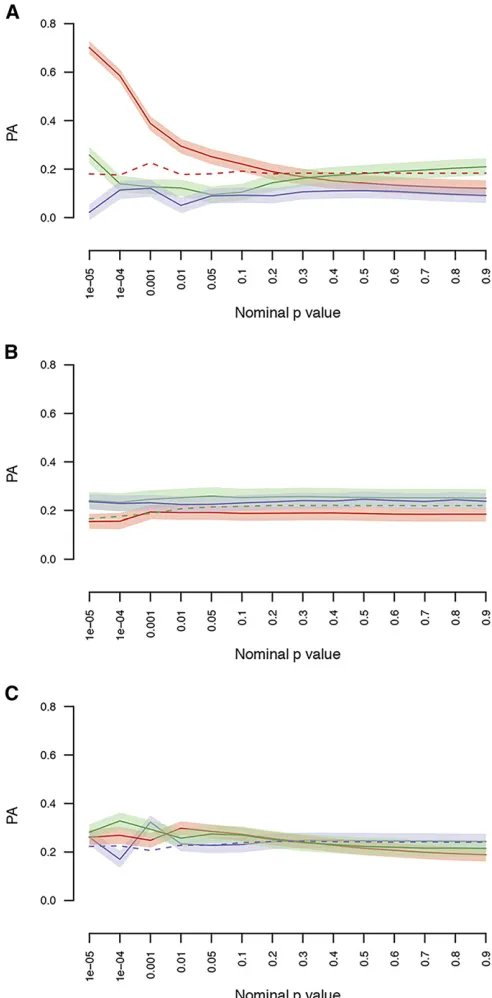
[Figure 3A (red line), Figure 3B (green line), and Figure 3C
(blue line)]. This strategy resulted in a significant increase in
PA for the normally socialized flies for markers with
P , 131025 (PA = 0.70 6 0.03), but not for socially
isolatedflies (PA = 0.2460.04) nor for GSEI (PA = 0.26
60.03) (Figure 3). The PA of the randomly selected SNP sets
was stable across the differentP-value thresholds and
corre-sponded to the GBLUP PA (dashed lines Figure 3). We then used GO terms to generate sets of genetic markers, used these sets as priors in genomic prediction models, and assessed whether these marker sets increased the model PA compared to the NULL model that used all segregating genetic markers.
We found that 50 GO terms significantly increased PA forflies
reared in the social environment, 14 GO terms increased PA
for socially isolatedflies, and 11 GO terms increased PA for
GSEI (Table S3). All predictive GO terms also performed
better than sets of random SNPs defined as having the same
structural properties as the true predictive set (Figure S7 in
File S1). The lack of strong correlation between the GO term
PA forflies reared in the socialized environment, the socially
isolated environment, and for GSEI (Figure S8 in File S1),
and having few GO terms in common across environments
(Figure S3 in File S1 and Table S3), further supports the
inferences of both distinct and shared genetic control of ag-gressive behavior under the different social rearing condi-tions. Two GO terms (phosphotransferase activity, alcohol group as acceptor, and epithelial cell migration) were pre-dictive for aggressive behavior in both social environments, and one of the predictive GO terms (regulation of
neurotrans-mitter secretion) was in common for flies reared in the
so-cialized environment and for GSEI (Table S3). In contrast to
the NULL model, the PA of the top GO term explains a sub-stantial fraction of the heritability of lines means: 53.6% for
normally socializedflies and 46.7% forflies reared in social
isolation.
When a set of SNPs increases PA, it is likely because the set
is enriched for trait-specific causal variants. We assessed
whether the predictive sets contained features discriminating them from nonpredictive sets, in particular with respect to MAF. The average MAF within the predictive sets did not
Figure 2 Variation in aggression among DGRP lines in two social en-vironments. (A) Mean adjusted phe-notypic values of aggressive behavior
forflies reared in an isolated
environ-ment as a function of the mean ad-justed phenotypic values for socially
experienced flies. The red dashed
line illustrates the expected point with no difference in phenotype from the two social environments.
(B) GSEI (y~GSEI¼~ysoc2y~iso) ordered
by increasing trait value. The hori-zontal dashed line indicates the expected value in absence of GSEI. Shaded areas illustrate in which so-cial environment the DGRP lines
be-came more aggressive (orange,flies
from the socially isolated environment; purple,flies from the socialized environment). DGRP,DrosophilaGenetic Reference Panel; GSEI,
deviate from the mean MAF across the genome, of randomly selected GO terms, or similar sized nongene regions (Figure
S9 inFile S1); however, we did observe a tendency for more
genes within the predictive GO terms to be significantly
enriched for low-frequency variants (Figure S10 inFile S1).
We asked whether low-frequency variants contributed more
to increased PA than common variants byfitting the GFBLUP
models (equation 4) and removing either low-frequency
(MAF ,0.1 or MAF , 0.2) or common variants (MAF.
0.1 or MAF.0.2) from the feature group of the predictive
GO terms. These analyses did not reveal any specific pattern
as the PA of the selected GO terms were increased, decreased,
or not changed (Figure S11 inFile S1), indicating little bias in
allele frequency for variants affecting aggressive behavior (and GSEI).
GO terms are composed of several genes, and the same gene can be associated with multiple GO terms. Therefore, we computed and ranked the proportion of variance explained per gene within each predictive GO term to estimate the importance of individual genes. Of the 50 GO terms predictive
of aggressive behavior forflies reared in the social
environ-ment, a total of 97 genes explained.10% of the total genetic
variance. Nine of these genes (AP-2s,CG17821,CG31141,
Egfr,Elo68b,Frq2,pnt,sgl, andwg) were represented by two
or three GO terms (85 unique genes,Table S4). For socially
isolatedflies, 39 unique genes explained.10% of the
ge-netic variation within the set of predictive GO terms for
ag-gressive behavior; one gene (chb) appeared in two GO terms
(Table S4). A total of 16 genes explained.10% of the ge-netic variation within the predictive GO terms for GSEI; one
gene (cv-c) was associated with two GO terms and one other
(Dys) was associated with three GO terms (13 unique genes,
Table S4). Of the genes capturing .10% of the genetic
var-iance within the predictive GO terms, four genes (Ady43A,
CG2794,Egfr, andrhea) were in common between the
social-ized and social isolation environment, three (CASK, Dys,
Figure 3 Genomic predictions within and across environments using GWA
results with bins defined byP-value cutoffs. The data were divided into
training and validation sets (10-fold), and GWA analyses were performed on each training set. Each training GWA analysis was then used to predict
the genetic values in the validation set [socially experiencedflies (red),
so-cially isolatedflies (green), or GSEI (blue)] using GFBLUP with feature sets
defined byP-value bins. Each panel shows the predictive ability using GWA
results from the social environment (A), the socially isolated environment (B), or GSEI (C). Shaded areas indicate the SEM. As comparison, the dashed lines represent the PA (within environment) from sets of randomly selected SNPs of size corresponding to the number of SNPs within environment below the
P-value cutoff. GFBLUP, genomic feature best linear unbiased prediction;
GSEI, genotype-by-social environmental interaction; GWA, genome-wide association; PA, predictive ability; SNP, single nucleotide polymorphism.
Table 1 Estimated quantitative genetic parameters for socialized individuals, socially isolated individuals, and for a joint analysis with the social rearing regime as a factor to determine potential genotype-by-social environment interaction
Parameters SOC:ISO SOC ISO
s2
P 0.89 0.81 0.97
s2
G 0.072*** 0.11*** 0.12***
s2
GE 0.049*** — —
s2
e 0.77 0.70 0.84
H2 0.14 0.14 0.12
rG 0.59 — —
rp 0.52 — —
The estimated parameters were the variance components (s2
P total phenotypic variance,s2
Ggenetic variance,s2G:Egenotype-by-social environment variance, and s2
Frq2) between the socialized environment and GSEI, and one
(cv-c) between socially isolatedflies and GSEI (Table S4).
Predictions within environment based on predictive feature sets
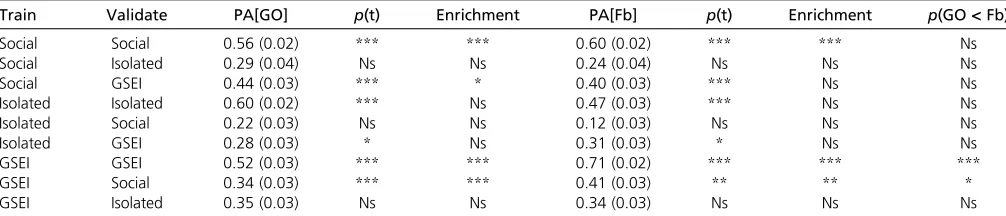
We determined the PA of a GFBLUP model where the feature group contained all predictive GO terms, or genes explaining
.10% of the genetic variance within the set of predictive GO
terms, within each environment, and for GSEI. In all cases,
these models performed significantly better than the NULL
model (Table 2). Forflies reared in the social environment,
the PA from GO terms (PA = 0.5660.02) was not signifi
-cantly different from the PA from top genes (PA = 0.606
0.02). However, the PA from GO terms (PA = 0.6060.02)
gave improved performance over top genes (PA = 0.47 6
0.03) for socially isolatedflies, while for GSEI, the PA from
top genes (PA = 0.7160.02) was better than that from GO
terms (PA = 0.5260.03) (Table 2). Next, we asked to what
extent these GO categories or genes were enriched for GWA
analysis variants (P,0:001) from the analysis of the whole
data set, thus, integrating association analyses and predic-tion. We found considerable enrichment for socially reared
flies and for GSEI, but not for socially isolatedflies (Table 2).
Predictions across environments
The genetic correlation of aggressive behavior between the
two social groups was significantly different from both zero
and one, indicating both a shared and distinct genetic basis of
aggression whenflies are reared separately or together. To the
extent that the same genes affect variation in aggression in the two environments, we expect that GO categories and genes that are predictive in one environment should also be dictive across environments. We used two methods for
pre-dicting across environments; the first was based on single
marker association results and the second on results from the GFBLUP and the genetic decomposition of GO terms to genes. Predictions based on bins of single marker regression P-values showed that when predictions were performed using the social environment as the training environment, the PA
increased within the social isolation environment (Figure
3A) at a P-value threshold of ,131025: However, when
the prediction models were trained on the socially isolated environment or GSEI, no improvement of PA was observed (Figure 3, B and C). The lack of improvement is not easily explained, other than the constraint of small sample size.
When we used the set of predictive GO terms or the subset
of genes capturing .10% of the genetic variance from the
social environment to predict aggression of flies reared in
isolation or vice versa, we found no significant improvement
over the NULL model (Table 2). However, we did find a
significant increase in PA over the NULL model when we used
the predictive GO terms or genes from the social environment to predict GSEI, and vice versa, and in both cases we found
that the predictive GO terms or genes (Table S3andTable
S4) were also enriched for associated single genetic variants
(Table 2).
By selecting the genes capturing .10% of the genetic
variance within the set of predictive GO terms, we expected an increased PA compared to the prediction models based on the complete set of predictive GO terms. However, this was only observed when training on GSEI and predicting within the social environment (Table 2), which indicates that more
genes with even smaller effects (,10%) are contributing to
the variation in aggressive behavior.
Discussion
This study was designed to determine the effect of social isolation on aggressive behavior; to investigate whether the effect of removing prior social experiences was genetically variable; and to gain insight to the genetic basis of this phenomenon by mapping the phenotypic variation of aggres-sive behavior in both social environments and the response to social isolation to genetic markers, genes, and GO terms.
Aggressive behavior and the effect of social isolation
Aggressive behavior has been studied in several model
sys-tems, such as mice (Miczeket al.2001), voles (Gobrogge and
Table 2 Within- and across-environment genomic predictions using the set of predictive gene ontology terms, or the set of genes explaining>10% of genetic variance within predictive gene ontology terms
Train Validate PA[GO] p(t) Enrichment PA[Fb] p(t) Enrichment p(GO<Fb)
Social Social 0.56 (0.02) *** *** 0.60 (0.02) *** *** Ns
Social Isolated 0.29 (0.04) Ns Ns 0.24 (0.04) Ns Ns Ns
Social GSEI 0.44 (0.03) *** * 0.40 (0.03) *** Ns Ns
Isolated Isolated 0.60 (0.02) *** Ns 0.47 (0.03) *** Ns Ns
Isolated Social 0.22 (0.03) Ns Ns 0.12 (0.03) Ns Ns Ns
Isolated GSEI 0.28 (0.03) * Ns 0.31 (0.03) * Ns Ns
GSEI GSEI 0.52 (0.03) *** *** 0.71 (0.02) *** *** ***
GSEI Social 0.34 (0.03) *** *** 0.41 (0.03) ** ** *
GSEI Isolated 0.35 (0.03) Ns Ns 0.34 (0.03) Ns Ns Ns
Wang 2011), zebrafish (Jones and Norton 2015), and fruit
flies (Chenet al.2002; Edwardset al.2006; Wanget al.2008;
Kravitz and Fernandez 2015; Shorteret al.2015), as well as
in humans (Caspi et al. 2002; Gallardo-Pujol et al. 2013;
Fernàndez-Castillo and Cormand 2016). In this study, we developed and used the Flydiator arena (Figure 1) to achieve high-throughput acquisition of aggressive behavior of multi-ple animals of the same genome-wide genotype. The design
of the Flydiator arena enabled us to keep twoflies within the
same arena but separated until the start of the assay (Figure 1A), allowing us to test the immediate effect of social iso-lation without the confounding effects of recent exposure
to CO2or excess aggravation from vigorous handling of the
flies.
Detection of genotype-by-environmental interaction in
general, and GSEI interaction in particular can be difficult
because of the need to control environmental factors and to test the same genotype in multiple environments. The DGRP is a resource that can mitigate both of these chal-lenges. Thus, it was possible to investigate the effect of social isolation on naturally occurring variation for aggres-sive behavior by combining the DGRP with the Flydiator arena.
Previous studies investigating the effect of social isolation
on aggressive behavior in fruitflies have reported increased
levels of aggressiveness whenflies were reared in a socially
isolated environment (Wanget al.2008; Zhouet al.2008;
Dankertet al.2009). The results of this study partially
sup-port these prior findings (Figure 2), and more importantly
demonstrate the existence of genetic variation in the effect of
social isolation, GSEI (Table 1). This finding is consistent
with human studies indicating a genotype-by-environment interaction between prior social experience and certain
ge-netic polymorphisms on aggressive behavior (Caspi et al.
2002; Gallardo-Pujolet al.2013).
Determining the genotype–phenotype map
With advances in sequencing technologies and reduced cost of genome sequence data acquisition, it has become increasingly important to develop new methods to identify genetic markers contributing to the variation in phenotypes, particularly when the majority of markers are expected to have individually small phenotypic effects. Single marker regression methods are extensively used to associate genetic markers with trait
variation (Hirschhorn and Daly 2005; McCarthyet al.2008).
However, as a consequence of multiple testing penalties, most of the signal will disappear and leave a large fraction of the true causal variants undetected. In addition, quantita-tive traits are likely to be genetically complex; thus, statistical methods that exploit prior information to group genetic
markers, such as set tests (Wanget al.2007, 2010a, 2011;
Mooneyet al.2014) or prediction models (Speed and Balding
2014; Edwardset al.2016; Sarupet al.2016), might be better
suited for identifying genomic features containing SNPs with small effects, and have the potential to improve biological inference.
The different statistical models have different pros and cons; therefore, applying a range of models might provide new insight into the distinctive layers of the underlying biology. Moreover, the choice of statistical model might also dictate the genetic model. Single marker regression models detect ge-netic markers with large effect sizes (Hirschhorn and Daly 2005), whereas genomic prediction using GBLUP assumes
an infinitesimal genetic model (Meuwissen et al. 2001).
The GFBLUP model is an intermediate between single marker
regression and GBLUP in that it assumes a quasi-infinitesimal
genetic model (Edwards et al. 2016). Because the genetic
model for a given complex trait is unknown, restricting the analysis to one type of statistical model will set a limit to what
can be identified given the model. Here, we used both single
marker regressions and GFBLUP to gain insight into the ge-netic basis of aggression in socialized and socially isolated individuals.
Previous work has demonstrated that prediction models incorporating prior biological information enriched for causal
variants can increase the PA of complex traits (Edwardset al.
2016; Sarup et al.2016; Fanget al. 2017). Recently it was
shown in the DGRP that the level of PA of complex traits depends on the underlying genetic architecture (Edwards et al.2016). An advantage of inbred reference populations is the ability to phenotype multiple animals of the same ge-notype, which increases the precision of the estimate of the genotypic value of each line and increases the broad sense
heritability, which in turn can increase the PA (Edwardset al.
2016). The measure of GSEI used in this study was based on mean differences in aggressive behavior between the two social rearing environments, resulting in loss of the replicated design, thus potentially limiting the PA of GSEI. However,
comparing the GBLUP predictive abilities forflies reared in
a socialized and socially isolated environment with the PA for GSEI did not indicate any reduction in predictive power.
Using the GFBLUP models resulted in a substantial increase
in predictive abilities (Figure 3 andTable S3). This was
some-what surprising given the small sample size. However, our
findings were robust in the sense that predictions based on
randomly selected SNPs did not increase the PA (Figure 3 and
Figure S7 inFile S1), and indicates that the predictive SNP
sets do tag causal variants. However, estimation bias and nonindependence among genomic features could contribute
to artificially high accuracies, similar to the overestimation of
variance explained by the predictive genes (Table S4), which
is known as the Beavis effect (Beavis 1998). In this case, the overestimation could also be due to some degree of noninde-pendence among the GO terms (i.e., genes and SNPs repre-sented within less than one GO term).
Previously, it has been shown that partitioning of genetic variance into multiple components can increase the PA (Speed
and Balding 2014; Tuckeret al.2015). The great increase in
separation of the true genetic signal and noise if the partition-ing is correct. Low predictive abilities are commonly seen for complex trait prediction when based on GBLUP, especially for
unrelated populations, such as humans (de los Camposet al.
2013; Speed and Balding 2014; Tuckeret al.2015).
There-fore, prediction models such as the GFBLUP model might provide similar improved results when applied to other data
sets and species. Here, the genomic features were specified
according to GO categories, but classifications based on
ex-pression profiles, protein–protein interactions, and other
types of“omic”data might also perform well.
Insights about the molecular genetic basis of natural variation for aggressive behavior
The single marker GWA regressions and the GFBLUP analyses of GO terms and genes give different perspectives about the genetic basis of naturally occurring aggressive behavior in
socialized and socially isolated flies. Only a few genetic
variants were associated with aggressive behavior in the two social environments and GSEI from the single marker regression analyses, and none of the individual variants or genes in close physical proximity to them was in common. However, the function of the genes harboring the index SNPs
had common functional themes. Both dally and spg were
associated with aggressive behavior in the social
environ-ment. dally affects the development of sensory organs
(Fujise et al. 2001), and spg is involved in the embryonic
development of the central nervous system (Biersmithet al.
2011).Rbfox1, which affects the development of the nervous
system, was associated with variation in aggression of flies
from the social isolation environment. Two genes associated with aggressive behavior in the socially isolated
environ-ment,CG34371andzormin, have been implicated in sensory
perception of pain (Neely et al.2010). Three of the genes
associated with GSEI were:osa, which is believed to be
in-volved in neurogenesis (Neumülleret al.2011);Ten-a, which
has shown to affect synaptic growth (Moscaet al.2012); and
trv, which has shown to regulate dendritic morphogenesis
(Honjoet al.2016). In addition, two of the associated genes
have previously been associated with sleep [CG13868and
DNaseII (Thimgan et al.2015)], and two have been found
to influence memory [Rbfox1(Guven-Ozkanet al.2016) and
Syn (Michels et al.2011). towwas found to be associated
with GSEI.towinteracts withfz, which has previously been
associated with Drosophila aggressive behavior (Edwards
et al. 2006; Shorteret al.2015), and was functionally vali-dated by RNA interference suppression of gene expression
(Shorteret al.2015).
As noted above, the statistical model used will impose a certain genetic model. Therefore, an overlap in the genes found with single marker regression and GFBLUP was not
expecteda priori, and only one gene,RecQ4, was found
as-sociated with GSEI using both methods (Table 3). GFBLUP, in combination with partitioning of predictive GO terms to the genes capturing a large fraction of the genetic variance,
iden-tified a large number of genes associated with GSEI and
aggressive behavior in both social environments. Two addi-tional sources of evidence can further strengthen the support for a subset of those genes. First, GO terms are constructed in a hierarchical structure (The Gene Ontology Consortium 2000), therefore a gene may be present in multiple GO terms.
If the same gene is identified within multiple GO terms, this
may indicate stronger support for the particular gene. Sec-ond, the positive genetic correlation between the two social conditions suggests some shared underlying genetic
mecha-nism, thus, an overlap in the genes identified would be
expected, which was also observed (Table 3).
Nine genes were present in two or three GO terms forflies
reared in a socialized environment (Table 3). Among these
were:AP-2s, which is involved in neurogenesis (Neumüller
et al.2011);Egfr, which is believed to be related to
differen-tiation of the nervous system (Kimet al.2015); a
transcrip-tion factor that promotes neural progenitors,pnt(Zhuet al.
2011);wg, which controls the growth of dendrites of
periph-ery sensory neurons (Liet al.2016);Frq2, which is believed
to control neurotransmitter secretion (Attrillet al.2016); and
sgl, which has been previously associated with Drosophila
aggressive behavior (Edwards et al. 2006). Three genes
(CG17821,CG31141, andElo68b), about which there is no prior knowledge, were also represented by two or more GO
terms in the social environment. For flies reared in social
isolation, only chb was present in multiple GO terms. chb
has been shown to mediate axon guidance (Lee et al.
2004). Two genes were represented by two and three GO
terms for GSEI,cv-candDys, both of which previously have
been associated with Drosophilaaggression (Edwardset al.
2006; Shorteret al.2015).
Four of the genes capturing .10% of the genetic variance
within the predictive GO terms were associated with
aggres-sion for both social environments (Table 3). These were:Egfr
(which was also represented in multiple GO terms, see
above); rhea, which regulates transcription (Bécam et al.
2005); and two genes about which there is no prior
molecu-lar or biological knowledge, Ady43A and CG2794. Three
genes were in common between flies reared in the social
environment and GSEI. These wereCASK,Dys, andFrq2;Dys
andFrq2were also were represented by multiple GO terms (see
above). CASKhas been shown to regulate neurotransmitter
release (Zordan et al. 2005) and affect locomotor activity
(Sunet al.2009; Slawsonet al.2011).cv-c(also represented by multiple GO terms, see above) was associated with both
GSEI and aggression of flies from the socially isolated
environment.
A total of 35 genes that were associated withDrosophila
aggressive behavior in any of the analyses performed in this
study (Table S3 andTable S4) have been associated with
Drosophila aggressive behavior in other studies (Table 3),
and eight of the genes identified in this study have orthologs
that have been previously associated with aggressive behav-ior in mice (Table 4). Furthermore, several of the genes with mouse orthologs affecting aggression were also previously
implicated in Drosophila aggressive behavior (kirre, ftz-f1,
andFas3) (Shorteret al.2015), suggesting that they are true
positive associations (Table 3 and Table 4). For all the genes
discussed here (Table 3 and Table 4), except forCG13868
andCG2794, we identified human orthologs using the Dro-sophila RNAi Screening Center Integrative Ortholog
Predic-tion Tool (Hu et al. 2011): 24% (14/59) of them have a
human ortholog that has previously been associated with human neurological disorders, such as bipolar disorder or schizophrenia (Table 3 and Table 4).
In summary, we established two social rearing conditions, a normally social and a socially isolated environment, and assayed aggressive behavior among a subset of DGRP lines for multiple individuals per line per environment in the Flydiator arena. We found that the genetic basis of aggression is in part shared between social environments, and in part genetically distinct within each environment. Furthermore, we provide evidence that the phenotypic response to social isolation is genetically variable, that is, evidence for GSEI. The phenotypic variation was mapped to individual genetic var-iants, genes, and GO terms. The large number of associated genes is consistent with a highly polygenic basis of aggressive behavior, with many genes with individually small effects. However, many of these genes have been previously associ-ated with other behavioral traits and neurological processes,
as well as with aggressive behavior inDrosophila. Candidate
genes identified in this study have mouse orthologs that have
been associated with aggressive behavior, and human ortho-logs with prior associations with neurological disorders.
Table 4 Summary of genes associated with aggressive behavior forflies reared in a socialized or socially isolated environment, or with GSEI using single marker regression or with genomic prediction, that have been associated with aggressive behavior in mouse models
DrosophilaGene Symbol DrosophilaGene Name SMR GFBLUP Mouse Ortholog Reference
cac cacophony S Cacna1b Kimet al.(2015), Murakamiet al.(2007)
dysfa dysfusion I Npas4 Coutellieret al.(2012)
Fas2b Fasciclin 2 I Ncam1 Storket al.(1997, 2000)
Fas3 Fasciclin 3 G Cadm1 Takayanagiet al.(2010)
ftz-f1 ftz transcription factor 1 S Nr5a1 Grgurevicet al.(2008)
kirre kin of irre S Kirrel3 Princeet al.(2013)
loco locomotion defects S Rgs2 Oliveira-Dos-Santoset al.(2000)
rst roughest S Kirrel3 Princeet al.(2013)
SMR, single marker regression; GFBLUP, genomic feature best linear unbiased prediction; S, socialized; I, socially isolated; GSEI, genotype-by-social environmental interaction. aThe human ortholog is NPAS4, which has been associated with bipolar disorder (Psychiatric GWAS Consortium Bipolar Disorder Working Group 2011).
Thus, thesefindings suggest a partially conserved mechanism for aggressive behavior across animals, but also between an-imal aggression and human psychiatric disorders resulting in altered, undesirable behaviors.
Acknowledgments
This study was in part funded by grants from the Lundbeck Foundation (R155-2014-1724) the Danish Strategic Re-search Council (GenSAP: Centre for Genomic Selection in Animals and Plants, contract no. 12-132452) to P.S. and T.F. C.M., and the National Institutes of Health (R01-AA016560 and R01-AG043490) to T.F.C.M.
Literature Cited
Allen, H. L., K. Estrada, G. Lettre, S. I. Berndt, M. N. Weedonet al., 2010 Hundreds of variants clustered in genomic loci and bi-ological pathways affect human height. Nature 467: 832–838. Attrill, H., K. Falls, J. L. Goodman, G. H. Millburn, G. Antonazzo
et al., 2016 FlyBase: establishing a gene group resource for
Drosophila melanogaster. Nucleic Acids Res. 44: 786–792.
Bates, D., M. Mächler, B. M. Bolker, and S. C. Walker, 2015 Fitting linear mixed-effects models using lme4. J. Stat. Softw. 67: 1–48. Beavis, W. D., 1998 QTL analyses: power, precision, and accuracy, pp. 145–162 inMolecular Dissection of Complex Traits, edited by A. H. Paterson. CRC Press, New York.
Bécam, I. E., G. Tanentzapf, J.-A. Lepesant, N. H. Brown, and J.-R. Huynh, 2005 Integrin-independent repression of cadherin transcription by talin during axis formation inDrosophila. Nat. Cell Biol. 7: 510–516.
Biersmith, B., Z. C. Liu, K. Bauman, and E. R. Geisbrecht, 2011 The DOCK protein sponge binds to ELMO and functions
in Drosophila embryonic CNS development. PLoS One 6:
e16120.
Blumstein, D. T., J. C. Daniel, and C. S. Evans, 2012 Jwatcher TM (version 1.0). Available at: http://www.jwatcher.ucla.edu. Ac-cessed: February 2014.
Byrne, E. M., P. R. Gehrman, S. E. Medland, D. R. Nyholt, A. C. Heathet al., 2013 A genome-wide association study of sleep habits and insomnia. Am. J. Med. Genet. B. Neuropsychiatr. Genet. 162B: 439–451.
Carlson, M., 2015 org.Dm.eg.db: Genome wide annotation for Fly. (R package version 3.2.3).
Caspi, A., J. McClay, T. E. Moffitt, J. Mill, J. Martin et al., 2002 Role of genotype in the cycle of violence in maltreated children. Science 297: 851–854.
Chen, S., A. Y. Lee, N. M. Bowens, R. Huber, and E. A. Kravitz, 2002 Fighting fruitflies: a model system for the study of ag-gression. Proc. Natl. Acad. Sci. USA 99: 5664–5668.
Clark, S. L., D. E. Adkins, K. Aberg, J. M. Hettema, J. L. McClayet al., 2012 Pharmacogenomic study of side-effects for antidepressant treatment options in STAR*D. Psychol. Med. 42: 1151–1162. Coutellier, L., S. Beraki, P. M. Ardestani, N. L. Saw, and M.
Sham-loo, 2012 Npas4: a neuronal transcription factor with a key role in social and cognitive functions relevant to developmental disorders. PLoS One 7: e46604.
Dankert, H., L. Wang, E. D. Hoopfer, D. J. Anderson, and P. Perona, 2009 Automated monitoring and analysis of social behavior in
Drosophila. Nat. Methods 6: 297–303.
de Leeuw, C. A., B. M. Neale, T. Heskes, and D. Posthuma, 2016 The statistical properties of gene-set analysis. Nat. Rev. Genet. 17: 353–364.
de los Campos, G., A. I. Vazquez, R. Fernando, Y. C. Klimentidis, and D. Sorensen, 2013 Prediction of complex human traits using the genomic best linear unbiased predictor. PLoS Genet. 9: e1003608. Edwards, A. C., S. M. Rollmann, T. J. Morgan, and T. F. C. Mackay, 2006 Quantitative genomics of aggressive behavior in
Dro-sophila melanogaster. PLoS Genet. 2: 1386–1395.
Edwards, A. C., L. Zwarts, A. Yamamoto, P. Callaerts, and T. F. C. Mackay, 2009 Mutations in many genes affect aggressive be-havior inDrosophila melanogaster. BMC Biol. 7: 1–13.
Edwards, S. M., B. Thomsen, P. Madsen, and P. Sørensen, 2015 Partitioning of genomic variance reveals biological path-ways associated with udder health and milk production traits in dairy cattle. Genet. Sel. Evol. 47: 60.
Edwards, S. M., I. F. Sørensen, P. Sarup, T. F. C. Mackay, and P. Sørensen, 2016 Genomic prediction for quantitative traits is improved by mapping variants to gene ontology categories in
Drosophila melanogaster. Genetics 203: 1871–1883.
Ehsani, A., L. Janss, D. Pomp, and P. Sørensen, 2015 Decomposing genomic variance using information from GWA, GWE and eQTL analysis. Anim. Genet. 47: 165–173.
Fabbri, C., and A. Serretti, 2016 Genetics of long-term treatment outcome in bipolar disorder. Prog. Neuropsychopharmacol. Biol. Psychiatry 65: 17–24.
Falconer, D. S., and T. F. Mackay, 1996 Introduction to
Quantita-tive Genetics, Ed. 4. Longman Group, Harlow, Essex.
Fang, L., G. Sahana, P. Ma, G. Su, Y. Yuet al., 2017 Exploring the genetic architecture and improving genomic prediction accuracy for mastitis and milk production traits in dairy cattle by mapping variants to hepatic transcriptomic regions responsive to intra-mammary infection. Genet. Sel. Evol. 49: 1–18.
Fernàndez-Castillo, N., and B. Cormand, 2016 Aggressive behavior in humans: genes and pathways identified through association studies. Am. J. Med. Genet. B. Neuropsychiatr. Genet. 171: 676–696. Fridley, B. L., and J. M. Biernacka, 2011 Gene set analysis of SNP
data: benefits, challenges, and future directions. Eur. J. Hum. Genet. 19: 837–843.
Fujise, M., S. Izumi, S. B. Selleck, and H. Nakato, 2001 Regulation
of dally, an integral membrane proteoglycan, and its function
during adult sensory organ formation ofDrosophila. Dev. Biol. 235: 433–448.
Gallardo-Pujol, D., A. Andrés-Pueyo, and A. Maydeu-Olivares, 2013 MAOA genotype, social exclusion and aggression: an ex-perimental test of a gene-environment interaction. Genes Brain Behav. 12: 140–145.
Gentleman, R. C., V. J. Carey, D. M. Bates, B. Bolstad, M. Dettling
et al., 2004 Bioconductor: open software development for
computational biology and bioinformatics. Genome Biol. 5: R80. Gobrogge, K. L., and Z. W. Wang, 2011 Genetics of aggression in
voles. Adv. Genet. 75: 121–150.
Goddard, M., 2009 Genomic selection: prediction of accuracy and maximisation of long term response. Genetica 136: 245–257. Goes, F. S., J. McGrath, D. Avramopoulos, P. Wolyniec, M.
Pirooz-niaet al., 2015 Genome-wide association study of
schizophre-nia in Ashkenazi Jews. Am. J. Med. Genet. B. Neuropsychiatr. Genet. 168B: 649–659.
Grgurevic, N., T. Büdefeld, S. A. Tobet, E. F. Rissman, and G. Maj-dic, 2008 Aggressive behaviors in adult SF-1 knockout mice that are not exposed to gonadal steroids during development. Behav. Neurosci. 122: 876–884.
Guven-Ozkan, T., G. U. Busto, S. S. Schutte, I. Cervantes-Sandoval, D. K. O’Dowd et al., 2016 MiR-980is a memory suppressor microRNA that regulates the autism-susceptibility geneA2bp1. Cell Rep. 14: 1698–1709.