Available online: https://edupediapublications.org/journals/index.php/IJR/ P a g e | 1386
Performance Analysis of Peak Cancellation Scrambling Technique
for Interference Reduction in Communication System
U Himavarsha
M.E, Assistant Professor Department of ECE, Stanley College of Engineering and Technology for women, Chapel Rd, Abids, Telangana
Abstract
---
PAPR is the major drawback of OFDM technique which is under consideration of LTE development. There are different techniques which are developed to reduce the PAPR in OFDM system. The different techniques include signal distortion techniques, signal scrambling techniques and signal coding techniques. This proposed work is under consideration of signal distortion technique. This proposed work is having hardware implementation very less but it produces in-bad and out-of band distortions. To overcome this drawback of in-band and out-of-band distortions we developed this work which is used to get cancelling pulses as well as to get the envelope threshold with peak cancellation is applied. To get its validity and limitations we applied peak cancellation to band limited OFDM signal. We developed level crossing rate to get achievable SDR (signal to distortion ratio).Again to check performance we applied different parameters such as ACLR (adjacent channel leakage ratio ),EVM(error vector magnitude) and SER( symbol error rate) which are applied to additive white Gaussian noise channel(AWGN).Proposed work is compared with state of art existing techniques to get the performance study of proposed work. Finally, with the help of simulation results in MATLAB we can prove that proposed work outperforms compared to existing techniques.Index Terms—error vector magnitude (EVM), Adjacent channel leakage ratio (ACLR), peak-to-average power ratio (PAPR), orthogonal frequency division multiplexing (OFDM), signal-to-distortion power ratio (SDR), symbol error rate (SER).
I. Introduction
OrthogonalFrequency Division Multiplexing (OFDM) is considered under development of LTE(long term
evolution) which is commonly used in wireless communication systems due to its key advantages such as its too flexibility as well as bandwidth efficiency. As OFDM signal is divided in frequency domain into number of small chunks, its probability density function (pdf) in time domain gives us Gaussian distribution function. Theseare strict demands on the dynamic range of data converters and high data rate.
Available online: https://edupediapublications.org/journals/index.php/IJR/ P a g e | 1387 intractable PAPR regrowth. Also, PC (peak cancellation)
does not cause any PAPR regrowth but it may cause out-of-band radiation due to the cancelling pulses. By the particular algorithm for cancelling pulses the PAPR can be reduced while the out-of-band radiation is kept negligible. Moreover, there is no need to use an additional filter (which contains a number of multipliers) for the special work out-of-band suppression, Peak cancellation is having lower complexity than CAF (clipping and filtering) when it is implemented by hardware [8], [9]. Our related paper [10] demonstrates a low-complexity real time development of PC techniques using FPGA kit. Applications of the PC concept may be further used for development of other PAPR reduction techniques which include active constellation extension and tone reservation, etc.
In the proposed work, we theoretically studied the performance of an OFDM system with PC by using different mathematical modules to overcome the limitations. The baseband OFDM signal which is considered as input for transmission is characterized as a band-limited complex Gaussian process, a derivation of signal to- distortion power ratio (SDR) is firstly derived based on the level-crossing rate approximation of the peak distribution in OFDM system. After that by analyzing a cancelling pulse function, we used ACLR and EVM of the OFDM signal after PC are calculated to get the better performace. These results obtained are easily given to the threshold level that can meet the distortion requirement (in terms of SDR, EVM, and ACLR). The output of these are then used for deriving the symbol error ratio (SER) for OFDM system with M-ary quadrature amplitude modulation (M-QAM), transmitted through the given channel additive white Gaussian noise (AWGN) channel in the presence of PC. The performance of all the theoretical and execution results developed here are confirmed by the corresponding method outperform for PAPR reduction.
I. Proposed Work
A. OFDM Signal Formulation
Let A={A0, A1, . . , AN−1} denote the data sequence with huge data to be transmitted by one OFDM symbol with total N subcarriers, where Ak represents the complex data
of the kth subcarrier for transmission. The complex baseband OFDM symbol can be expressed as,
S t = ej∅t 1
N Ake j2π kt
Ts , 0 ≤ t ≤ Ts (1)
N−1
k=0
Here, Ts is nothing but one symbol period without use of guard interval.
Fig.1. A Block Diagram Of PC Implementation Using Hardware
B. Peak Cancellation Model
The principle considerations for development of PC are to generate cancelling pulses at the time instances where the peaks are occurring higher than the predetermined threshold γ calculated and to subtract them from the original signal to get final only peaks which we have to eliminate. An example block diagram suitable for practical implementation is given in [10] which are depicted in given figure. Finally, we denote the polar expression of the OFDM signal by s(t) = r (t)e ^jθ(t), where, r (t) and θ(t) are respectively represent the envelope and phase of the original signal s(t). Suppose that there are in all Nρ(γ ) peaks that are higher than the give threshold γ in the envelope process r (t) during the transmission of one OFDM symbol interval, and let ti denote the time instant for observing ith peak ,where i ∈ {1, 2, . . . , Nρ(γ )}. The signal after application of peak cancellation can be given as below,
𝑠𝑐 𝑡 = 𝑠 𝑡 − 𝑃𝑖 𝑡 − 𝑡𝑖 (5) 𝑁(𝛾) 𝑖=1 ⋮ - + d d d d d d d d d d d d d d d d d d d d d d d d d d d d d d d d d d d Delay Peak
Available online: https://edupediapublications.org/journals/index.php/IJR/ P a g e | 1388 where pi (t) is nothing but the cancelling pulse
corresponding to the ith peak for a given appropriate time shift such that pi (t) has a peak at t = 0, and p(t) is the sum of all the cancelling pulses for a given OFDM symbol. In this proposed work, we can express the ith cancelling pulse as given below,
Pi (t) = (ρi-ϒ)ej∅ig(t) (6)
Where, ρi=r(ti), ∅i= θ(ti),and g(t) is known as impulse response function, which is nothing but cancelling pulse kernel. Therefore, we alternatively refer to γ as the target PAPR in what follows. By observing the results obtained one can find that the distortion caused by PC depends on g(t) as well as the target PAPR γ.
C. Signal-To-Distortion Power Ratio Analysis Of Peak Cancellation For OFDM Signals
Assuming that the OFDM signal used for transmission is approximated by a complex Gaussian random process, the standard approach for statistical characterization of the signal after nonlinear processing is the use of Bussgang‟s theorem. We model the OFDM signal after PC as a linear transform of the input signal and additive distortion.
Sc(t)=𝛼𝛾𝑠 𝑡 + 𝑑 𝑡 (7)
Where,d(t) is distortion term and 𝛼𝛾 is attenuation factor
which is depend upon threshold 𝛾. SDR is derived I some references as,
SDR =E{ 𝛼𝛾𝑠 𝑡 2
}
E{ d 𝑡 2} =
𝛼𝛾2
Pav ,d (8)
c.1 Level-Crossing Rate Approximation of Peak Distribution
The generation of cancelling pulses is the phenomenon which depends on the event that the peaks beyond a given threshold happen. Therefore, the knowledge of the height distribution of OFDM signals is critical for calculations. However, as mentioned in [2], although we tend to assume the baseband OFDM signal as a band-limited for the proposed work and is complicated Gaussian process, the precise variety of peak distribution is difficult and may not be expressed in an exceedingly closed kind of expressions.
Notwithstanding, the level crossing rate of a Gaussian method will be delineate in an exceedingly closed kind following the work of the give work [25]. For a strictly band limited OFDM signal, the typical variety of positive crossings of a given level r per OFDM symbols is given as below,
𝑉𝑐+ 𝑟 = 𝜋
3 𝑁 𝑇𝑠 𝑟. 𝑒
−𝑟2 (9)
C.2 Attenuation Factor Expression Based on Peak Shape Approximation
Recall that for a given threshold γ, Nρ(γ ) denotes the total number of the peaks above γ threshold during one OFDM symbol period. Conditioned that we observe Nρ(γ ) peaks and by referring to (5), the cross-correlation term αγ in (9) can be given as below,
𝛼𝛾= 𝐸 𝑆∗ 𝑡 𝑆𝑐 𝑡 ⊥ 𝑁𝜌 𝛾
= 𝐸 𝑆∗ 𝑡 ( 𝑆 𝑡 − 𝑝(𝑡) ⊥ 𝑁
𝜌 𝛾
= 1
− 𝐸 𝑆∗ 𝑡 𝑃 𝑡 − 𝑡𝑖 ⊥ 𝜌 𝑖 𝑁𝜌 𝛾
𝑖=1
> 𝛾 (10)
c.3 Closed-Form Expression of Attenuation Factor
Considering the given asymptote of N →∞ and taking the time average, together with resorting to the strong law of large numbers which is simply given I some references as below,
𝛼𝛾 ≈ 1 − 𝐸 𝑁𝜌 𝛾 𝐶 𝛾 𝛽} (11)
In this proposed work, we consider a band-limited OFDM signal which is having rectangular-like spectrum. Therefore, a sinc function with the same bandwidth can be used to approximate the cancelling pulse kernel, as shown below,
g t = w t sinc t
T , − ∞ < 𝑡 < ∞ (12)
Available online: https://edupediapublications.org/journals/index.php/IJR/ P a g e | 1389 c.4 Distortion Power Analysis based on
Level-Crossing Rate Approximation
Collecting the detailed information about the results and noticing that αγ has a real value, we obtain below,
𝑃𝑎𝑣, 𝑑 = 2𝛼𝛾− 1 − 𝛼𝛾 2
+ 𝐸 𝑁𝜌 𝛾 𝐵 𝛾 𝜂} (13)
This indicates that the proposed work having distortion term is dependent on the length of the window function n. Finally, we get the closed-form expression of SDR which can be obtained as a function of n and γ , i.e.,
SDR n, 𝛾 = 3Π − si 2Π 𝛾𝑒
−𝛾2
+ Π erfc 𝛾 2
3π erfc 𝛾 si 2nπ − 𝑒−2𝛾2
𝛾 + 𝑒𝛾2
Πerfc 𝛾 2si 2Π 2
14
For n=1,2,3,…
D.
In-Band And Out-Of-Band Distortion
Analysis
A finite-length property of a cancelling pulse kernel generated by the application of PC causes spurious in the signal power spectrum after PC. Since the adjacent power present in symbol is generally subject to a regulatory constraint, an analysis of the out-of-band performance due to the use of PC plays an important role for the reduction of distortions present in system. In this section, we observed that the effect of the cancelling pulse on the ACLR. We can derive an EVM expression that takes into account only the in-band distortion for OFDM system.
D1.Length of Cancelling Pulse Kernel
Finally, a longer cancelling pulse kernel can be used to achieve lower out-of-band level which is derived by mathematical module, but this increases implementation cost as well as degrades the EVM performance. Therefore, overall analysis of out-of-band distortion associated with the candidate cancelling pulse kernel is important for further detailed analysis.
For the cancelling pulse kernel represented by g(t) defined, its power spectrum density (PSD) Sg( f ) can be calculated as give below,
D2.ACLR Analysis
The previous description about the ACLR has shown that larger n generally leads to lower out-of-band emission, but it also results in several in-band distortions with higher hardware complications. If there occur a peak higher than the threshold becomes a rare event, the out-of-band power added to the original signal should be very less in comparison. Consequently, the integer n need not be necessarily very large to meet the spectral requirement. If we assume that the original signal has sufficiently low out-of- band level, the ACLR of the PC output signal is given by the cancelling pulses that are added to the input signal. As discussed previously we have to adjust the each cancelling pulse kernel to the observed peak level, the out-of-band power caused by the cancelling pulses is related to the statistical distribution of the peaks.
In this proposed work, the average value of PSD of the peak cancelling signal is considered for the calculation of ACLR. Observing that 1) each cancelling pulse present I the data given by pi (t) becomes zero or has negligibly small value as |t| increases and 2) the two distinct cancelling pulses pi (t − ti ) and p j (t − t j ) are having temporal separation as the threshold γ increases, it may be important to assume that the cross correlation among the peak cancelling pulses are negligible. Therefore, the autocorrelation function of p(t) can be derived as shown below,
Rp τ = Rpi(τ)
𝑁𝜌 𝛾
i=1`
(15)
D3. EVM Analysis
In wireless communication, EVM is a commonly adopted measure of the in-band distortion. Also it can be approximated by the effective SDR as shown below,
EVM= 1
𝑆𝐷𝑅𝑒𝑓𝑓 ∗ 100% (16)
D4. SER over an AWGN Channel
SNR is given by the following equation,
𝑆𝑁𝑅 =𝐸{ 𝑠(𝑡)
2}
Available online: https://edupediapublications.org/journals/index.php/IJR/ P a g e | 1390 We can prove that the equivalent average in-band signal
power to be transmitted is denoted by (1−C(γ))+ C(γ )α2 γ . Considering these all assumptions, for an ideal receiver with perfect synchronization, the SER is calculated by general function of modulation order M and SNR as shown below,
Pe (SNR) = f (M, SNR) (18)
III.
SimulationResults
Fig. 2. Example waveforms associated with PC where ρi denotes the envelope level of the ith peak.
The above figure gives us the performance waveforms of different signals with respect to time in ms. Black line „samples‟, signal „s‟, peak threshold, peak „p‟.
Fig. 3. A cancelling pulse kernel considered for the proposed work is generated for the given oversampling rate J = 4. The black dots show that the special cases of the n having integer values.
This graph will shows us the cancelling pulse kernel is generated with time/frequency axis. The dots cutting at the horizontal line shows us that those are having integer values.
Fig. 4. Relationship between the ACLR and the length n of a cancelling pulse kernel g(t); a sinc function is used as the cancelling pulse kernel.
Available online: https://edupediapublications.org/journals/index.php/IJR/ P a g e | 1391 Fig. 5. Averaged PSD (Power Spectral Density) of the
cancelling pulses for given values of n = 5, γ = 4dB, and J = 8, where Din and Dout are main regions of occupied and adjacent channels shown in figure and BSP denotes the channel spacing between them. There is bandwidth is bandwidth normalization by the inverse of the Nyquist interval, i.e., 1/T , which is similar as the bandwidth of the in-band OFDM signal as shown above.
Fig. 6. Performance of attenuation factor αγ with respect to different target PAPR γ .
This figure will give us that how that attenuation factor alpha behaves with the change in gamma.
Fig. 7. SDRs with respect to different target PAPR γ .
SDR (Signal to Distortion) performance is checked here. As we can see in graph there is exponential changes in increment of SDR with increase in Gamma value.
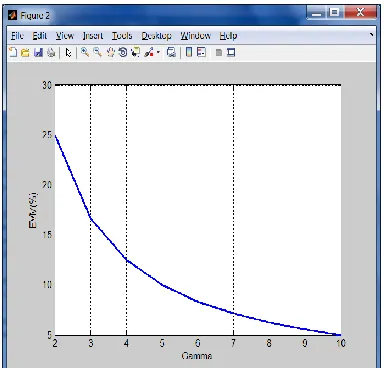
Fig. 8. Simulated and theoretical EVM with respect to different target PAPR γ .
Above figure shows that the performance of the EVM (Error Vector Magnitude) with respect to different gamma values. This graph can show that the EVM is decreasing with respect to gamma value.
Fig. 9. SDR with respect to the length of cancelling pulse n under different target PAPR γ .
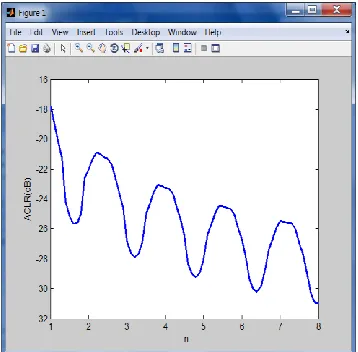
Available online: https://edupediapublications.org/journals/index.php/IJR/ P a g e | 1392 Fig. 10. ACLRs with respect to different pulse length n
under different target PAPR γ
Here in this figure there is performance of ACLR (dB) with different gamma thresholding values is compared. As we observed in above figure ACLR is decreasing with increment of gamma value.
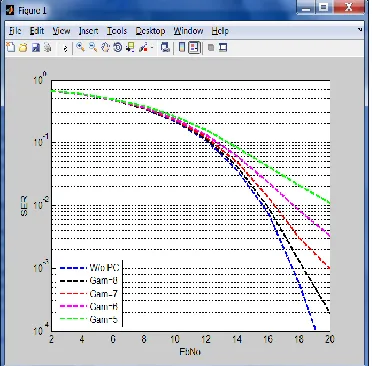
Fig. 11. SER over an AWGN channel with respect to different target PAPR γ of 16-QAM OFDM signals in the presence of PC.
In the above figure we plotted the graph of SNR vs. SER (symbol error rate).We used here in proposed work AWGN channel. This proposed work of peak cancellation with different thresholding value gamma is compared with existing technique without peak cancellation.
IV.EXTENSION RESULTS (SUI CHANNEL)
SUI channel modeling is nothing but it is used for optimization of transmission results. In modeling of the channel we can use the parameters such as antenna diversity, antenna correlation, antenna gain, etc.SUI modeling having in all six modeling conditions but in this work we proposed SUI-3 channel modeling.
Fig.12 SNR vs. SER for the extension (SUI channel model).
In this figure we compared proposed work with different gamma values and without using Peak Cancellation. Here, we can observe that extension work using SUI channel will provide optimized results and it outperforms compared to state of art existing techniques.
V.C
onclusion
Available online: https://edupediapublications.org/journals/index.php/IJR/ P a g e | 1393
References
[1] R. van Nee and R. Prasad, OFDM for Wireless Multimedia Communications. Norwood, MA, USA: Artech House, 2000.
[2] H. Ochiai and H. Imai, “On the distribution of the peak-to-average power ratio in OFDM signals,” IEEE Trans. Commun., vol. 49, no. 2, pp. 282– 289, Feb. 2001.
[3] T. Hentschel, M. Henker, and G. Fettweis, “The digital front-end of software radio terminals,” IEEE Pers. Commun., vol. 6, no. 4, pp. 40–46, Aug. 1999.
[4] ETSI 3rd Generation Partnership Project (3GPP), “User equipment (UE) radio transmission and reception,” The European Telecommunications Standards Inst., Sophia-Antipolis, France, TS 136.101, Jun. 2011.
[5] R. Bauml, R. F. H. Fischer, and J. Huber, “Reducing the peak-to-average power ratio of multicarrier modulation by selected mapping,” Electron. Lett., vol. 32, no. 22, pp. 2056–2057, Oct. 1996.
[6] H. Ochiai and H. Imai, “Performance analysis of deliberately clipped OFDM signals,” IEEE Trans. Commun., vol. 50, no. 1, pp. 89–101, Jan. 2002.
[7] X. Li and L. J. Cimini, “Effects of clipping and filtering on the performance of OFDM,” in Proc. IEEE Veh. Technol. Conf. (VTC‟97), May 1997, vol. 3, pp. 1634–1638.
[8] T. May and H. Rohling, “Reducing the peak-to-average power ratio in OFDM radio transmission systems,” in Proc. IEEE Veh. Technol. Conf. (VTC‟98), May 1998, vol. 3, pp. 2474–2478.
[9] J. Song and H. Ochiai, “FPGA implementation of peak cancellation for PAPR reduction of OFDM signals,” in Proc. IEEE Int. Conf. Commun. Syst. (ICCS‟14), pp. 414– 418, Nov. 2014.
[10] J. Song and H. Ochiai, “A low-complexity peak cancellation scheme and its FPGA implementation for peak-to-average power ratio reduction,” EURASIP J. Wireless Commun. Netw., vol. 2015, pp. 1–14, Mar. 2015.