Journal of Criminal Law and Criminology
Volume 15 | Issue 3
Article 10
1925
American White Criminal Intelligence
Carl Murchison
Follow this and additional works at:
https://scholarlycommons.law.northwestern.edu/jclc
Part of the
Criminal Law Commons
,
Criminology Commons
, and the
Criminology and Criminal
Justice Commons
This Article is brought to you for free and open access by Northwestern University School of Law Scholarly Commons. It has been accepted for inclusion in Journal of Criminal Law and Criminology by an authorized editor of Northwestern University School of Law Scholarly Commons.
Recommended Citation
CARL M RCHISON2
CHAPTER 7
THE LITERACY OF THE CRIMINAL
As is well known, the standards of school instruction vary widely
in different communities. Seven years in some schools is worth nuch
more than eight years in some other schools. It is also true that some
high school graduates are better educated at the end of their high
school course than are some.individuals at the completion of two years
in college. Such known variations in instruction make it unnecessary
that criminal literacy be reported in detail year by year. The sixteen
years of school life can better be reported in unit groups of two or
more years each. In this chapter the following division will be used:
Grade
Group or Years
1 ... 0- 2
2 ...
3- 4
3 ... 5- 6
4
... ...
7- 8
5 ... 9-11
6 ... 12-14
7 ... 15-16
There may be some objections to this classification, but it is the
one that seems to be most acceptable for reporting the Army data.
Of course, it is the Army data that must serve as norms in the
dis-cussion of problems of this character. In the remainder of this
chap-ter the lichap-teracy groups will be referred to by number.
1. Grass Comparison of Army and Criminal Data. In reporting
the Army data all cases of more than sixteen years' schooling will be
reported as having had sixteen years-will be reported in Group 7.
This plan will be followed in the case of the criminal data also. On
page 750, volume 15, of the Memoirs, 1921, is given the Army data
from which the following classification of Army literacy is made:
'This concludes the study that was begun in the last number.
2
Literacy Group
Years
in School Army Cases Percentage
1 ... 530 1.
2 ... 3,723 7.2
3 ... 10,346 20.
4 ... ... 23,078 44.7
5 ... 8,278 16.
6 ... 4,331 8.4
7 ... 1,334 2.6
It is seen that the above classification gives a fairly "normal" distribution 6f the 51,620 Army cases of the sample. It is seen that 11% of the Army cases are high school graduates and college men. However, the curve is not skewed towards the upper end, there being 27% superior to the mode and 28.2% inferior to the mode. This is as good a norm distribution of the Army cases as the writer could make. The eighth grade in school is the great literacy watershed, and deter-mines the numerical superiority of Group 4 above. The Army data is taken at its face value as the Army data, and no attempt is made to interpret the extent to which such data is representative of the rest of the country. Even thus restricted, the problem is quite large enough. Let us now observe the literacy distribution of the entire group of criminal cases being treated in this book.
Literacy
Group Criminal Cases Percentage
1 ... 113 2.9
2 ... 653 16.6 3 ... 1,095 7.8 4 ... 1,433 36.4 5 ... 455 11.6
6 ... ... 150 3.8
7 ... 33 .8
For easy comparison and personal convenience let us place to-gether the Army and the criminal percentages.
Literacy Percentage Percentage
Group of Army of Criminals
1 ... 1. 2.9
2 ... 7.2 16.6
3 ... 20. 27.8 4 ... 44.7 36.4
5 ... 16. 11.6
6 ... 8.4 3.8 7 ... 2.6 .8
A still more startling comparison is as follows:
Percentage Inferior Percentage Superior
to Group 4 to Group 4
28.2 Army 27.
The criminal group is skewed very decidedly towards the lower
end of the scale. This is all the more remarkable when we remember
that the criminals are superior in intelligence to the same Army group.
However, the difference in educational attainments is far greater than
is the difference in Alpha scores. It is greatly to be regretted that we
do not have the literacy distribution of the Army Group in terms of
states or geographical divisions. It is the belief of the writer that the
differences would be still greater in that case.
The writer is glad of the opportunity to admit that these results
contradict certain statements made in his own previous publications.
Those statements were made before the publication of the Memoirs
referred to above, and were based on data gathered from supposedly
reliable sources. The writer is not embarrassed by the admission, but
makes it cheerfully.
In fact, the opportunity to destroy one's own
mistakes gives great pleasure that is unmixed with pain to any one else.
2. The Literacy of the Home Grown Criminal As Compared with
the Criminal Incarcerated Outside His Home State. It may occur to
the more thoughtful reader that the fundamental difference between
the criminal and the law-abiding citizen can be expressed in terms of
literacy. If the reader is of the reformer type, there occurs to him at
once a vision of the possibility of driving crime from the world.
Higher education for the masses will become for him a challenge to
duty. But there never has been a simple panacea for any ill, and there
probably never will be. America holds a larger percentage of
crimi-nals than any other civilized nation, and America has made popular
the growing custom of higher education for the masses.
Let us now compare the home grown criminal with the other kind
in terms of literacy:
"
Literacy
Cases
Cases
Percentage
Percentage
Group
at Home
Away
of Former
of Latter
1 ... 81 32 3.4 2.
2 ... 394 259 16.6 16.5
3 ... 722 373 30.5 23.8
4 ... 854 579 36. 37.
5 ... 242
213
10.2
13.6
6 ...
63
87
2.6
5.5
7 ... 11 22 .5 1.4
To make the comparison more easy:
Percentage Inferior
Percentage Superior
to Group 4
to Group 4
50.5
Homie
13.3
42.3 Away 20.5
prob-lem of literacy as in the probprob-lem of intelligence itself. Higher
educa-tion for the masses would not eliminate this geographical difference.
Certainly it is not merely a coincidence that the criminals incarcerated
outside their home state have more than twice as large a percentage
of high school graduates and college trained men amongthem than
have the home grown criminals. It would seem that the problem grows
more complex instead of more simple. There may be literacy
differ-ences in the type groups, which would still more complicate the
problem.
3. The Literacy of Type Groups. Let us now consider the
dis-tribution into literacy groups of the seven type crime groups. We
shall begin with the "fraud group."
Literacy
Cases
Group of Fraud Percentage
1 ... 2 .6
2 ... 28
8.4
3 ... 66 20.4 ...
116
34.6
5 ...
62
18.5
6 ... 41
12.2
7 ... 20
6.3
The "fraud group" is markedly superior to the Army group in
literacy. Let us make it clear in this way:
Percentage Inferior Percentage Superior
to Group 4 to Group 4
28.2 Army 27.
29. Fraud Group 37.
The glittering generalities concerning the relative literacy of
crim-inals and the population in general seem to disappear when we
con-template the relative literacy of the "fraud group" and the Army
group. Once more it may be remarked that perhaps there is no such
.thing as a general criminal class.
Let us continue with the second type group, the "force" group.
This group, we will remember, is more like group one in intelligence
than are any of the other groups. Yet there is a decided difference
in literacy. In fact, this group is one of the least literate.
Literacy
Cases of
Group "Force" Percentage
1 ... 37 2.4
2
... 241
15.8
3 ... 455 29.84 ... 579 38.
5 ... 179
11.7
6 ... ... 30 1.9
In this group, 48% are inferior to group 4, while 13.9% are
su-perior to the mode. This makes a most decided skew towards the left
end of the curve-in marked contrast to the "fraud group."
Following is the distribution of the third group, the "thievery
group":
Literacy Cases of
Group "Thievery" Percentage
1 ... 27 2.7
2 ... 168 16.8 3 ... 257 25.7 4 ... 379 37.9
5 ... 128 12.8
6 ... 44
4.4
7 ...
2
.2
It is noticed that high school graduates and college trained men
are more likely to steal than they are to commit robbery or burglary.
But, of course, educated criminals are most likely to obtain property
by fraud.
The fourth group, or "statutory group," will be considered next:
Literacy Cases of the
Group "Statutory Group" Percentage
1
...
4
2.1
2 ... 31
16.6
3 ... 59 31.5
4
... 67 35.85 ...
18
9.6
6
... 8 4.37 ...
0
The small number of cases might account for the lack of college
graduates, but it does not account for the small percentage of men
trained even slightly in high school.
Let us continue with the fifth group, the "physical injury" group.
Literacy
Cases of
Group "Physical Injury" Percentage
1
... 26 5.12
...102
20.1
3
... 151 29.84
... 173 34.25
... 37 7.36
... 15 3.7 ...
2
.4
The lack of high literates in this group is even more marked than
in the previous group. Statutory crimes and crimes of physical injury
rarely lead to any great profit. And modern education trains men to
look primarily for profit in worldly behavior.
Literacy Cases of
Group Dereliction Percentage
1 ... 5 4.1 2 ... 25 20.5
3 ... 25 20.5
4 ... 42 34.4
5 ... 19 15.6
6 ... 5 4.1
7 ... 1 .8
The high percentage of men with some high school training is rather remarkable in the light of the presence of so many low literates and so few college trained men. But it is probable that crimes of social dereliction and sex crimes are not crimes, properly speaking, but diseases of rather vague classification. Nevertheless, it is interesting and probably significant that the literacy of the "dereliction" group should be so restricted.
Let us continue with the seventh group, the "sex group."
Literacy
Group Cases Percentage
1 ... 12 4.8
2 ... 58 23.
3 ... 82 32.5
4 ... 77 30.5
5 ... 12 4.8
6 ... 7 2.8
7 ... 4 1.6
In this group we reach the low ebb of literacy for all the criminal, groups. It might make more clear the differences in the literacy of the criminal groups if we make the following rough comparison of the sex and the fraud groups in terms of percentages inferior to and su-perior to the mode of literacy group 4. Of course, the mode of the sex group is group 3, but the comparison will make the differences clearer.
Percentage Inferior Percentage Superior
to Group 4 to Group 4
60.3 Sex 9.2
29. Fraud 37.
Certainly, the two type groups differ more widely in literacy than do the entire Army and criminal groups. And it must not be forgotten that recidivism is much more likely to occur in the fraud group than in the sex group. It may be still more likely to occur in the highly trained promoter or politician who has never been shamed by a public conviction.
Percentage Inferior Percentage Superior
to Group 4 to Group 4
29. Fraud 37.
48. Force 13.9
45.2 Thievery 17.4
50.2 Statutory 13.9
55. Physical Injury 10.7
45.1 Dereliction 20.5
60.3
Sex
9.2
Let us now compare the literacy of the home grown type groups
with the literacy of the type groups that are incarcerated outside their
home state.
Ve shall proceed in the regular order, taking the fraud
group first.
Literacy
Home
Percentage
Group Percentage Away
1
... 1.12 ... 8.7
7.9
3
... 23.3 15.24
... 39.1 29.15
... 16.3 21.26 ... 8.7
16.5
7
... 2.7 10.The influence of education, or at least its concomitance, is rather
remarkable.
We have omitted giving the number of cases, as they
have been given in other places.
Whatever the value of the Alpha
test may ultimately be considered, these literacy differences will remain.
Let us consider the force group in the same way.
Literacy Home Percentage
Group Percentage Away
1
...2.9
1.5
2 ... .... 14.6 17.73
... ... 33.1 24.64
... 35.6 41.75
... 11.8 11.76
... 1.6 2.67 ...
.3
.2
The differences are not marked in this group.
Let us proceed with the thievery group in the same way.
Literacy
Home
Percentage
Group Percentage Away
1 ... 3.3 1.9
2 ... 18.4 14.4 3 ... 27.2 23.3 4 ... 38.7 36.3
5 ... 9.4
17.2
6
...3.
6.37 ... ... . ... ... .... . .5
Let us now consider the statutory group.
Literacy Home Percentage
Group Percentage Away
1 ... 2.7 1.3
2 ... 13.6 20.8
3 ... ... 34.5 27.3
'4 ... 36.3 35.1
5 ... ; ... 10.9 7.7
6 ... 1.8 7.7
7 ... ... . ... ..
It is remdrkable that there should be none of the high literates at all in this group, and the geographical concomitants so slight at the same time.
Let us proceed with the physical injury group.
Literacy Home Percentage
Group Percentage Away
1 ... 5.1 5.3 2 ... 20.5 19.4 3 ... ... 31.8 25.9 4 ... ... 35.1 32.3
5 ... 5.3 11.2
6 ... 1.8 5.3
7 ... .3 .6
The small percentage of high literates and the fairly markeo. geographical differences should be noticed.
Let us consider the social dereliction group.
Literacy Home Percentage
Group Percentage Away
1 ... 5.4 3.
2 ... 20. 20.9
3 ... 21.8 19.4
4 ... 34.5 34.3
5 ... 14.5 16.4
6 ... 3.6 4.5 7 ... ... 1.5
The almost complete lack of geographical differences should be noticed. The small differences that exist are to the advantage of the "away" group, but they are not important.
Let us continue with the sex group in the same way.
Literacy Home Percentage
Group Percentage Away
1 ... 5.5 3.3
2 ... 23.9 21.3
3 ... 32.4 32.6
4 ... 28.2 34.8 5 ... ... 5.5 3.3 6 ... 3.1 2.2 7 ... 1.2 2.2
Considering all the type groups, the geographical differences are marked in only three-the fraud group, the thievery group, and the physical injury group. Of these the greatest differences are to be found in the fraud group.
4. The Literacy of First Offenders and Recidivists. We shall
omit the number of cases and shall compare the home grown first offenders and recidivists with the first offenders and recidivists incar-cerated outside their home state. The fraud group compares as fol-lows:
Literacy Home Home First Recidivists
Group First Recidivists Away Away
1 . ... ... 3.1
2... 9.4
10.7
8.3
3 ... 28.1 15.6 14.3 12.5
4 ... 31.2 59.4 23.2 33.3
5 ... 12.5 9.4 26.6 12.5
6 ... 21.9 3.1 16.1 25.
7 ... 6.2 ... 8.9 8.3
The home grown recidivists rather cluster about the eighth grade, or the fourth literacy group, while the other recidivists are also prom-inently recruited from the sixth literacy group. Combining the first offenders together and the recidivists together, we have the following:
Literacy Percentage Percentage
Group First Recidivists
1 ... ... . 1.8
2 ...
6.8
8.93 ... 19.3 14.3 4 ... 26.1 48.3 5 ... 21.6 10.7 6 ... 18.2 12.5 7 ... 7.8 3.6
It is seen that the first offenders are much more literate than are the recidivists, and that the geographical concomitants are smoothed
out. This merely emphasizes the importance of making as many com-parisons as possible.
Now let us consider the force group.
Literacy Home Home First Recidivists
Group First Recidivists Away Away
1 ... 5.3 6.5 2.1 1.1
2 ... 16. 18.7 22.2 21.5
3 ... 37.4 30.8 20.8 24.7
4 ... 32.1 32.7 382 45.2
5 ... 9.2 9.3 13.2 7.5
6 ... ... 1.9 2.8 ...
The recidivists seem to lose ground, especially among those im-prisoned outside their home state. Let us combine the first offenders together and the recidivists together.
Literacy Percentage Percentage
Group First Recidivists
1 ... 3.7 4.
2 ... 19.3 20. 3 ... 28.5 28.
4 ... 35.3 38.5 5 ... 11.3 8.5
6 ... ... 1.5 1.
7 ... ... 4 ...
The similarity of the first offenders and the recidivists is so marked, as far as literacy is concerned, that it is the chief characteristic to be pointed out here.
Let us now proceed with the thievery group.
Literacy Home Home First Recidivists
Group First Recidivists Away Away
1 ... 3.5 3. .8 2.8
2 ... 21.1 21.3 13.6 14.1
3 ... 26.8 28. 21.2 27.4
4 ... 38.7 40. 39. 32.7
5 ... 6.3 7.3 15.3 17.7
6 ... 3.5 .7 10.2 5.5
7 ... ... ... ...
The first offenders seem to have the advantage over the recidivists as far as literacy is concerned. It may be more evident if we com-bine the first offenders together and the recidivists together. Follow-ing is the combination:
Literacy Percentage Percentage
Group First Recidivists
1 ... 2.3 2.8
2 ... 17.7 18. 3 ... 24.2 27.6
4 ... 38.8 36.4 5 ... ... 10.4 12. 6 ... 6.5 2.8 7 ... ... ...
Probably no further comment is necessary concerning the above group. Let us proceed with the statutory group.
Literacy Home Home First Recidivists
Group First Recidivists Away Away
1
... 4. ...2 ... omit 24. omit 7.7 3 ... omit 24. omit 38.5
4 ... omit 36. omit 38.5
5 . ... omit 12. omit 7.7
6 ... omit ... omit 7.7
The first offenders were altogether too few to be divided in the above comparison, but we can probably consider them in a combination.
Literacy Percentage Percentage
Group First Recidivists
1 .. ... .. . 2.
2 ... 44.4 15.7 3 ... ... 33.3 31.4 4 ... 22.2 37.3 5 ... ... 10.
6 ... .. 4.
7 ... . .. ...
The recidivists are superior in literacy. The first offenders are few, but uniformly inferior in literacy. Let us proceed with the physi-cal injury group.
Literacy Home Home First Recidivists
Group First Recidivists Away Away
1 ... 3.4 2.4 5.8 4.3
2 ... 19.5 26.2 23.2 8.7
3 ... 35.6 23.8 30.4 26.1
4 ... 31.3 45.2 29. 17.4
5 ... 5.1 2.4 7.2 17.4
6 ... 4.2 ... 4.3 21.7
7 ... .8 ... ... 4.3
The recidivists incarcerated outside their home state seem to be superior in literacy to the other recidivists or first offenders. Let us
make the comparison in combination.
Literacy Percentage Percentage
Group First Recidivists
I ... 4.3 3.1
2 ... 20.7 20. 3 ... 33.7 24.6
4 ... 30.5 35A 5 ... 5.9 7.7 6 ... 4.3 7.7 7 ... .5 1.5
The superiority of the recidivists in general is caused by the pres-ence of those incarcerated outside their home state and who are recidi-vists.
Since there are so few recidivists in the social dereliction group, we shall omit the percentages and give only the cases. That will offer opportunity for casual inspection. The cases are as follows:
Literacy Home Home First Recidivists
Group First Recidivists Away Away
1 ... 1
2 ...
4
"i
7
3 ... 3 1 6 1
4 ...
5
.. 13 25 ...
3
.. 66 ...
1
..2
The recidivists are so few that comment is unnecessary and super-fluous." Let us proceed to the sex group.
Literacy Home Home First Recidivists
Group First Recidivists Away Away
1 ... 1.7...
2.2
...2 ... 20. 42.1 21.7
3 ... 40. 15.8 30.4 omit
4 ... 26.6 36.8 41.3 omit
5 ... 5. 5.3 2.2 ...
6 ... 5. ... 2.2 ...
7 ... 1.7 ...
The combination is as follows:
Literacy Percentage Percentage
Group First Recidivists
1 ... 1.9
2 ... 18.9
38.1
3 ... 35.8 19. 4 ... 33. 38.1 5 ... 3.8 5. 6 ... 3.8 ...7 ... 9
The recidivists are even less literate than are the first offenders. Let us now compare a combination of all the first offenders of all type groups with a combination of all the recidivists of all the same groups.
Literacy Home Home First Recidivists
Group First Recidivists Away Away
1 ... 3.3 3.9 2.1 1.8
2 ... 18. 21.9 19.6 14.7
3 ... 33.4 26.6 22.1 26.3
4 ... 33. 39.3 35.1 36.8
5 ... 7.3 7.7 13.4 12.6
6 ... 4.1 1.1 6.5 6.6
7 ...
8
.... 1.3 1.If we now combine the above we have:
Literacy Percentage Percentage
Group First Recidivists
1 ... 2.7 2.9 2 ... 18.8 18.7 3 ... 27.9 26.4 4 ... ... 34. 38.1 5 ... 10.3 10.
6 ... 5.3 3.5
7 ... 1. .5
5.
The Literacy of Habitual Offenders. The more than two
hundred habitual offenders give the following literacy distribution:
Literacy Percentage of
Group Habitual Offenders
I ... 2.9
2 ...
20. .
3 ...
26.3
4
... 34.6
5 ...
10.7
6 ... 3.97 ... ...
1.5
This distribution is even more similar to the distribution of the
first offenders than is the distribution of the recidivists in general. But
a comparison with the Army norms will reveal the inferiority of the
habitual offenders in literacy. Here again we see the futility of
gen-eral comparisons, and 'must revert to the use of the type groups. The
fraud group is distributed as follows:
Literacy Percentage of
Group Fraud Group
1 ...
2 ... 55
3 ... 22.2
4 ...
388
5 ...
5.5
6
... 16.6
7 ... 11.1
This distribution is quite different from the distribution of the
general group of habitual offenders. As the reader learned in previous
chapters, there are. only three of the home. grown product in this
group. Percentages are worthless in that respect, but it might be
in-teresting to observe the distribution of cases.
Literacy
Cases at
Cases
Group Home Away
I ...
...
2 ... ... ... °. "
2 .. ...
.
4...
1
6
5 ... . ... ... .... .., 1
6 .. ... ... ... 3
7 ... 2
The marked superiority of the cases incarcerated outside their
home state is evident.
Literacy Percefntage Percentage Percentage
Group at Home Away of Total
1 ... 5.9 3.
2 ... 147 18.7 16.6
3 ... ... 35.3 31.2 33.3
4 ... 26.5 43.7 34.8
5 ... ... 17.7 6.2 12.1
6 ... . -7 ...
The complete lack of high school graduates and college trained men is a fact that is most noteworthy. Just compare this group with the fraud group and distinctions will be observed that are lost in the general comparison.
The thievery group, in complete percentages, is as follows:
Literacy Percentage Percentage Percentage
Group at Home Away of Total
1 ... 7.1 2.3 4.8
2 ... ... 28.6 16:6 22.6
3 ... 21.4 26.2 23.8
4 ... 33.3 35.7 34.5
5 ... 7.1 16.6 11.9
6 ... 2.3 2.3 2.3
7 ... ....
Here, again, we see a lack of high literates. But it should be noticed here, as it has been frequently noticed before, that a lack of high literates among criminals is not necessarily accompanied by an abundance of low literates.
The statutory group, having so few of the home grown variety, will not be reported in percentages, but in a distribution of cases.
Literacy Cases at Cases
Group Home Away
1
...
..
2 ... 2
3 ... . 5
4 ... ... 3
5 ...2
6...
... 1
7..
...
Comment is probably, in this case, of little valtie. The physical injury group, also few in number, will be reported in cases instead of percentages. Literacy Cases at Cases Group Home Away 1 ... . 2 ... ,...3
3
"3
4 ...5...
..
6 ... ... .. 2The differences in literacy of the two geographical groups is very evident.
The sex group, in cases, is as follows:
Literacy Cases at Cases
Group Home Away
1 ... ...
2 ...
...
4
3 ... ... .
4 ... 2 5 ...
6 ... ... 7 ... ...
This distribution comes nearer to the traditional ideas of the ha-bitual criminal than any distribution we have. But, of course, the cases are very few.
We are forced to conclude that any differentiating general state-ment concerning the habitual criminal in terms of literacy .is bound to be of little value. Type groups must be taken into consideration.
6. The Comparative Literacy of Criminals From the West, the
North, and the South. These three groups, as previously
differenti-ated in this work, compare in literacy as follows:
Literacy Percentage Percentage Percentage
Group of West of North of South
1 ... .3 2.4 3.5
2 ... 13.4 15.9 23.6
3 ... ... 25.7 24.9 25.1
4 ... 38.8 36.9 29.4
5 ... 14.4 12.4 12.
6 ... 7.3 5.6 4.2
7 ... .... 1.8 2.3
It is interesting that the West should furnish so fev of the low literates and at the same time so few of the high literates. It can scarcely be purely a matter of chance, since the number of cases is sufficient. It is also interesting that the South should furnish so many high literates and so many low literates at the same time. But it is seen that all three of the groups are inferior to the Army norms. It might also be pointed out that the South is inferior to the other two groups in the percentage of men completing either the graded school or high school. But in the case of the college graduates or near grad-uates, in the case of the South, it is of whimsical interest to recall the efforts in that part of the country to suppress in the colleges the teach-ing of evolution. It is strange that such moral perfection should not be reflected in the data on college criminals. But perhaps it is.
three groups. Following is the distribution of the western criminals:
Literacy Percentage Percentage
Group -First Recidivists
1 ... ... ....
2 . ... ... 190
3 ...
13.8
30.
4 ... 51.7 30.
5 ... 8.6 16.6
6 ... 7.9 13.3
7 ...
More than half of the first offenders are graduates of the graded school. The recidivists are superior in higher literates, yet are very numerous in the third group. Even though there are none in the sev-enth group, the first offenders and the recidivists are quite literate.
The northern criminals are distributed as follows:
Literacy Percentage Percentage
Group First Recidivists
1 ... 1.9 1.8 2 ... 21.3 13.8 3 ... ... 24. 27. 4 ... 31. 37.7
5 ... 13.2 10.
6 ... ... 7.7 7.8 7 .... ... .7 1.8
The reverse differences in the second and the fourth groups are the only real differences, but the interpretation of their significance will not be attempted.
The southern criminals are distributed as follows:
Literacy Percentage Percentage
Group First Recidivists
1 ... 6.1
2 ... ... 19.5 30.
3 ... 26.8 21.3
4 ... 31.7 34.
5 ... . .10.9 8.5
6 ... 2.4 4.3 7 ... 2.4 2.1
The lack of lowest grade literates among the recidivists should be noted. Otherwise there is little to choose between the first offenders and the recidivists.
CHAPTER 8
THE CHRONOLOGICAL AGE OF CRIMINALS
obtained is the one recorded on the admission card. In this chapter it
is the latter age that is used exclusively. There are many possible
criticisms of such a method, but it is at least consistent.
1. The Gross Distribution of Age Groups. For the convenience
of discussion it will be necessary to number the age groups as follows:
Age Group Years
1 ... ... .... 15-20
2 ... 21-25
3 ... 26-30
4
... ... 31-355 ... 36-40
6 ... ... 41-50
7 ... 51-X
There were not legally supposed to be any men less than eighteen
years of age, but a. few of ixteen were found. The-reader must not
suppose that the writer considers seven a sacred number. It merely
happens to be a convenient number in several of the classifications in
this book.
The gross distribution of the nearly four thousand cases under
discussion is as follows:
Age Group
Percentage of Total
1
... ... 20.92 ... 26. 3 ... ... 17.7
4 ... 13.8
5 ... ... 9.4 6 ... 8.6
7 ... ...
3.6
This is not a distribution that can be made into a "normal curve."
No attempt was made by the writer to make such a distribution, since
it is obviously impossible. The extreme youthfulness of the criminal
group is the fact that strikes one most in the above distribution.
Nearly half of the entire criminal population is twenty-five years of
age or less. Approximately 88% of the criminal group is composed
of young men less than the age of forty years.
But there are geographical concomitants here also. Let us
com-pare the home grown and the migratory groups.
Age Percentage Percentage
Group at Home Away
I ... ... 23.6 16.8
2
... 26.2 -25.5 3 ... ... 17.1 18.84
... 13.1 14.15
... ... 9. 10.6 ... 7.6 10.
The differences here are probably what one might expect. Migra-tion usually does not begin till the individual becomes an adult, and may continue as long as life lasts. Such an explanation seems easy and obvious, but is incorrect, like other easy and obvious things. in criminology there can be no assumptions more daring than the multi-plication table-and even that should be looked upon with suspicion.
2. The Age of Type Groups. We shall compare the home grown
group with the migratory group in each of the seven type groups, taking the fraud group first.
Age Percentage Percentage Percentage
Group of Home Away of Total
1 ... 19.1 7.6 13.8
2 ... ... 24.5 15.2 20.2
3 ... 15.3 17.1 16.1
4 ... 1. ... 13.7 22.8 17.9
5 ... ... 10. 12.7 11.1
6 ... 14.2 15.2 14.7
7 ... 3.3 9.5 6.1
One should especially notice the very small percentage of the migratory group in the first age group and the large percentage in the fourth and seventh groups. In fact, this distribution of the fraud-ulent migratory group is quite the opposite of the general distribution of the criminal group. Even the home grown group contains large percentages in the upper ranges of years. In fact, the fraud group is an older group-a group composed largely of mature men. And these are not men who serve long terms in prison. On the contrary, two or three years is an average term for such men to serve. Intelli-gent, educated, mature, but criminals!
Let us next consider the distribution of the force group of crim-inals.
Age Percentage Percentage Percentage
Group of Home Away of Total
1 ... ... 26.7 21.6 24.9
2 ... 29.5 31.6 30.3
3 ... 17.2 18.4 17.6
4 ... ... 15.2 12.2 14.1
5 ... 6.8 8.1 7.3
6 ... 3.3 5.8 4.2
7 ... ... 1.3 2.2 1.7
Here we find a much younger group of criminals. More than
55% are only 25 years of age or younger, while only 34% of the fraud
second age group. But here, as in most of the other groups, the old
men are usually incarcerated outside their home state.
Let us consider the thievery group in the same way.
Age Percentage Percentage Percentage
Group of Home Away of Total
I ... 30. 22.4 26.8
2 ... 30. 26.3 28.5
3 ... ... 14.5 18.2 16.2
4 ... 11.7 12.1 12.
5 ... 7.6 10. 8.7
6 ... ... 5. 7.9 6.3
7 ... 1.9 3. 2.4
This group is still younger than the force group, in so far as the
home cases are concerned.
But the migratory group is not quite so
young. It is significant that nearly a third of the home group should
be only 20 years of age or younger. As far as maturity is concerned,
this group is almost like a freshman class in college. Mere youths, yet
carved with the stigma of everlasting shame!
The statutory offenses are distributed as follows:
Age Percentage Percentage Percentage
Group of Home Away of Total
1 ... 34.8 17.1 27.7
2 ... ... 33. 42.8 36.6
3 ...
14.7
17.1
15.5
4
... 7.3 4.3 6.15
... ... 4.6 8.6 6.16 ...
4.6
7.1
5.5
7 ...
1.
2.8
1.6
Here is the picture of youth in conflict with the dictates of a
minority group. As a matter of course, all statutes are bound to be
the expression of miriority 'ideas. These ideas are flouted chiefly by
the young. It is the habit of youth to flout the dictations of
age.
Watch -the little child of three.
But the child of three
and the child of nineteen are punished differently. The one is spanked,
while the other has'all the "fine things of,human life taken away from
him forever. The spanked child of three is forgiven readily by loving
parents.
The incarcerated child of nineteen is never forgiven, is
never trusted again. Such a ruined child is not likely to commit
statu-tory offenses again.
He looks for bigger game next time, and for
such as he the hunting season will never again be closed. Notice that
approximately" 60% of the recidivists are only
"25
years of age or
younger.
Not yet old *enough to think of getting married, and yet
veterans in crime-men who should die because normal life is ended.
Age Percentage Percentage Percentage
Group of Home Away of Total
1 ... ... 10. 7.1 9.1
2 ... 14.5 17. 15.4
3 ... 23.7 21.7 23.1
4 ... ... 16.3 17. 16.6
5 ... 142 10.6 13.
[image:21.629.89.392.314.395.2]6 ... ... 13.6 16.5 14.6
... 7.4 9.4 8.1
Here is a picture of maturity, age with its wisdom! They are not old because sentences are long and the pardon boards are heartless. These are the men as they come to the prisons. They have lived long, but none too well. And they are not veterans in crime. Most of them have come into conflict with the law for the first time. The age be-tween forty and fifty is the critical age for mature men, while bebe-tween twenty-five and thirty is the critical age for the more youthful. Those are the two ages of struggle, the struggle to get a start in life and the struggle not to admit the truth concerning one's success. The latter age is dominated by the migratory individuals, and in this case it hap-pens that they are chiefly veterans in crime who are fugitives from the scenes of previous derelictions.
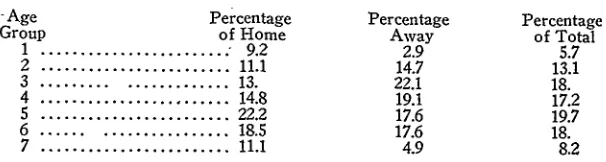
The social dereliction group is distributed as follows:
Age Percentage Percentage Percentage
Group of Home Away of Total
1 ... 9.2 2.9 5.7
2 ... 11.1 14.7 13.1
3 ... ... 13. 22.1 18.
4 ... 14.8 19.1 17.2
5 ... 22.2 17.6 19.7
6 ... ... 18.5 17.6 18.
7 ... 11.1 4.9 8.2
The sex group is distributed as follows:
Age Percentage Percentage Percentage
Group of Home Away of Total
I ... 12.6 3.4 9.4
2 ... ... 20.4 11.2 17.2
3 ... 16.2 19.1 17.6
4 ... ... 8.4 19.1 12.1
5 ... 13.2 12.3 13.3
6 ... 21.6 23.6 22.3
7 ... ... 6.6 11.2 8.2
The man in the prime of life, between forty and fifty, is the one
most likely to commit these crimes. As in the case of crimes of
physi-cal injury, there are two chief periods for such crimes, and the two
periods are the same in the two type groups: The emotional
charac-ters of the two type groups must be largely similar. In intelligence
the two groups are similar also.
3. The Age of Recidivists and First Offenders. In this
discus-sion the reader should be on the alert to detect the migration of the
home grown first offender from his original group to the group of the
migratory recidivist. It is the more intelligent criminal who thus
mi-grates, and he is more likely to be found in some type groups than in
others. The reader should remember also that the recidivist is not
necessarily an individual older in chronological age than is the first
offender. The difference between the first offender and the recidivist
is not a difference that can be stated in terms of time at all. The"
difference is probably chiefly an emotional difference, the expression'
of which must wait on further developments in psychology.
Taking each of the seven type groups in turn, we shall give the
distributions in such manner as to make most clear the actual
differ-ences. The following is the distribution of the fraud group:
Age Home Home. Away Away
Group First Recidivists First Recidivists
1 ... 18.7 23.5 5.2
2 ... 18.7 29.4 12.1 4.
3 ... 12.5 11.8 17.2 11.5
4
... 21.9 14.7 18.9 26.95 ... 12.5 5.9 15.6 15.4
6
... 15.6 8.8 20.826.9
7 ... ...
5.9
10.4
15.4
young first offenders continue sick, the old first offenders take their disease to other states. It looks like a migration of the older first offenders, but, of course, looks are very deceptive in psychology. In the case of the migratory group, susceptibility for the disease increases with age. Is it increasing wisdom on the part of the criminal, or does he have no wisdom at all?
Following is the distribution of the total first offenders and total recidivists of the same group:
Age Percentage Percentage
Group First Recidivists
1 ... 10. 13.3
2 ... ... 14.4 18.3
3 ... ... 15.5 11.6
4 ... 20. 20.
5 ... . 14.4 10.
6 ...
...
18.8
16.6
7 ... ... 6.6 10.Here we see clearly that the difference between the first offender and the recidivist is not a difference that can be stated in terms of time.
Let us continue with the distribution of the force group.
Age Home Home Away Away
Group First Recidivists First Recidivists
1 ... 25.4 17.3 21. 7.5
2 ... 29.7 31.7 35.7 30.
3 ... 27 13.5 23.1 30.
4 ... ... 11.5 16.3 9.8 15.
5 ... : ... 5.4 12.5 5.6 7.5
6 ... 1.5 6.7 3.5 5.3
7 ... . . 2. 1.4 4.2
The robbers and burglars are most numerous between twenty and twenty-five, whether they be first offenders or recidivists. But the old men either die or learn better methods. Following is the total distribution of the group:
Age Percentage Percentage
Group First Recidivists
1 ... 23.1 12.7
2 ... 32.6 31. 3 ... 24.9 213
4 ... 10.6 15.8
5 ... ... 5.5 10.1
6 ... 2.6 6.1
7 ... . 7 3.
Here we see to best advantage the clustering of cases in the sec-ond age group.
Age Home Home Away Away
Group First Recidivists First Recidivists
1 ... 27.3 22.3 21.2 18.6
2 ... 31.4 31.7 37.3 - 28.3
3 ... 14.7 15.8 13.6 23.
4 ... 14. 12.2 11. 8.8
5 ... 5.8 9.3 6.8 8.8
6 ... 5.8 7.2 7.6 9.7
7 ... 1A 1.5 2.6 2.6
Here again we see the clustering of cases in the second age group.
In fact, it is the clustering of such cases in the force and thievery
groups that determines such clustering in the total criminal group.
More than half of all criminals must be classified in one or the other
of the two groups.
That merely indicates the easy and obvious
method of attack that appeals to the average criminal.
Following
is the total distribution of this group:
Age Percentage Percentage
Group First Recidivists
1 ... 24.5 20.6
2 ... 34.1 30.1 3 ... 14.2 19.
4 ... 12.6 10.7 5 ... ... 6.1 9.1 6 ... 6.5 8.3 7 ... 1.9 2.
Clearly this is not an old man's game. But the diseases and rigors
of prison life, together with-the easy charity meted out to the aged,
may make such precarious behavior impossible or unnecessary.
In the case of the statutory group we shall give the number of
cases insfead of percentages. The reason for this is obvious.
Age Home Home Away Away
Group First Recidivists First Recidivists
1 ... ... 1 2 1 3
2 ...
2 11 4 133
... 2 2 4 54 ... ... 1 3 ..
1
5 ... 1 2 .. 1
6
... .. . 4 2 17... ..
Age Percentage Percentage
Group First Recidivists
1 ... ... .
.
... 11.1
10.4
2 ... 33.3 50. 3 .. ... 33.3 14.54 ... ... 5.5 8.3
5 ...
5.5
6.2
6 ... 11.1
10.4
7 ... ...
The percentage of recidivists less than twenty-five years of age
is greater than in the case of the first offenders. In this respect this
group resembles the fraud group. But the general youthfulness of
the group resembles the force and thievery groups.
Let us continue with the distribution of the physical injury group.
Age Home Home Away Away
Group First Recidivists First Recidivists
1 ... ... 9.4 9.3 11.6 ...
2 ... 10.1 25.6 18.8 13.
3 ... 18.8 23.2 21.7 21.7
4 ... 14.4 9.3 14.5 21.7
5 ... 19.5 14. 11.6 13.
6 ... 16.1 14. '11.6 21.7
7 ... 11.9 4.6 10.1 9.
In the home group the first offenders predominate in the upper
age levels, while the opposite is the case in the migratory group. This
is also the case where the young first offender is likely to belong to the
migratory group.
The total distribution of this group is as follows:
Age Percentage Percentage
Group First Recidivists
1 ... ... 10.1 6.
2 ... 13.6 21.2
3 ... . 20. 22.7
4 ...
.
... 14.4
13.6
5 ... 16.5
13.6
6 ... ... 14.4
16.6
7
... 11.2 6.The reader should remember that there are only about a third as
many recidivists as first offenders in this group. But those recidivists
are widely distributed from youth to old age, just as the first
offend-ers are.
. In the case of the social dereliction group we shall give the
Age Home Home Away Away
Group First Recidivists First Recidivists
1 ... 2 1
2 ... 2 1
3 ... 2 .~9 2
4 ... ... 3 ..
8
5 .. .: ... 4 8 .
3
6
... ...
1
..
3"
7
...
.... 11
The total distribution is as follows:
Age Cases of Cases of
Group First Recidivists
1 ... .... 2 1
2 ... 9 1 3 ... ... 11 2 4 ... ... ... ... 11
5 ... 12
6 ...
...
4
7 ... 1 1
The vast majority of the cases occur between twenty-five and forty years of age, and usually occur but once.
The sex group is distributed as follows:
Age Home Home Away Away
Group First Recidivists First Recidivists
1 ... 11.1 5.5 2.2 ...
2 ... 19. 5.5 13.
3 ... 17.5 33.3 21.7 omit
4 ... 6.3 16.6 19.6 omit
5 ... ... 12.6 16.6 15.2 ...
6 ... 19. 22.2 19.6 ...
7 ... 14.3 ... 8.7 ...
There are no recidivists after the age of fifty, but the fires still smolder in the- first offenders. But it is the game of mature men all the way through, not the expected abandoned irresponsibility of youth. Sex passion seems to develop psychologically long after the obvious biological causes have been taken away. But a large percentage of older people can probably testify to this fact. The total distribution of the group is as follows:
Age Percentage Percentage
Group First Recidivists
1 ... ... 7.3 5.
2 ... 16.5 5. 3 ... 19.3 35. 4 ... 11.9 20. 5 ... ... 13.8 15.
6 ... 19.3 20. 7 ... 11.9
It might be well to give a distribution of the total recidivists and first offenders. Following is such distribution:
Age Home Home Away Away
Group First Recidivists First Recidivists
1 ... ... 19.5 18. 14.1 10.7
2 ... 23.1 30.8 27.3 26.5
3 ... 19.1 16.1 20.1 24.1
4 ... 13.2 13.6 13.4 13.1
5 ... ... 10.8 10.8 10.3 10.3
6 ... 9.2 9.4 10. 10.3
7 ... 4.9 1.1 4.3 4.8
This distribution differs chiefly in the lower age levels. It is really remarkable how closely the percentages vary together in passing from one age group to a higher one, except in the lower levels.
The total distribution of the total recidivists and total first offend-ers is as follows:
Age Percentage Percentage
Group First Recidivists
1 ... 16.9 14.8
2 ... 25.1 28.9
3 ... 19.6 19.7
4 ... 13.3 13.4 5 ... 10.6 10.6 6 ... 9.6 9.8 7 ... 4.8 2.8
These two percentage distributions look strangely alike, and dem-onstrate the truth of the statement that the difference between first offenders and recidivists is a difference that can scarcely be expressed in terms of time.
4. The Age of Criminals from the West, the North, and the South. The percentages of approximately 1,300 cases are as follows:
Age Percentage Percentage Percentage
Group West North South
1 ... 14.6 15.3 21.6
2 ... 25.6 27. 25.9
3 ... 16. 20.8 19.2
4 ... ... 17. 14.4 12.1
5 ... 11.6 8.7 9.
6 ... 9. 9.7 8.2
7... .. 6. 3.9 4.7
CHAPTER 9
THE INDUSTRIAL OCCUPATIONS OF THE CRIMINAL
In arranging material for this chapter it was difficult to decide
just what to select, there were so many occupations with just a few
representatives.
It was finally decided that only a few of the more
representative occupations would be discussed.
On page 828 of the
Memoirs are found distributions of a large number of occupations, the
followers of which had found their way into the Army. We shall
use those distributions for our norms, and shall compare with them
the distributions of nineteen industrial occupations which were
fol-lowed by criminals before conviction. We shall follow no logical order,
since none occurs to us, but shall present the data as it occurs in our
notes.
There are fifteen cases of expert accountants among the
crim-inals. Their distribution in the Army letter grades, as compared with
expert accountants in the army, is as follows:
Letter
Percentage
Percentage
Grade
Army Cases
of Criminals
E ... ....
...
D
...
.
C -
. ...
.5
6.6
C ...
...
5.5
...
C + ...
26.2
13.3
B ... 39.1
33.3
A ... 28.7
46.6
To be sure, there are only fifteen cases of the criminals in this
group, but the way they are clustered in the upper ranges of Alpha
leaves little doubt concerning the probable distribution of a larger
number of cases. Only the more intelligent of the expert accountants
get to prison. It may be that they are in position to be subjected to
greater temptations. Or it may be that they have a keener yearning
for the things that money will buy. Most discussions of the causes of
success and failure leave out of account the influence of the presence
or the absence of burning desires. Such desires may be much stronger
than mere intelligence, and may bring to pass things that otherwise
never would exist. It is necessary that psychologists pay greater
at-tention to desires, emotions, and feelings-but not necessarily from
the point of view of the Freudians.
Letter Percentage Percentage
Grade Army Cases of Criminals
E ... ... .3
D ... .9 .9 C . ... 5.2 5.9 C ... 19.7 24.1 C + ... 33.6 33.7 B ... 25. 21.4
A ... 15.3 14.1
There are 220 general clerks among the criminals examined, so the above distribution should be fairly accurate. There seems little to choose between the two distributions. There are very few general clerks of low intelligence in prison, and the reason is that there are no such general clerks among the population. But there certainly is no indication that the clerks who commit crime and get convicted are the less intelligent ones. In fact, intelligence seems to play no part whatever in determining the criminal behavior of clerks-at least no greater part than it plays in determining that certain individuals be-come clerks.
Following is the comparative distribution of musicians:
Letter Percentage Percentage
Grade Army Cases of Criminals
E . ... 1.
D ... 4.5 9
C - . ... 12.3 11.5
C ... 26.3 15.4
C + ... 28.6 23.1
B ... 18.5 36.5
A ... 8.8 11.5
There are fifty-two of the musicians among the criminals. It seems that among musicians the temptation to commit crime is greater among the more intelligent ones. It would be interesting to know the kinds of crimes that musicians commit. The writer will not give that information in this place, as it is contained in the original data that is published as part of this book. Such questions are of tremen-dous importance. But all such questions cannot be answered in this monograph. The writer hopes that others will make use of his data and help in answering some of the countless questions that legitimately can be asked on the basis of the data presented. The limitations of this monograph, as has been pointed out elsewhere, determine that it be suggestive rather than complete.
Letter Percentage Percentage
Grade Army Cases of Criminals
E ... 4.3 2.5
D ... 11.6 4.4
C - ... . ... 16.7 12.6
C ... 28.3 27.7
C + ... 24.6 25.8
B ... 14.5 20.8 A ... ... 6.3
The criminal mechanics seem quite superior in the upper ranges, as compared to the general run of mechanics. It should also be noted that the criminal mechanics are more highly selected in the lower ranges. The modes of the two distributions are approximately equal. The group differs in this respect from the group of general clerks. No attempt will be made now to interpret the significance of these facts. Of course, the facts are significant. Criminal behavior is cer-tainly vitally related with the every-day industrial and social behavior of men not yet criminals. Information that is sufficiently compre-hensive will reveal the relations, but such information is not yet at hand. Neither the mechanistic nor the vitalistic explanations will suffice alone, but a proper combination of the two should give an ade-quate explanation of all behavior. There are 159 criminal mechanics. Following is the comparative distribution of the general ma-chinists:
Letter Percentage Percentage
Grade Army Cases of Criminals
E ... 4.1 1.6
D ... 10.8 1.6
C . ... 22.7 16.8 C ... 29.2 37.5
C + ... o ... 21.2 28.2
B ... ... 9.3 8.1
A ... ... 3. 6.
Here again we see a marked superiority of the criminal ma-chinists, as compared to the general run of machinists. The lack of low grade criminal machinists is especially marked. There are 184 cases of criminal machinists-a number sufficient for fairly accurate comparison.
Following is the comparative distribution of the chauffeurs:
Letter Percentage Percentage
Grade Army Cases' of Criminals
E ... 2.3 4.8
D .: ... 8.5 12.
C - . ... 21. 14.6
C ... .... ... .31.3 28.1
C + ... 22.5 34.6
B ... ... 10.2 9.2
There are 185 chauffeurs in the criminal group. The criminal
chauffeurs seem rather inferior to the general-run of chauffeurs. But
neither group is inferior to the general population. It is important to
observe what types of occupations furnish superior criminals, and
what types furnish inferior ones-relatively speaking. This may
be-come clearer at the end of this chapter.
Following is the comparative distribution of the criminal farmers:
Letter
Percentage
Percentage
Grade
Army Cases
of Criminals
E
...
6.4
11.6
D
... ...
20.6
10.
C . ... 26.8 27.