5
X
October 2017
Cancer Prediction Based On Ph Parameter Using
Computer Aided Technique
Dr Rakesh Kumar Godi1
1
Professor, department of information Science and Engineering PDACEK
Abstract: Recently the list of the people who need a medical service increases day-by-day. According to the survey the cancer disease is rapidly growing in young adult persons and even in children’s within the age of 15 and death rate because of cancer increase day- by-day. This increases complexity of medical services and has a massive amount of data to analyse. It is difficult to the doctor to find the initial stage of the cancer based on the medical report. So to process the collected medical data, save the time, minimize the service costs, quality of treatment and efficiency of the clinical data the healthcare industry usually follow information technology. In data mining technique playing a significant role in medical sector, it eliminates the hand operated tasks and easily extracts the data directly from the electronic records. This paper presents a creative solution for human health analysis related to the cancer based on urine and bloodsamples and based on analysis output patient condition is determined. These electrolyte values of blood and urine value are collected by the medical report of the different patient such as blood and urine sample value during pregnancy and for diabetic’s patients. Both blood and urine electrolyte values are integrated with the help of data fusion technique to generate a single data. Desirable information is extracted from the collected medical information. This is done by eliminating undesirable information present in medical dataset, feature extraction technique used to remove the irrelevant data from the data set. This reduced data is classified and analysed using ANN classifier and SVM algorithm, this increase overall computational the speed and system accuracy. Based on classifier output decision is made that the given sample value belongs to whom and patient health condition. The advantage of information technologyi.e data mining increases it application in medical sector for data analysis, which boosts the entire system speed in medical industry.
Keywords: Blood and Urine samples, Data fusion, Feature Extraction, Decision based classification using ANN and SVM classifier.
I. INTRODUCTION
The cell is fundamental element of human body and its functioning is totally depends on working of individual cell. A whole body contain a trillion number of cell. Each cell is a complicated biological element, which perform the precise function within in body. A cell work properly when surrounding outside conditions are stable. Hence cells surrounding the composition element are very important. It is the extracellular fluid. Its composition elements are hydrogen, oxygen, carbon, calcium, phosphorous. A healthy human being body contains a60% water. This total body of water is again divided into extracellular fluid and interstitial fluid. The extracellular is 19 litres containing blood and plasma about 3.2 litres and interstitial fluid about 8.4 litres of the total TBW and about 23 litres of fluid inside cells. Since any change in the composition element will affect the functioning of the human body. The main electrolyte in body water outside of cell is sodium and chloride. Whereas within a cell potassium and other phosphate play an important role.
Hence in medical sector clinician mainly focus particular ionic distribution, electrolyte composition and pH value of blood and uine. If any simple variation in electrolyte composition in individual person from the normal range, it indicate an abnormal health condition of human body. An abnormal condition may be indicates a diabetic condition, cancer diseases and it may be because of pregnancy. To analyze a particular disease there is need to collect an individual electrolyte composition value from the patient for health analysis.
information technology which helps in decision making based on collected information. It is a technique of separating the useful information from huge possessed data which was previously unknown.
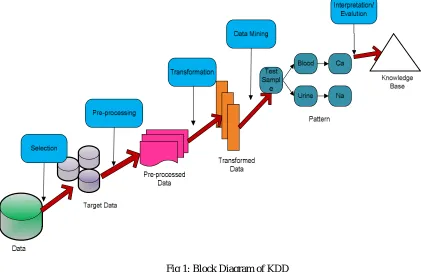
[image:3.612.98.519.175.447.2]The role Data mining techniques is very important in medical sector in terms of forecasting and making a judgement in dealing with different diseases like, cancer, diabetes, cardiovascular abnormalities and others. KDD is computer aided technique in which Data Mining is very important for data analysis. This data mining include the inferring algorithms with these algorithm the data is analysed and model is developed to find previously unknown pattern. The model is used for understanding phenomena from the data, analysis and prediction.
Fig 1: Block Diagram of KDD
A. There are five different stages presented in KDD as represented in figure 1. They are
1) Selection: This stage includes creating a target data set and mainly concentrates on different electrolyte (i.e pH value of blood and urine) distribution of the cell in the body for further health analysis purpose.
2) In order to capture homogenous data a KDD flow through a pre-processing technique, this part play a significance role. This
stage include target data cleaning process to eliminate the undesirable information present in the data set.
3) Transformation: Data transformation is done using data reduction techniques or transformation methods.
4) Data Mining: This stage is useful for separating a relevant data from the gathered data.
5) Interpretation/Evaluation: This stage is helpful in making a decision.
The main aim of data mining in medical field is to enhance the treatment quality and expansion of treatment resources. The application of data mining in healthcare increases the work efficiency and reduction human error which deals with tasks for predicting a certain diseases where accuracy is important. Reduces the time and cost associated with disease prediction and medical service. Data mining technique is useful in multi-process automation e.g prediction models and expert system, and it is mainly helpful in extraction of new knowledge
II. LITERATURE SURVEY
data classification. In this paper training data is tested with 10-fold cross validation. The data sets are pre-processed to eliminate the missing values and features selection used to select only those dataset which are significant during classification processYo-Ping Huang et al [06] introduced Fuzzy ART2 based decision trees algorithms for medical data classification. In this paper the author proposed fuzzy decision trees techniques for different medical databases such as in particular the Blood Transfusion Service Centre database and Harbeman’s Survival database. Author proposed a neural network based clustering using Adaptive Resonance Theory 2(ART2) and fuzzy ID3. The resultant output conform the classification rates are decreases by processing the dataset using decision tree algorithm. Because of its operational accuracy and efficiency this data classification not only limited to medical databases. It is used in multi- attribute databases.Mohammed Abdul Khaleel et al [07] presented A Survey of Data Mining Techniques on Medical Data for Finding Locally Freqent Diseases. This paper presents a various data mining technique such as Neural Networks for extracting patterns finding trends, Genetic algorithm for classification of medical data, decision tree algorithm for decision support, Bayesian Network algorithm for analysis of medical data, SVM, Fuzzy Cognitive Maps, k-NN for the diseases classification along with that Clustering and classification method is used for biomedical databases. These all data mining are helpful in detecting locally frequent diseases like lung cancer, breast cancer and heart ailments and so on. This increases the speed, accuracy and performance of data mining operation on different dataset.M. Durairaj et al [08] proposed a Data Mining Applications In Healthcare Sector. In this paper author mainly focused on different data mining techniques (i.e In-Vitro Fertilization, Artificial Neural Network, WEKA, NNC2) , various tools and its effects on medical field. To increases the diagnostic accuracy they focused on diseases prediction using data mining algorithms. This is very challenging task in medical sector. The author compares and combines the different data mining algorithm develop a diseases predication algorithm to predict the cancer, this reduces the cost, eliminate the human error and increases the accuracy of separating desirable information from the huge data. This helps the doctor in making decision on respective patient health condition.HarvinderChauhan et al [09] presented Decision Tree Algorithms and its performance estimation. Here author represents the ID3 and C4.5 decision tree algorithm for experiment analysis for many datasets.Decision tree algorithmIterative Dichotomiser 3(ID3) is serially designed based on Hunt’s algorithm. Decision tree algorithm C4.5-C4.5 algorithm is improved version of IDE3 algorithm; it is also based on Hunt’s algorithm. Both algorithm increases the overall data mining operation accuracy.Parvathi I et al [10] introduced Survey on Data Mining Techniques for theDiagnosis of Diseases in Medical Domain. The author describes the challenges and advantages associated with data mining technique and explain the different algorithms that have been related to medical analysis. The paper explains the process of KDD where data mining is the one of the important steps which selects the desirable data from large medical information. Author represent A hybrid technology of data mining which uses various data mining method these different data mining technologies are combined such as association rules and classification trees. This proposed methodology helps the physicians to make more accurate and faster judgement on patient health condition.Surya.K et al [11] introduced a Data Mining in Agriculture Banking and Medical inthe field. This paper mainly focused on reduction data which is gathered from banking, agriculture, and medical field. This growth in data collection from different field is reduced by using multiple technique of data mining and only relevant information is extracted. In this paper author represents the classification, clustering and classification and prediction data mining techniques and its applications area. The above mentionedtechniques of data mining used in multiple area of application.
III. METHODOLOGY
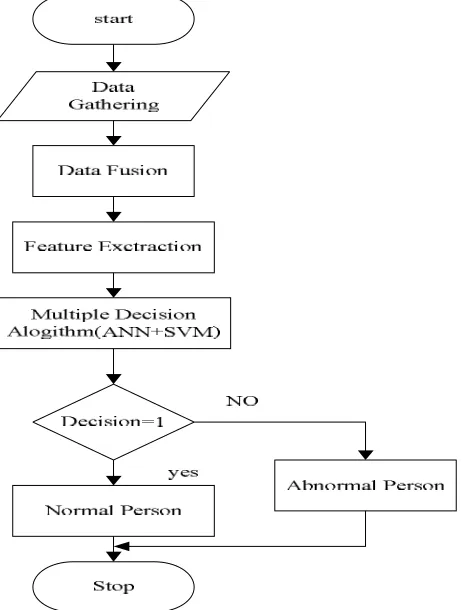
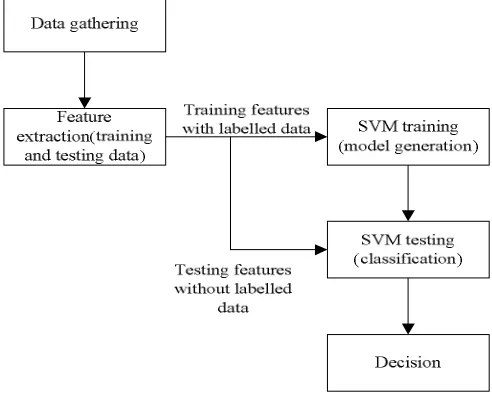
Figure 2: Architecture of the Proposed System
Correspondingly in testing phase, input might be a urine or blood electrolyte values from medical report of respective patient is considered for health analysis. The urine and blood sample value are collected by considering a multiple number of patients. This gathered data is integrated to form a single data base using data fusion technique. Again this integrated data dimension is reduced separating desirable data from the collected this reduces the dimension of collected data which is helpful for better computational speed. In testing the ANN and SVM algorithm are used to analyse the medical and measure individual computational accuracy in decision prediction. Both classifiers play a significance role; the output from each classifier is compared for defining system accuracy. The classifier output result is compared with knowledge base and presents the output. Based on the output doctor predict the patient health condition and diseases associated with it. Figure 3 represent the overall flow of diagram of the project.
[image:5.612.207.438.412.717.2]A. Data Gathering
In proposed system the individual blood and urine sample are collected from the respective patient and stored. A Vacutainer tubes are used for collection of blood and each tube is attached with barcode. Theses bar codes are used to distinguish the individual from whom the sample was taken.Singularly urine tests are very useful for providing information to assist on the diagnosis, monitoring and treatment of a wide range of diseases.A urinalysis test is performed on urine sample collected from the patient in a specimen cup. Normally for urinalysis testing a small amount (30-60mLs) is required. A different type of blood test is done for analyse of the patient blood but in the proposed work blood chemistry test is performed to test the electrolyte value or electrolyte imbalance in blood content. In blood chemistry test mainly sodium,chloride,potassium, magnesium, calcium, phosphorus substance are measured. Based on substance value a decision is made that the respective person is normal or abnormal. For a normal person the main electrolyte substance blood range is given i.e Calcium(Ca)- 4.5-5.5 mEq/L, Sodium(Na)- 133-146mEq/L, and Potassium-3.5-5.4mEq/L, and urine substance range is Chloride (Cl)-98-106mEq/L, Sodium- 25-100mEq/L, potassium-25-100mEq/L. if the tested electrolyte value are not in normal range than the respective person is declared as abnormal. In abnormal condition there may be different type of diseases considered for example cancer, diabetic, or pregnancy. Each disease has a different electrolyte imbalance this imbalance is find out by using a blood chemical test and urine test. Based on the electrolyte imbalance the proposed system helps the doctor in decision making of patient health condition.
B. Data Fusion
To determine the state of the system, the data fusion relates data set from various sources. The system state and its functioning are continuously investigated and the general framework of the data fusion changes when presents input data set changes which is completely depend on the system resources and current environment of the system . In order to achieve a better performance and less memory usage a data fusion technique is used, to covert high dimensional medical into desirable low dimension data in medical sector for data mining. Data fusion is process to combining the different source of data together. There arethree main types of data fusion: data oriented, task oriented (variable) and a mixture of data and variable fusion. The main aim of the data fusion is to represent integrated result and produce more detailed, reliable and accurate information. In the proposed system a blood and urine sample values are collected from medical report of the multiple patient, this huge medical data is input to the data fusion which represent medical information in accurate form. This data fusion technique increases the entire system performance.
C. Ann Classifier
In data analysis ANN classification gaining a more importance.It is considered a most dynamic research and application area. ANN is a branch of Artificial Intelligence (AI) .There is various techniques are available in this classification process. ANN demonstrates the system that instead of programming, to perform and executes definite tasks. In ANN, binary and multilevel classification methods are considered as most important techniques. For training and testing of data classification ANN considered as the most flexible algorithm and it is applicable for better and accurate classification result.
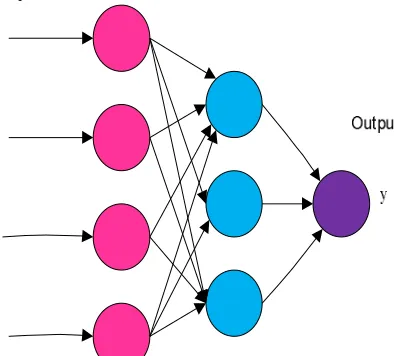
[image:6.612.203.400.536.714.2]There are three layers in ANN classifier namely
1) Input layer: A number of predictor variable values are given as input to the input layer. The input layer circulates the values to individual layer in the hidden layer. A constant input 1.0, defined as bias that is given to individual hidden layer.The weight value is multiplied with the bias value and the result added to sum going to the neuron.
2) Hidden layer:At the hidden layer the incoming input neuron is multiplied by weight ( ), and the outcome values are added
together with weighted values to represent an integrated value . The resultant sum value given to the transfer function σ, which
output value hj, the hidden layer the output will act as input to the output layer.
3) Output layer:Hidden layer output is multiplied by a weight ( ), in output layer. And represent an integrated value , the presented weighted values are added together. For a transfer function σ, the weighted sum ( ) values are fed as input, where values are the output from the transfer function. y values are output from the network.If a regression analysis is being performed with a continuous target variable, than there is a single neuron in the output layer along with it brings out single y value.
In this proposed system ANN classifiers are used for data analysis and to make decision i.e healthy and unhealthy condition of the patients and analyse the unhealthy condition whether it related to cancer disease or not.Making health analysis they predict diseases in abnormal health condition based on the electrolyte sample value which is collected from blood and urine medical Lab test from the particular person. In training part a back propagation algorithm is used for data analysis. The entire use of classification technique eliminates the human error associated with diseases predication and data analysis.
D. Back Propagation Learning Algorithm
In ANN classification back propagation is a common method of teaching and describes how to perform a given task. There are 2 operational phase in back propagation learning algorithm. They are Propagation and Weight update.
Each propagationhas two operational steps. They are forward and backward propagation. A forward propagation of a training template’s generates the propagation’s output based on the neural network inputs. In back propagation in order to generate the deltas of all output and hidden neurons, propagation output activation is done through neural network using training patterns.
To get gradient of weight it is significance to multiply output delta and input. And then subtracting a ratio from the weight to bring the weight in the opposite direction of the gradient; the resultant ratio increases the learning quality, it is defined as learning rate. The increasing of the error is indicated by the sign of the weight gradient
Notation
Input layer Hidden layer output layer
Number of neurons n+1 q+1 p
Signal function linear sigmoidal sigmoidal
Neuron index range i=0,.n h=0,….q j=1,…p
Activation xi
Signal Δ(xi) (∆ ) ∆
Weights → → → →
Both the phases are repeated until to get good network performance. To compute network gradient error with respect to the modifiable weights of the network a back propagation algorithm is mainly used. Simple implementation and its quick ability to originate the network the back propagation is very popular. The entire use of classification technique eliminates the human error associated with diseases predication and data analysis.
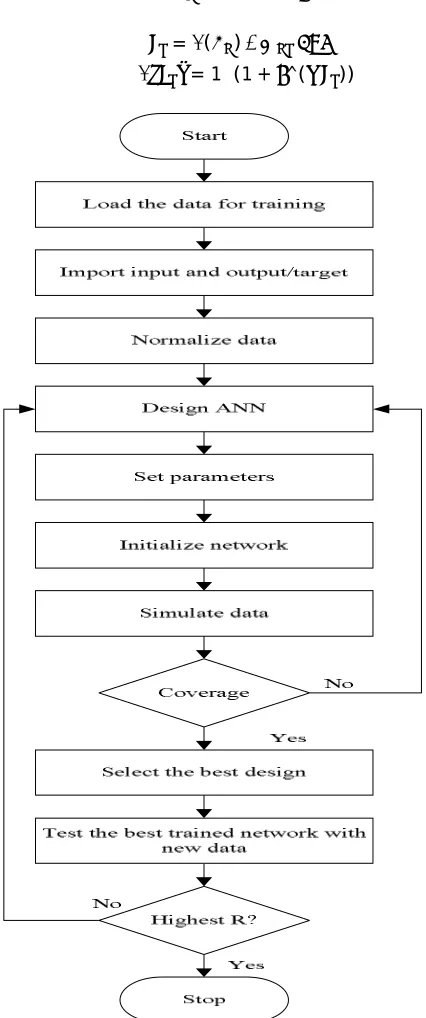
E. Operational Flow Of Ann Classifier
From the training data set , i.e set of data is selected and selected data set pattern is transferred to the network. In ANN classifier the output layer takes the hidden neurons value from hidden layer and calculates the signal output. After calculating the output neurons value the comparison operation take place where present output neuron values are compared with already generated output neurons and the error deal with that is calculated. To reduce the error associated with output neurons are possible by converting the input neurons into hidden layer neurons. This will be helpful in computing the error produced in hidden layer weights. Hidden to output layer weights are calculated as
= +∆ (1)
Input to hidden layer weights is calculated as
Where +∆ and ∆ are weight changes are calculated from above explanation.
The entire flow of ANN classifier is replicated until the results falls to the pre-defined threshold value .
F. Computation Of Neuronal Signals
1) Input layer
( ) = (3)
Where: is the ith component of the input vector presented to the network
2) Hidden layer
= ( )∗ (4)
( ) = 1 (1 +⁄ ) (5)
3) Output layer
[image:8.612.216.429.207.716.2]= ( )∗ (6) = 1 (1 + ^(⁄ − )) (7)
G. SVM Classifier
[image:9.612.197.443.240.437.2]SVM is mainly designed for classification and regression task. The operational principle of SVM is based on VM dimension from statistical learning and Structural Risk Minimization.SVM is correlated with the general category of kernel method. Linear, quadratic, polynomial and radial basis are the common kernel function. A kernel method is an algorithm that mainly based on the data through dot-product; these dot-products can be changed by kernel function which calculates a dot product in some possibly high dimensional feature space. This has two advantages. First, using methods designed for liner classifier, and kernel algorithm has the ability to generate non-linear decision boundaries. Second, kernel function can also apply for a classifier to the fixed- dimensional vector space. SVM is powerful tool for binary classification, and generates very fast classifier functions during training period. An example of a linear two- class classifier is a Support vector machines.SVM includes a two separate object label for data to the individual classes. Assuming labels +1 for positive example and -1 for negative example. Initially considering the examples are vector, where x denotes the vector with elements. {( , )} Where the symbol will denote the vector in a dataset pattern and is the label associated with . considering that the pattern of belongs to some set X.
Figure 6: Operational Flow Chart of SVM Classifier
In linear classifieran inner product is defined as a dot product between two vectors. The key defined as =∑ .A linear classifier is based on a linear discriminant function of the formis given as
( ) = + (8)
A weight vector is denoted by w, and bias is represented by b. In first case b=0 is considered. To acces set of points x in such a way that = 0 are all points that are perpendicular in direction to w and pass the value through the origin — a line represented in two dimensions, a plane in three dimensions, and more generally, a hyperplane. The bias b translates the hyperplane away from the origin. The hyperplane
{ : ( ) = + = 0} (9)
The decision boundary of the classifier is named for the boundary between the regions which is classified as positive and negative. Because of its linear input samples the decision boundary is termed as a hyperplane. A classifier with a linear decision boundary is called a linear classifier. Singularly the classifier said to non-linear when the decision boundary of a classifier mainly based on the data in a non-linear way.
IV. EXPERIMENTAL RESULT
composition before meal and after meal. This data gathering process is repeated for ten different persons. The collected medical data is represented as medical record for further process. A Matlab tool is used for medical data analysis.
Table 1: Normal and Abnormal electrolyte composition in blood sample of a person
Table 2: Normal and Abnormal electrolyte composition in urine sample of a person pH value of Urine
Chloride Sodium Potassium
Normal Condition 98-106mEq/l 25-100mEq/l 25-100mEq/l
No. of un healthy persons (Patients with hypercalcemia) <98 or > 107 mEq/l <25 or >100 mEq/l <25 or >100 mEq/l
For better system performance and to increase the accuracy, model is designed by using ANN and SVM classifier. The output from ANN and SVM classifier are compared during the performance analysis, when the result of both classifiers is equal and meet the predefined condition than the respective person treated as normal otherwise person termed as abnormal. Based on abnormal condition the medical data analysed to determine whether patient related to cancer disease. Clinical reports are considered when both the classifier gives different result. In which output of the ANN and SVM are compared with clinical report. If clinical report matches with ANN output than decision is predicted based on ANN classifier output or else SVM classifier output is considered for health analysis.
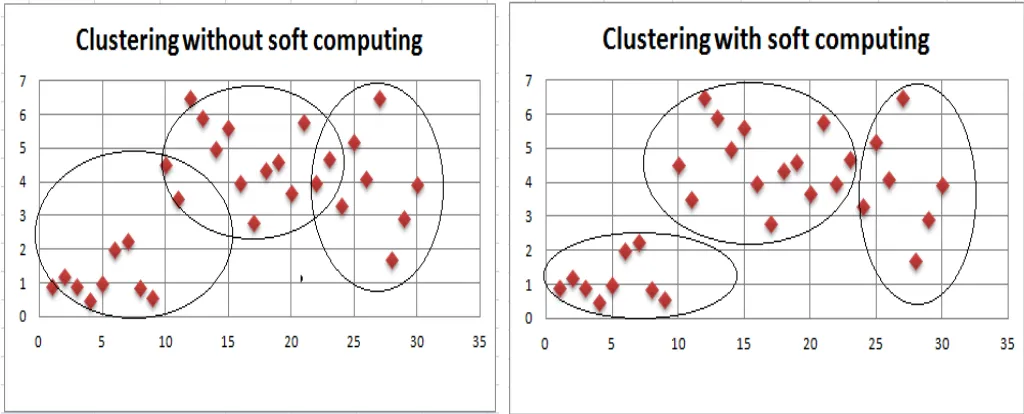
[image:10.612.55.567.500.707.2]A soft computing technique represented with clustering methods in below figure 7. Basically soft computing is an analytical model used with ANN and SVM classifiers to analyse the data and helps in data prediction. When the classifier output is overlapped than it is difficult to make a decision in that situation soft computing play an important role. Hence by using soft computing with clustering method will help to distinguish classifier output and make an effective output.
Figure 7: Clustering Without Using Soft Computing and With Using Soft Computing pH value of Blood
Calcium Sodium Potassium
Normal Condition 4.5-5.5mEq/l 133-146mEq/l 3.5-4.5mEq/l
No. of un healthy persons (Patients with hypercalcemia)
<4.5 or > 5.5mEq/l
<133 or >146 mEq/l
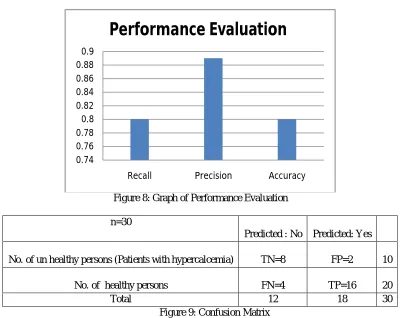
Figure 8: Graph of Performance Evaluation
n=30
Predicted : No Predicted: Yes
No. of un healthy persons (Patients with hypercalcemia) TN=8 FP=2 10
No. of healthy persons FN=4 TP=16 20
Total 12 18 30
Figure 9: Confusion Matrix
Totally N number of people’s medical data is collected. The stored data is analysed and result is represented in confusion matrix as shown in figure 9. Confusion matrix is used to calculate the performance accuracy, precision and recall value of the overall project. The use multiple algorithm in health analysis will increase the work efficiency, reduces the complexity associated with it. The experimental result with classification accuracy is shown in figure 8. The 80% systemaccuracy witnesses the overall effective working of proposed system in health analysis.
V. CONCULSION
The system is designed and a comprehensive model is implemented for the health analysis of normal and abnormal condition of person. Abnormal condition might be leading a cancer, diabetic, and pregnancy, here analysis done based on blood and urine test sample value. Analysis has been done in MATLAB. The database has been divided into two data sets with the records in each of them randomly selected. One of the data set was used for training and other for testing the data, using data fusing technique two different sample values of different patients is integrated. ANN and SVM classifier technique are used training and testing phase. There individual result accuracy is compared, based on the comparison result the overall system accuracy is defined. Finally based on the efficient knowledge base data, physician can make decision, which increase services accuracy in the medical sector.
REFERENCES
[1] Boris Milovic, MilanMilovic, “Prediction and Decison Making in Health Care using Data Mining”, Intenational Journal of Public Health Science(IJPHS), Vol. 1, Issue 2, 2012.
[2] Parvez Ahmad, SaqibQamar, Syed QasimAfserRizvi, “Techniques of Data Mining In Healthcare: A Review”, International Journal of Computer Applications, Vol. 120, Issue 15, 2015.
[3] Shashi Chhikara1, Purushottam Sharma, “Data Mining Techniques on Medical Data for Finding Locally”, International Journal for Research in Applied Science and Engineering Technology, Vol. 1, Issue 5, 2014.
[4] Ruijuan Hu, “Medical Data Mining Based on Decision Tree Algorithm”, Computer and Information Science, Vol. 4, Issue 5, 2011.
[5] D.Lavanya, Dr.K.Usha Rani, “Ensemble Decision Tree Classifier for Breast Cancer Data”, International Journal of Information Technology Convergence and Services(IJITCS), Vol. 2 , Issue 1, 2012.
[6] Yo-Ping Huang, Shin-Liang Lai, FrodeEikaSandnes, and Shen-Ing Liu, “Improving Classification of Medical data Based on Fuzzy ART2 Decision Trees”, International Journal of Fuzzy system, Vol. 14, Issue 3, 2012.Mohammed Abdul Khaleel, Sateesh Kumar Pradham, G.N.Dash, “A Survey of Data Mining
0.74 0.76 0.78 0.8 0.82 0.84 0.86 0.88 0.9
Recall Precision Accuracy
Techniques on Medical Data for Finding Locally FrequenctDieseases”, International Journal of Advanced Research in Computer Science and Software Engineering, Vol.3, Issue 8, 2013.
[7] M. Durairaj, V.Ranjani, “Data Mining Application In Health care Sector: A Study”, International Journal of scientific and Technology Research, Vol. 2, Issue 10, 2013.
[8] HarvinderChauhan, AnuChauhan, “Evaluating Performance of Decision Tree Algorithms”, International Journal of Scientific and Research Publications, Vol. 4, Issue 4, 2014.
[9] Parvathi I, SiddharthRautaray, “Survey on Data Mining Techniques for the Diagnosis of Diseases in Medical Domain”, Vol. 5, Issue 1, 2014.
[10] Surya.K, “Data Mining in the field of Agriculture Banking and Medical”, International Research Journal of Engineering and Technology (IRJET), Vol. 2, Issue 9, 2015.