BIROn - Birkbeck Institutional Research Online
Achilleos, Nick and Arridge, Chris S. and Bertucci, C. and Guio, Patrick and
Romanelli, N. and Sergis, N. (2014) A combined model of pressure variations
in Titan’s plasma environment. Geophysical Research Letters 41 (24), pp.
8730-8735. ISSN 0094-8276.
Downloaded from:
Usage Guidelines:
Please refer to usage guidelines at
or alternatively
RESEARCH LETTER
10.1002/2014GL061747
Key Points:
• Titan’s plasma environment responds to global changes in hot plasma pressure
• Titan is exposed to highly variable upstream plasma beta and dynamic pressure
• Including hot plasma variability improves agreement between models and data
Supporting Information:
• Readme • Figure S1 • Figure S2 • Figure S3 • Text S1
Correspondence to:
N. Achilleos,
Citation:
Achilleos, N., C. S. Arridge, C. Bertucci, P. Guio, N. Romanelli, and N. Sergis (2014), A combined model of pressure variations in Titan’s plasma environment,Geophys. Res. Lett.,41, 8730–8735, doi:10.1002/2014GL061747.
Received 12 SEP 2014 Accepted 11 NOV 2014
Accepted article online 17 NOV 2014 Published online 29 DEC 2014
This is an open access article under the terms of the Creative Commons Attribution License, which permits use, distribution and reproduction in any medium, provided the original work is properly cited.
A combined model of pressure variations
in Titan’s plasma environment
N. Achilleos1,2,3, C. S. Arridge2,4,5, C. Bertucci6, P. Guio1,2, N. Romanelli6, and N. Sergis7
1Department of Physics and Astronomy, University College London, London, UK,2Centre for Planetary Sciences at
UCL/Birkbeck, University College London, London, UK,3Japan Aerospace Exploration Agency Institute of Space and
Astronautical Science, Sagamihara, Japan,4Mullard Space Science Laboratory, Dorking, UK,5Department of Physics,
Lancaster University, Lancaster, UK,6Instituto de Astronomía y Física del Espacio, University of Buenos Aires, Buenos Aires,
Argentina,7Office for Space Research and Technology, Academy of Athens, Athens, Greece
Abstract
In order to analyze varying plasma conditions upstream of Titan, we have combined a physical model of Saturn’s plasma disk with a geometrical model of the oscillating current sheet. During modeled oscillation phases where Titan is farthest from the current sheet, the main sources of plasma pressure in the near-Titan space are the magnetic pressure and, for disturbed conditions, the hot plasma pressure. When Titan is at the center of the sheet, the main sources are the dynamic pressure associated with Saturn’s cold, subcorotating plasma and the hot plasma pressure under disturbed conditions. Total pressure at Titan (dynamic plus thermal plus magnetic) typically increases by a factor of up to about 3 as the current sheet center is approached. The predicted incident plasma flow direction deviates from the orbital plane of Titan by≲ 10◦. These results suggest a correlation between the location of magnetic pressure maxima and the oscillation phase of the plasma sheet. Our model may be used to predict near-Titan conditions from “far-field” in situ measurements.1. Introduction
Titan is usually embedded within the rotating magnetosphere of Saturn, a configuration which leads to the formation of a “flow-induced” magnetosphere, via the draping of the magnetic field in the subcoro-tating flow about the moon (Titan’s orbital speed of∼6 km s−1is small compared to the typical speed of
the rotating plasma,∼120 km s−1). Recently,Bertucci et al.[2009] demonstrated, using Cassini data, that the
direction and magnitude of the magnetic field upstream of Titan vary, depending mainly on whether Titan is located above or below Saturn’s magnetospheric current sheet. Titan’s distance from the current sheet is influenced by global magnetospheric oscillations at Saturn, which change the elevation of the current sheet with respect to the rotational equatorial plane. The sheet geometry was modeled byArridge et al.[2011b] (hereafter A11).
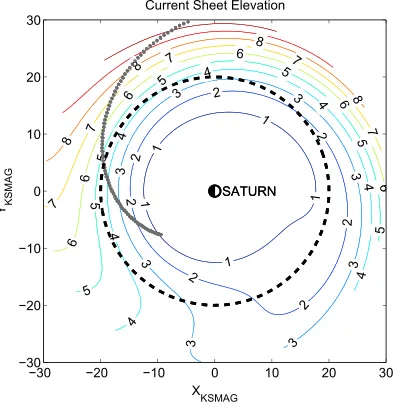
In Figure 1, we plot one example of current sheet elevation,ZCS, from this A11 model. For constant radial distance (e.g., along Titan’s orbit),ZCSwill vary with azimuth, i.e., there is a “ripple” in the sheet surface. For
southern summer,ZCSis everywhere positive; hence, the azimuthally averaged surface forms a “bowl-like”
shape. We have combined the A11 model of sheet geometry with the Saturn plasma disk model ofAchilleos et al.[2010a] (hereafter Ach10), updated byAchilleos et al.[2010b], in order to predict the variable magnetic and plasma parameters during the T15 encounter of Titan by the Cassini spacecraft (closest approach occurred on 2 July 2006 at 09:21 UTC, at altitude∼1900 km). This analysis enables us to predict the variations which arise from plasma sheet oscillations. In future, we aim to repeat the analysis for additional Titan encounters, and so provide a theoretical analog of observational classifications of the Titan environ-ment, such as those ofRymer et al.[2009] andSimon et al.[2010]. We have also chosen T15 for the present analysis because we have obtained relevant plasma moment data which we compare with our model results herein.
Geophysical Research Letters
10.1002/2014GL061747
Figure 1.Plasma sheet geometry: Contours indicate the alti-tudeZCS(in units of Saturn radiiRS) of the A11 model current
sheet above Saturn’s rotational equator (see text). The geom-etry shown is for southern summer. The black, dashed circle is Titan’s orbit, and the gray squares represent a curve of con-stant “phase” in the sheet—this curve passes through the point of maximumZCSat each radial distance. TheXKSMAG axis is the intersection of the rotational equator and the noon meridian of Saturn local time (SLT). The whole pattern rotates with a variable period, following that of the SKR.
2. Plasma Disk Model Description
For this study, we require a “two-component” model of Saturn’s plasma disk. The first compo-nent is the A11 geometrical model of the current sheet, illustrated in Figure 1. For cylindrical radial distance exceeding∼12RS, the altitudeZCSof the current sheet (with respect to Saturn’s rotational equator) is given by A11:
ZCS= [𝜌−RHtanh(𝜌∕RH)]tan(−𝜃⊙)
+tan(𝜃T) (𝜌−𝜌o)cos(𝜆), 𝜌 >12RS (1)
where the first term represents the axisymmetric bowl and the second term the spatial oscillation, or ripple. Symbols have the following meanings:
𝜌is cylindrical radial distance with respect to the planet’s rotational/magnetic axis,RHis the hinging distance which controls the curvature of the bowl,𝜃⊙is the subsolar latitude at Saturn (positive for northern latitude, negative for southern),𝜃Tis an effective angle of tilt for the current sheet,𝜌o=12RSis a scaling distance which controls the amplitude of the ripple.𝜆 represents the following phase angle for describing plasma sheet oscillation, dependent on both position and time:
𝜆=𝜆SLS3−𝜆o− ΩSKR(𝜌−𝜌o)∕VWAVE, (2)
where SLS3 denotes the longitude ofKurth et al.[2008], based on fitting a low-order polynomial to the non-stationary period of the Saturn Kilometric Radiation (SKR). Since SLS3 was developed, distinct SKR signals have been identified in Saturn’s northern and southern hemisphere [e.g.,Lamy, 2011]—the SLS3 phase lies consistently within∼30◦of that of the southern SKR source [Andrews et al., 2010]. A “prime meridian” param-eter denoted by𝜆ois fitted by A11 to different passes of Cassini data.ΩSKRis a variable angular velocity corresponding to the SLS3 period.VWAVEis a “wave speed” parameter which introduces a systematic delay of the oscillation phase with radial distance (see Figure 1). The T15 Titan encounter occurred during Cassini’s Revolution 25. We thus adopt sheet parameters consistent with those used by A11 for their Rev 25 model fit, namely,𝜆o=100◦,VWAVE=5RSh−1,R
H=16RS,𝜃T =12◦,𝜌o=12RS.
The second component of our plasma disk model provides magnetic field and plasma distributions for an axisymmetric, rotating magnetosphere in force balance (see Ach10 and supporting information). The Ach10 model assumes north-south symmetry, with a current sheet lying in the rotational equator. Any plasma parameter is a function of two coordinates, e.g.,𝜌𝜇andZ𝜇, the respective cylindrical radial distance and alti-tude (with respect to the rotational equator) in the “Ach10 model space.” In order to combine the Ach10 model with the A11 sheet geometry, we calculate “equivalent Ach10 model coordinates” corresponding to the spacecraft’s actual location:
𝜌𝜇=𝜌S∕C,Z𝜇= (ZS∕C−ZCS)ẑ⋅n̂,r𝜇= (𝜌2𝜇+Z𝜇2)1∕2,cos𝜃𝜇 =Z𝜇∕r𝜇, (3)
where𝜌S∕Cis the spacecraft’s actual cylindrical radial distance from the planet’s rotation / dipole axis,ZS∕C
andZCSare the respective altitudes of the spacecraft and the A11 current sheet with respect to the
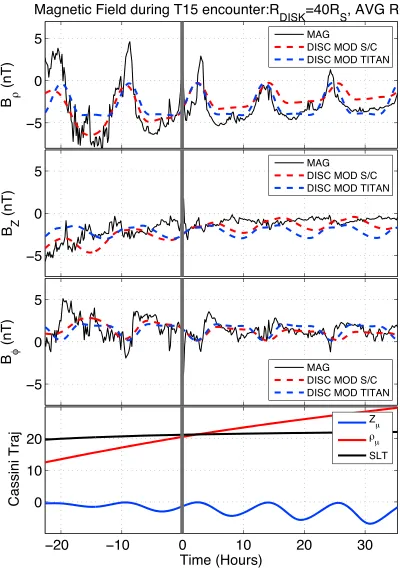
Figure 2.(first to third panels) Cylindrical components of the magnetic field (in units of nano-Tesla, nT) observed by Cassini, and predicted by the model, during several magnetospheric oscillations before and after the T15 wake crossing (vertical gray line). The zero of time indicates closest approach to Titan. Plotted data were generated by smoothing the mag-netometer (MAG) 1 min averaged data (cadence of 1 min) using a 10-point boxcar filter, then downsampling to one sample every 10 min. Model fields for both Cassini and Titan-center-based observers are shown. (fourth panel) Equiv-alent Ach10 model coordinates along the spacecraft trajectory. Z𝜇indicates perpendicular distance from the spacecraft to the A11 current sheet.
The final form of the model field components is given by an internal centered dipole (Ach10), aligned with Saturn’s rotation axis, combined with an external component “anchored” to the A11 geometry, as follows:
B=Bdip+Bext, Bext= ΔB𝜌𝝆CŜ + ΔBZn̂
+B𝜙𝝓CS, ̂̂ 𝝆CS= 𝝓ROT̂ ×n̂
|𝝓ROT̂ ×n̂|, ̂𝝓CS=n̂×𝝆CŜ
(4)
where theΔBquantities are the cylindrical exter-nal field components (total field minus interexter-nal dipole) from the Ach10 model, interpolated on the model grid at “equivalent coordinates”
r𝜇,cos𝜃𝜇from equation (3). TheΔBrepresents external currents and include a minor magne-topause “shielding field.” Unit vectors𝝆CŜ ,𝝓CŜ lie in the tangent plane of the A11 sheet, while
̂
𝝓ROTlies in the local direction of planetary coro-tation. Adapting the approach of A11, we add an azimuthal fieldB𝜙= −1
2ΔB𝜌to represent the
azimuthal “bending” of the field lines.
3. Comparison of Plasma Disk Models
and T15 Observations
In Figure 2, we show the observed and modeled components of the magnetic field in cylindrical coordinates. The two Ach10 model parame-ters explored, in order to fit the data, are the effective magnetodisk radiusRDISK(which is the
equatorial radius of the axisymmetric model’s outer boundary/magnetopause) and a proxy for the ring current activity which makes use of the global hot plasma pressure, based on multiorbit statistics of the pressure moments from the Cassini Magnetospheric Imaging Instrument (MIMI) [seeAchilleos et al., 2010b;Sergis et al., 2007]. The model field shown is forRDISK =40RS
and average ring current (equivalent to hot plasma pressurePH = 2×10⁻³nPaat Titan’s orbit). We show
several magnetospheric oscillations. The fits to the amplitude and phase of theB𝜌(radial) andB𝜙(azimuthal) fields are reasonable, although (i) the displayedB𝜌data show a change in sign during most oscillations, indicative of passage north of the current sheet plane, which is not reproduced with the model, and (ii) theB𝜙fluctuations show a much steeper “rising” part compared to the model, suggesting that the plasma sheet ripple exhibits structure more complex than a sinusoidal form (equation (1)). The modelBZis almost in
antiphase with the observation, also suggesting additional plasma sheet structure beyond our “wavy disk” model (e.g., a rotating azimuthal anomaly in hot pressure has been proposed byBrandt et al.[2010]). Impor-tantly, the predicted fields for a Titan-center-based observer can have significantly different amplitudes and mean values from the fields at the spacecraft, highlighting the need for reliable models in order to predict near-Titan conditions when using data acquired at further distances (>> 50Titan radii). We show a simi-lar plot in the supporting information for a disturbed ring current model, for which the profile ofPhV𝛼, the
product of hot plasma pressure and flux tube volume, was increased to twice the values for the “disturbed ring current” ofAchilleos et al.[2010b], and the disk radius reduced to 35RSin order to facilitate obtaining a
Geophysical Research Letters
10.1002/2014GL061747
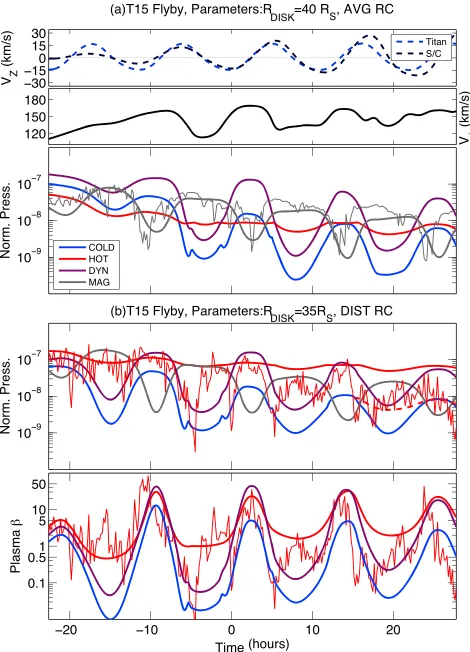
Figure 3.(a) Model predictions for a disk of effective radiusRDISK=40RS and average ring current level (see text). (top) Predicted vertical velocity components for the plasma sheet for the same time interval as Figure 2. (middle) Model azimuthal velocities for the cold plasma on planetary flux tubes conjugate to the spacecraft. (bottom) Predicted pressure contri-butions, color coded according to physical origin. Pressure is normalized through division byB2
o∕𝜇o, whereBo=21,160 nT is approximate
equato-rial field strength at the surface of Saturn. (b) Model predictions for a disk of effective radiusRDISK = 35RSand a disturbed ring current level (see text) (using same time interval as Figure 3a). (top) Pressure contributions, color coded according to physical origin (for clarity, the hot pressure model from Figure 3a, at times>15 h, is shown as a red dashed curve). (bottom) Plasma beta parameters corresponding to the model pressures and to the observed hot plasma/magnetic pressure.
In Figure 3a, we show model plasma parameters corresponding to the field model of Figure 2. The verti-cal velocityVZof the plasma sheet
is similar for Titan and Cassini refer-ence frames near closest approach, with values up to∼30 km s−1.
Simi-lar vertical velocities were measured by the Cassini plasma spectrometer (CAPS) during the T15 flyby [Sillanpää et al., 2011]. The azimuthal veloc-ity of the cold plasma, lying on field lines conjugate with the spacecraft, is shown in Figure 3a (middle). The largest northward excursions of the plasma sheet (zero-crossing points which occur after the positive maxima inVZ) are accompanied by decreases inV𝜙as the spacecraft moves away from the current sheet and connects to flux tubes extending to larger radial distances, which rotate more slowly. Note thatV𝜙for the inter-val shown, combined with theVZ
for the Titan frame, indicate that the upstream plasma flow direction is tilted with respect to the rotational equator by angles≲ 12◦. The loca-tion of maximum magnetic pressure along draped flux tubes would also be expected to deviate from the rotational equator, for appropriate oscillation phases.
The observed magnetic field is dom-inantly radial outside the current sheet. The maximum value of|B𝜌∕BZ|
for the interval shown is∼20, which also equals the maximum ratio
|EZ∕E𝜌|for the convective electric
field (seeArridge et al.[2011a] for more details).
In Figure 3b, we compare observed and modeled hot plasma pressure using the disturbed-ring-current model described above. Comparing the red curves (Figure 3b, top), the observed hot plasma pressure rea-sonably agrees with the model over the time interval containing the first three sheet encounters (≲ 7h). Interestingly, the average-ring-current hot pressure model (superposed red dashed curve) is clearly a better match to the data for times later than∼15 h after Titan closest approach. The data show additional variability in hot pressure, partly due to plasma injections and ion beams, which are not explicitly modeled. This disturbed-ring-current model, in comparison to the average-ring-current case (Figure 3a), shows more comparable values of magnetic and hot pressure in the lobes of the sheet (more details of models in the supporting information).
Figure 3b (bottom) shows model plasma beta parameters and the observed hot plasma beta from the Cassini data. The model hot plasma beta (𝛽h) varies between∼0.5 and 30, while the observed𝛽hreaches values as low as∼0.005. A “pseudo” plasma beta may be defined for the dynamic pressure (Ach10) accord-ing to𝛽d=Pdyn∕Pmag, where subscripts indicate dynamic and magnetic pressures.𝛽dshows local maximum values similar to those for𝛽h. The thermal cold plasma beta,𝛽c, shows the lowest model values, down to
∼2% of𝛽h. The ratio𝛽c∕𝛽dhas minimum values of∼10%, indicating that the bulk kinetic energy of the cold plasma ions far exceeds their thermal energy.
4. Conclusions
We have calculated a plasma disk model for conditions at the orbit of Titan during the T15 encounter by Cassini. Our model reproduces some of the large-scale variability in the observed magnetic field, although more complex structure for the ripple in the current sheet is required for better agreement. The model outputs are in reasonable agreement with the Cassini observations of magnetic pressure and hot plasma pressure.
For magnetospheric oscillation phases where Titan is farthest from the current sheet, the field is strongly radial and the dominant source of pressure is the magnetic or hot plasma pressure. For phases where Titan is near the center of the sheet, the dominant sources are dynamic and hot plasma pressure. Magnetospheric oscillations also control changes in vertical and azimuthal velocities of the cold plasma for a Titan-based observer. In our model, the incident direction of cold plasma flow may be displaced from Titan’s orbital plane by angles of the order∼10◦. This result is in good agreement with observations of the plasma flow velocity bySillanpää et al.[2011].
Finally, the plasma disk oscillations and global changes in the hot plasma pressure lead to a wide range of plasma beta regimes in which Titan may be immersed. The hot plasma beta may be as high as∼30 for phases when Titan is at the center of the disk. The cold plasma beta is lower by a factor of∼5 for the model sheet encounter closest to Titan. A pseudo plasma beta associated with the cold plasma dynamic pressure is comparable to or higher than the hot plasma beta near the disk center, depending on ring current state. This variability in plasma conditions presents a complex requirement for modeling studies. Other models use time-dependent MHD approaches to simulate the plasma flow and periodicities [e.g.,Winglee et al., 2013;Jia et al., 2012]. Our model, however, has allowed us to quantify the importance of both hot and cold particle pressure in shaping the near-Titan magnetic and plasma conditions. Our future work will compre-hensively explore the response of all near-Titan pressure components and magnetic field to (i) changes in solar wind dynamic pressure and (ii) changes in global hot plasma content. Our model may be used to predict near-Titan conditions from far-field in situ measurements and also to predict plasma moments for observational situations where these are scarce, but magnetic measurements are available.
References
Achilleos, N., P. Guio, and C. S. Arridge (2010a), A model of force balance in Saturn’s magnetodisc,Mon. Not. R. Astron. Soc.,401, 2349–2371, doi:10.1111/j.1365-2966.2009.15865.x.
Achilleos, N., P. Guio, C. S. Arridge, N. Sergis, R. J. Wilson, M. F. Thomsen, and A. J. Coates (2010b), Influence of hot plasma pressure on the global structure of Saturn’s magnetodisk,Geophys. Res. Lett.,37, L20201, doi:10.1029/2010GL045159.
Andrews, D. J., A. J. Coates, S. W. H. Cowley, M. K. Dougherty, L. Lamy, G. Provan, and P. Zarka (2010), Magnetospheric period oscilla-tions at Saturn: Comparison of equatorial and high-latitude magnetic field periods with north and south Saturn kilometric radiation periods,J. Geophys. Res.,115, A12252, doi:10.1029/2010JA015666.
Arridge, C. S., N. Achilleos, and P. Guio (2011a), Electric field variability and classifications of Titan’s magnetoplasma environment,Ann. Geophys.,29, 1253–1258, doi:10.5194/angeo-29-1253-2011.
Arridge, C. S., et al. (2011b), Periodic motion of Saturn’s nightside plasma sheet,J. Geophys. Res.,116, A11205, doi:10.1029/2011JA016827.
Acknowledgments
We acknowledge the continued collaboration of the Cassini magne-tometer (MAG) and plasma (CAPS and MIMI) instrument teams. N.A. acknowledges useful discussions with colleagues at JAXA and was supported for this work by UK STFC Consolidated grant ST/J001511/1 (UCL Astrophysics). C.S.A. was funded by a Royal Society Research Fellow-ship. C.B. acknowledges the financial support of the Europlanet Expert Exchange programme. Further details of magnetodisk model outputs and observational data used in this study are available from the first author upon request. N.R. is supported by a PhD grant from CONICET.
Geophysical Research Letters
10.1002/2014GL061747
Bertucci, C., B. Sinclair, N. Achilleos, P. Hunt, M. K. Dougherty, and C. S. Arridge (2009), The variability of Titan’s magnetic environment,
Planet. Space Sci.,57, 1813–1820, doi:10.1016/j.pss.2009.02.009.
Brandt, P. C., K. K. Khurana, D. G. Mitchell, N. Sergis, K. Dialynas, J. F. Carbary, E. C. Roelof, C. P. Paranicas, S. M. Krimigis, and B. H. Mauk (2010), Saturn’s periodic magnetic field perturbations caused by a rotating partial ring current,Geophys. Res. Lett.,37, L22103, doi:10.1029/2010GL045285.
Jia, X., K. C. Hansen, T. I. Gombosi, M. G. Kivelson, G. Tóth, D. L. DeZeeuw, and A. J. Ridley (2012), Magnetospheric configuration and dynamics of Saturn’s magnetosphere: A global MHD simulation,J. Geophys. Res.,117, A05225, doi:10.1029/2012JA017575. Kurth, W. S., T. F. Averkamp, D. A. Gurnett, J. B. Groene, and A. Lecacheux (2008), An update to a Saturnian longitude system based on
kilometric radio emissions,J. Geophys. Res.,113, A05222, doi:10.1029/2007JA012861.
Lamy, L. (2011), Variability of southern and northern periodicities of Saturn Kilometric Radiation, paper presented at Seventh International Workshop Planetary, Solar and Heliospheric Radio Emissions (PRE VII), Graz, Austria, 15–17 Sept.
Rymer, A. M., H. T. Smith, A. Wellbrock, A. J. Coates, and D. T. Young (2009), Discrete classification and electron energy spectra of Titan’s varied magnetospheric environment,Geophys. Res. Lett.,36, L15109, doi:10.1029/2009GL039427.
Sergis, N., S. M. Krimigis, D. G. Mitchell, D. C. Hamilton, N. Krupp, B. M. Mauk, E. C. Roelof, and M. Dougherty (2007), Ring current at Saturn: Energetic particle pressure in Saturn’s equatorial magnetosphere measured with Cassini/MIMI,Geophys. Res. Lett.,34, L09102, doi:10.1029/2006GL029223.
Sergis, N., S. M. Krimigis, D. G. Mitchell, D. C. Hamilton, N. Krupp, B. H. Mauk, E. C. Roelof, and M. K. Dougherty (2009), Energetic particle pressure in Saturn’s magnetosphere measured with the Magnetospheric Imaging Instrument on Cassini,J. Geophys. Res.,114, A02214, doi:10.1029/2008JA013774.
Sillanpää, I., D. T. Young, F. Crary, M. Thomsen, D. Reisenfeld, J.-E. Wahlund, C. Bertucci, E. Kallio, R. Jarvinen, and P. Janhunen (2011), Cassini Plasma Spectrometer and hybrid model study on Titan’s interaction: Effect of oxygen ions,J. Geophys. Res.,116, A07223, doi:10.1029/2011JA016443.
Simon, S., A. Wennmacher, F. M. Neubauer, C. L. Bertucci, H. Kriegel, J. Saur, C. T. Russell, and M. K. Dougherty (2010), Titan’s highly dynamic magnetic environment: A systematic survey of Cassini magnetometer observations from flybys TA-T62,Planet. Space Sci.,58, 1230–1251, doi:10.1016/j.pss.2010.04.021.