R E S E A R C H
Open Access
Relationship between thyroid function and ICU
mortality: a prospective observation study
Feilong Wang
1†, Wenzhi Pan
2†, Hairong Wang
1†, Shuyun Wang
1, Shuming Pan
1*and Junbo Ge
2*Abstract
Introduction:Although nonthyroidal illness syndrome is considered to be associated with adverse outcome in ICU patients, the performance of thyroid hormone levels in predicting clinical outcome in ICU patients is unimpressive. This study was conducted to assess the prognostic value of the complete thyroid indicators (free triiodothyronine (FT3), total triiodothyronine; free thyroxine, total thyroxine, thyroid-stimulating hormone and reverse
triiodothyronine) in unselected ICU patients.
Methods:A total of 480 consecutive patients without known thyroid diseases were screened for eligibility and followed up during their ICU stay. We collected each patient’s baseline characteristics, including the Acute Physiology and Chronic Health Evaluation II (APACHE II) score and thyroid hormone, N-terminal pro-brain natriuretic peptide (NT-proBNP) and C-reactive protein (CRP) levels. The primary outcome was ICU mortality. Potential predictors were analyzed for possible association with outcomes. We also evaluated the ability of thyroid hormones together with APACHE II score to predict ICU mortality by calculation of net reclassification
improvement (NRI) and integrated discrimination improvement (IDI) indices.
Results:Among the thyroid hormone indicators, FT3 had the greatest power to predict ICU mortality, as
suggested by the largest area under the curve (AUC) of 0.762 ± 0.028. The AUC for FT3 level was less than that for APACHE II score (0.829 ± 0.022) but greater than that for NT-proBNP level (0.724 ± 0.030) or CRP level (0.689 ± 0.030). Multiple regression analysis revealed that FT3 level (standardizedb = -0.600,P= 0.001), APACHE II score (standardizedb= 0.912,P< 0.001), NT-proBNP level (standardizedb= 0.459, P= 0.017) and CRP level
(standardizedb= 0.367,P= 0.030) could independently predict primary outcome. The addition of FT3 level to APACHE II score gave an NRI of 54.29% (P< 0.001) and an IDI of 36.54% (P< 0.001). The level of FT3 was significantly correlated with NT-proBNP levels (r= -0.344,P< 0.001) and CRP levels (r = -0.408,P< 0.001). Conclusion:In unselected ICU patients, FT3 was the most powerful and only independent predictor of ICU mortality among the complete indicators. The addition of FT3 level to the APACHE II score could significantly improve the ability to predict ICU mortality.
Introduction
During critical illness, changes in circulating hormone levels are a common phenomenon [1]. These alterations are correlated with the severity of morbidity and the outcomes of patients in ICUs [2,3]. Thyroid hormones play a key role in the maintenance of body growth by
modulating metabolism and the immune system. In the 20th century, researchers found that thyroid dysfunction is associated with the mortality of patients admitted to the ICU [4-6]. These alterations in thyroid hormone levels are referred to as “euthyroid sick syndrome”[7,8] or“nonthyroidal illness syndrome”(NTIS) [9,10], which is characterized by low serum levels of free and total triiodothyronine (T3) and high levels of reverse T3 (rT3) accompanied by normal or low levels of thyroxine (T4) and thyroid-stimulating hormone (TSH). Subse-quent studies confirmed the association between NTIS and adverse outcomes in patients with sepsis [11,12], multiple trauma [13], acute respiratory distress
* Correspondence: [email protected]; [email protected] †Contributed equally
1Department of Emergency, Xinhua Hospital of Shanghai Jiaotong, No. 1665, Kongjiang Road, Shanghai, 200092, China
2Department of Cardiology, Shanghai Institute of Cardiovascular Diseases, Zhongshan Hospital of Fudan University, No. 180, Fenglin Road, Shanghai, 200032, China
Full list of author information is available at the end of the article
syndrome [14], respiratory failure [15] and mechanical ventilation [16], as well as in unselected ICU patients [5,6,17-23]. However, the performance of thyroid hor-mones as predictors of adverse outcomes in general ICU patients has been unimpressive until now.
First, the results of previous studies were inconsistent. Researchers in some studies [16,17] demonstrated that free triiodothyronine (FT3) levels in nonsurvivors were significantly lower than those in survivors, whereas other researchers [18] showed that there was no associa-tion between FT3 levels and ICU patient outcomes. Conflicting results also were reported in terms of other indicators, such as total triiodothyronine (TT3) [17-20], free thyroxine (FT4) [17,18,20,23], total thyroxine (TT4) [5,6,17-19,22] and TSH [5,6,17-23].
Second, most of these studies [5,6,17-23] were rather small and evaluated the prognostic value of some but not all thyroid hormone indicators. Until now, none of the thyroid hormone indicators has been found to be the best predictor of ICU mortality.
Third, researchers in a few studies have detected the independent predictive ability of thyroid hormones [5,17,18,20,23] or have assessed the ability of thyroid hormones together with a scoring system to predict ICU mortality [5,19]. In our previous study, we showed that N-terminal pro-brain natriuretic peptide (NT-proBNP) and C-reactive protein (CRP) are independent predictors of ICU mortality [24].
Whether thyroid hormone indicators can predict ICU mortality independently of both predictors is unclear. These variables’performance in predicting ICU mortal-ity has not yet been compared. We therefore undertook a prospective, observational study of a large population of unselected medical ICU patients to detect the inde-pendent predictors of ICU mortality on the basis of the complete panel of thyroid hormone levels (FT3, TT3, FT4, TT4, TSH, rT3 and T3/rT3) and to evaluate the ability of thyroid hormone level together with Acute Physiology and Chronic Health Evaluation II (APACHE II) score to predict ICU mortality.
Materials and methods Participants
This prospective, observational study involved consecu-tive adult patients admitted to the ICU of Xin-Hua Hospital, which is affiliated with Shanghai Jiaotong University School of Medicine, between January 2009 and March 2010. The population in the present study was described in our pervious study [24]. We decided
a priori, however, to exclude patients who met the fol-lowing criteria: (1) age younger than 18 years; (2) his-tory of any thyroid diseases, such as hyperthyroidism, hypothyroidism and thyroid tumors; (3) thyroid nodule found by physical examination when admitted to the
ICU; (4) pregnancy within the previous 6 months; and (5) undergoing any hormonal therapy except insulin use or taking oral amiodarone. Patients who died or were discharged from the ICU within 4 hours of admission were also excluded, because data collection from these patients was difficult. The study was approved by Shanghai Jiaotong University Xin Hua Hospital Ethics Committee (XHEC2011-011) and was carried out in accordance with the Declaration of Hel-sinki. Because this was an observational study and all laboratory indices observed were commonly measured for all patients in our ICU department, the need for written informed consent was waived by the ethical review board.
Measurements
TSH, TT3, FT3, TT4 and FT4 levels were measured using the ADVIA Centaur immunoassay system (Sie-mens Healthcare Diagnostics Inc, Tarrytown, NY, USA). rT3 level was measured using the Maglumi 1000 Analy-zer chemiluminescence immunoassay system (SNIBE Co, Ltd, Guandong, China). The normal ranges of serum hormone concentrations in our laboratory are as follows: FT3, 3.5 to 6.5 pmol/L; TT3, 0.60 to 1.81 ng/ ml; FT4, 11.5 to 22.7 pmol/L; TT4, 45 to 109 ng/ml; TSH, 0.35 to 5.50 mIU/L; and rT3, 0.16 to 0.95 ng/ml. Intra-assay coefficients of variation for FT3 range from 2.35% to 3.08%; for TT3, they range from 1.45% to 3.18%; for FT4, they range from 2.23% to 3.33%; for TT4, they range from 1.19% to 3.15%; for TSH, they range from 2.1% to 3.8%; and for rT3, the coefficient of variation is 4.52%. Serum creatinine and albumin levels were measured using the Hitachi 7600-120 analyzer (Hitachi, Tokyo, Japan). We calculated the estimated glomerular filtration rate (eGFR) by using the abbre-viated Modification of Diet in Renal Disease study equa-tion [25]. Serum CRP levels were measured using the QuikRead CRP test kit (Orion Diagnostica, Espoo, Fin-land). Intra-assay coefficients of variation ranged from 2% at 140 mg/L to 15% at 9 mg/L. The NT-proBNP level was determined using the Elecsys electrochemilu-minescence assay (Cobas e 411 analyzer; Roche Diag-nostics; Mannheim, Germany). The reported total coefficients of variation are 4.4% at mean concentrations 248.9 ng/L and 3.91% at 5,449 ng/L, respectively. Blood samples were obtained from all eligible patients when they were admitted to ICU for measurement of the indi-cators mentioned previously.
Study outcome
during their hospitalization. The primary outcome of this analysis was death in the ICU due to any cause.
Statistical analysis
Continuous variables are presented as mean values ± SD or medians and ranges, and categorical variables are expressed as percentages. CRP and NT-proBNP values were logarithmically normalized and are presented as log(CRP) and log(NT-proBNP) for statistical calcula-tions, respectively, because they were very skewed. Base-line characteristics between survivors and nonsurvivors were compared with an unpaired Student’st-test or the Mann-WhitneyUtest for continuous variables and ac2 test or Fisher’s exact test for categorical variables. Recei-ver operating characteristic (ROC) curves were used to examine the performance of variables in predicting ICU mortality. The area under the curve (AUC, that is, C-index) was calculated from the ROC curve. A statisti-cally derived value based on the Youden’s index that maximized the sum of the sensitivity and specificity was used to define the optimal cutoff value [26]. Univariate logistic regression analyses were performed to examine the association between mortality and each of the pre-dictors separately. We also conducted forward stepwise multivariate logistic regression analysis to determine the independent predictors of ICU mortality. Criteria of P< 0.05 for entry andP≥0.10 for removal were imposed in this procedure. Cox & SnellR2 and Nagelkerke R2 cor-relation coefficients were calculated to assess the good-ness of fit of the models [27]. ORs for the continuous variables were described using standardized ORs, which were associated with a 1-SD change in the variable. The increased discriminative predictive value of the FT3 level in addition to the APACHE II score was examined by calculation of net reclassification improvement (NRI) and integrated discrimination improvement (IDI) indices as described by Pencina et al. [28]. NRI is the net increase vs the net decrease in risk categories among case patients minus that among control participants. It requires that there exista priorimeaningful risk cate-gories (we used less than 10%, 10% to 30%, 30% to 50% and more than 50% for the risk of ICU death) [24,29]. IDI is the difference in Yates slopes between models, in which the Yates slope is the mean difference in pre-dicted probabilities between case patients and control participants [29]. A two-sidedPvalue less than 0.05 was considered statistically significant. All analyses were per-formed using SPSS version 13.0 software (SPSS, Inc, Chicago, IL, USA).
Results
Baseline characteristics
A total of 480 consecutive patients (59.79% male, mean age 71.71 ± 15.52 years) were eligible for enrollment in
this study. The baseline clinical and laboratory charac-teristics of the patients are listed in Table 1. On the basis of the normal ranges given above, 23 (4.79%), 53 (11.04%), 261 (54.38%) and 48 (10.00%) patients had low T3, low T4, low FT3 and low FT4 levels, respectively, and 17 (3.54%) and 30 (6.25%) patients had high TSH and rT3 levels, respectively. The mean APACHE II score was 12.91 ± 6.67 points. The primary reasons for ICU admission were cardiovascular disease and pulmon-ary disease. A total of 91 patients (19.13%) died during their ICU stay. The levels of TT3, TT4, FT3, FT4, TSH and T3/rT3 were lower in nonsurvivors than in survi-vors (all P< 0.01) (Table 1), but there were no signifi-cant differences in rT3 levels between the groups (P= 0.401) (Table 1). Compared with survivors (see Table 1), nonsurvivors were older (76.32 ± 13.28 years vs 70.62 ±
15.82 years, P = 0.0001) and had higher APACHE II
scores (19.49 ± 6.85 vs 11.38 ± 5.60,P < 0.0001), higher levels of NT-proBNP (P< 0.0001) and CRP (P< 0.0001) and lower levels of hemoglobin (P< 0.0001) and eGFR (P< 0.001).
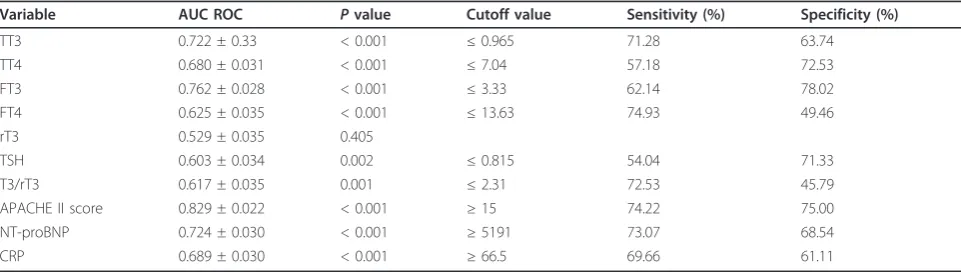
Value of indicators in predicting ICU mortality
ROC curves were constructed to examine the perfor-mance of indicators as predictors of ICU mortality, then the AUC for each indicator was calculated. The AUC, optimal cutoff value, sensitivity and specificity of each indicator are given in Table 2. Among the thyroid hor-mone indicators, FT3 had the greatest power for pre-dicting ICU mortality, as suggested by the largest AUC of 0.762 ± 0.028. The AUC for FT3 was less than that for APACHE II score (0.829 ± 0.022) but greater than that for NT-proBNP level (0.724 ± 0.030) or CRP level (0.689 ± 0.030), as shown in Figure 1A. We performed univariate logistic regression analyses to examine the association between the ICU mortality and each indica-tor and calculated the standardized coefficient (b) and OR for each variable (Table 3). FT3 had the greatest absolute value of standardizedb(1.129) among the thyr-oid hormone indicators. The absolute value of
standar-dized b for FT3 was also larger than that for
NT-proBNP level (0.930) or CRP level (0.707), indicating that FT3 had greater power than NT-proBNP or CRP level for predicting ICU mortality.
Independent predictive value of FT3
improved the ability to predict outcomes. Addition of FT3 level to APACHE II score gave an NRI of 54.29% (Z value = 5.43, P < 0.001) and an IDI of 36.54% (Z value = 14.32,P< 0.001).
Subgroup analysis
[image:4.595.57.546.99.450.2]A total of 176 patients with cardiovascular disease as their principal diagnosis leading to ICU admission (59 patients with heart failure and 88 with acute coronary
Table 1 Baseline clinical and laboratory characteristics of study subjectsa
Characteristics All Survivors Nonsurvivors Pvalues
Number 480 388 92
Males (%) 59.79 60.87 59.54 0.815
Age (years) 71.71 ± 15.52 70.62 ± 15.82 76.32 ± 13.28 0.0001
Principal diagnosis leading to ICU admission (%)
Pulmonary disease 32.50 33.51 28.26 0.334
Cardiovascular disease 36.67 37.89 31.52 0.255
Neurologic disease 7.50 6.96 9.78 0.355
Digestive disease 5.0 5.41 3.26 0.395
Renal insufficiency 1.88 1.55 3.26 0.276
Poisoning 3.75 4.38 1.09 0.135
Infectious disease and/or sepsis 4.38 2.58 11.96 < 0.0001
Trauma 2.08 2.58 0.00 0.120
Other 6.25 5.15 10.87 0.042
Accompanying infection (%) 44.38 41.75 55.43 0.018
Hemoglobin (g/L) 117.35 ± 23.77 119.51 ± 22.81 108.25 ± 25.67 < 0.0001 eGFR (mL/minute/1.73 m2) 66.13 (4.18 to 314.43) 71.63 (4.18 to 314.43) 39.95(4.25 to 238.71) < 0.0001 APACHE II score (points) 12.93 ± 6.67 11.38 ± 5.60 19.49 ± 6.85 < 0.0001 NT-proBNP (ng/ml) 2843.50 (20.95 to 35,000.00) 2201.00 (20.95 to 35,000.00) 8700.00 (142.40 to 35,000.0) < 0.0001 CRP (mg/L) 33.50 (1.00 to 160.00) 23.00 (1.00 to 160.00) 96.50 (6.00 to 160.00) < 0.0001 Albumin (g/L) 33.67 ± 4.98 34.41 ± 4.64 30.56 ± 5.18 < 0.0001 Thyroid function
TT3 (nmol/L) 1.11 ± 0.33 1.16 ± 0.32 0.89 ± 0.30 < 0.0001
TT4 (nmol/L) 71.16 ± 21.81 73.92 ± 20.88 59.52 ± 21.92 < 0.0001
FT3 (pmol/L) 3.42 ± 0.63 3.53 ± 0.60 2.95 ± 0.57 < 0.0001
FT4 (pmol/L) 15.54 ± 3.40 15.80 ± 3.29 14.48 ± 3.66 0.0008
rT3 (nmol/L) 0.30 (0.01 to 4.44) 0.30 (0.01 to 1.51) 0.30 (0.02 to 4.44) 0.4010 TSH (IU/mL) 0.80 (0.04 to 23.07) 0.87 (0.04 to 23.87) 0.60 (0.05 to 12.73) 0.0022 T3/rT3 3.36 (0.61 to 138.00) 3.62 (0.33 to 138.00) 2.61 (0.06 to 26.00) 0.0009
a
APACHE II score, Acute Physiology and Chronic Health Evaluation II score; eGFR, estimated glomerular filtration rate; CRP, C-reactive protein; FT3, free triiodothyronine; FT4, free thyroxine; NT-proBNP, N-terminal pro-brain natriuretic peptide; rT3, reverse triiodothyronine; TSH, thyroid-stimulating-hormone; TT3, total triiodothyronine; TT4, total thyroxine; T3/rT3, the ratio of rT3 to T3.
Table 2 Performance of variables in predicting ICU mortalitya
Variable AUC ROC Pvalue Cutoff value Sensitivity (%) Specificity (%)
TT3 0.722 ± 0.33 < 0.001 ≤0.965 71.28 63.74
TT4 0.680 ± 0.031 < 0.001 ≤7.04 57.18 72.53
FT3 0.762 ± 0.028 < 0.001 ≤3.33 62.14 78.02
FT4 0.625 ± 0.035 < 0.001 ≤13.63 74.93 49.46
rT3 0.529 ± 0.035 0.405
TSH 0.603 ± 0.034 0.002 ≤0.815 54.04 71.33
T3/rT3 0.617 ± 0.035 0.001 ≤2.31 72.53 45.79
APACHE II score 0.829 ± 0.022 < 0.001 ≥15 74.22 75.00
NT-proBNP 0.724 ± 0.030 < 0.001 ≥5191 73.07 68.54
CRP 0.689 ± 0.030 < 0.001 ≥66.5 69.66 61.11
a
[image:4.595.57.538.569.705.2]syndromes including acute myocardial infarction), and 130 patients with sepsis were included in the subgroup analysis. In the cardiovascular disease subgroup, the AUCs for the levels of FT3, NT-proBNP and CRP and the APACHE II score in the prediction of ICU mortality were 0.813 ± 0.038, 0.80 ± 0.036, 0.712 ± 0.050 and 0.816 ± 0.038, respectively (allP< 0.001) (Figure 1B). In the sepsis group, the AUCs for the levels of FT3, NT-proBNP and CRP and the APACHE II score to predict ICU mortality were 0.633 ± 0.055, 0.666 ± 0.054, 0.627 ± 0.056 and 0.755 ± 0.045, respectively (all P < 0.05)
[image:5.595.59.541.87.544.2](Figure 1C). Patients were also divided into three sub-groups for subgroup analysis based on their age: ages less than 60 (n = 105), 60 to 80 (n = 203) and more than 80 (n= 172) years. The AUCs, sensitivities, specifi-cities and cutoff values for FT3 to predict ICU mortality were 0.795 ± 0.063 (P= 0.001), 75.00%, 72.43% and 3.30 pmol/L in the younger than age 60 years subgroup; 0.740 ± 0.046 (P < 0.001), 84.85%, 62.14% and 3.33 pmol/L in the age 60 to 80 years subgroup; and 0.762 ± 0.043 (P < 0.001), 53.19%, 89.69% and 2.92 pmol/L in older than age 80 years subgroup, respectively.
Correlations of FT3 with other variables
The level of FT3 was negatively correlated with APACHE II score (r = -0.424, P < 0.001), age (r = -0.177,P < 0.001), NT-proBNP (r = -0.344,P < 0.001) and CRP (r = -0.408, P < 0.001), but positively asso-ciated with hemoglobin (r = 0.293,P< 0.001), albumin (r= 0.480,P< 0.001) and eGFR (r = 0.285,P < 0.001).
Discussion
To the best of our knowledge, the present study is the largest clinical investigation of the prognostic value of thyroid hormones in ICU patients. In this study of 480 unselected ICU patients, we found that FT3 was the most powerful predictor of ICU mortality among the complete thyroid indicators (FT3, TT3, FT4, TT4, TSH, rT3 and T3/rT3) by calculation of AUC, standardizedb
and OR. FT3 had greater ability than NT-proBNP or CRP to predict primary outcome, as indicated by the larger AUC and standardizedbvalue. Among the thyr-oid hormone indicators, FT3 was the only independent predictor of ICU mortality. Addition of FT3 to APACHE II score significantly improved the ability to predict primary outcomes, as demonstrated by the IDI and NRI indices.
[image:6.595.56.290.111.246.2]In this study, we found that FT3 was the most power-ful and only independent predictor of ICU mortality among the complete thyroid panel of indicators. Researchers in one previous study showed that there was no association between FT3 levels and adverse out-comes of ICU patients [18], and investigators in other studies showed that other indicators, such as TT3 [17,19], TT4 [5,18], FT4 [23] and TSH [19], were pre-dictors of ICU mortality. However, the sample sizes of most of those studies were rather small, thus the con-clusions drawn from them are less convincing. Why the results of the previous studies are different from those of our study can be attributed to two reasons. First, FT3 was not included in some of these previous studies [5,6,19]. The comparison of FT3 with other indicators in predicting outcomes was also not performed in these studies. The second reason may be attributed to the dif-ferent populations included in the other studies. NTIS is a condition characterized by abnormal thyroid function tests encountered in patients with acute or chronic sys-temic illnesses. In the acute phase of critical illness, the alterations in thyroid hormones present as decreased T3 and increased T4 and rT3, as well as normal TSH [30]. In the chronic phase of critical illness, central hypothyr-oidism develops, and NTIS presents as decreased T3, decreased T4 and decreased TSH [30]. In the recovery phase of critical illness, the thyroidal axis begins with a rise in serum TSH, which is eventually followed by
Table 3 Univariate odds ratios of variables for predicting ICU mortalitya
Predictor Standardbvalue OR 95% CI Pvalue
TT3 -0.953 0.386 0.2889 to 0.516 < 0.001 TT4 -0.699 0.497 0.387 to 0.637 < 0.001 FT3 -1.129 0.323 0.239 to 0.436 < 0.001 FT4 -0.425 0.654 0.508 to 0.842 0.001 rT3 0.275 1.316 1.060 to 1.636 0.013 TSH -0.263 0.769 0.537 to 1.100 0.151 T3/rT3 -0.765 0.465 0.230 to 0.940 0.031 Log(NT-proBNP) 0.930 2.530 1.876 to 3.425 < 0.001 Log(CRP) 0.707 2.028 1.563 to 2.632 < 0.001 APACHE II score 1.355 3.877 2.869 to 5.237 < 0.001
a
APACHE II score, Acute Physiology and Chronic Health Evaluation II score; CRP, C-reactive protein; FT3, free triiodothyronine; FT4, free thyroxine; NT-proBNP, N-terminal pro-brain natriuretic peptide; rT3, reverse triiodothyronine; TSH, thyroid-stimulating-hormone; TT3, total triiodothyronine; TT4, total thyroxine; T3/rT3, the ratio of rT3 to T3. Standardbvalue was calculated using the semistandardization method (Xstandardization). Odds ratios are shown as standardized OR per 1 SD. Log variable is the logarithm of the variable.
Table 4 Independent predictors of ICU mortality by multivariate logistic regression analysis in all patients (appending models summary)a
Predictor Standardbvalue OR Pvalue -2 log-likelihood Cox & SnellR2 NagelkerkeR2
Model I APACHE II score 1.355 3.877 0.000 315.784 0.186 0.301 Model II
FT3 -0.741 0.477 0.000 295.291 0.225 0.364
APACHE II score 1.119 3.062 0.000 Final model
FT3 -0.600 0.549 0.001
APACHE II score 0.912 2.490 0.000
Log(NT-proBNP) 0.459 1.582 0.017 282.968 0.248 0.401
Log(CRP) 0.367 1.443 0.030
a
[image:6.595.56.539.556.680.2]normalization in T4 concentration [30]. The conclusions drawn regarding the predictive value of thyroid hor-mones may be different in other studies because the patients included may have been in different phases of critical illness.
Among patients in different phases of critical illness, we found that the levels of T4, FT4 and TSH were increased, decreased or normal, but the T3 or FT3 level was generally reduced in patients with NTIS. Therefore, TT3 or FT3 level may be better than TSH and T4 level (or FT4 level) for predicting ICU outcomes. The TT3 or TT4 level can be affected by the concentration of thyr-oxine-binding globulin (TBG) or the binding ability of TBG, which may be affected by some health conditions, such as pregnancy and liver disease, and by a lot of commonly used drugs, including glucocorticoids, non-steroidal anti-inflammatory drugs, furosemide and heparin. Conversely, FT3 and FT4 levels are not affected by these factors. Thus FT3 and FT4 levels may be better than TT3 and TT4 levels for predicting ICU outcomes. In our study, we also found that rT3 levels in survivors and nonsurvivors were similar and rT3 could not pre-dict ICU mortality. An increase in rT3 level is the initial and most common abnormality observed in NTIS, owing to the inhibition of T4 conversion to rT3 by 5’ -deiodinase. In patients with severe or chronic critical ill-ness, however, central hypothyroidism develops, thus because T4 is decreased, rT3 levels do not further ele-vate. Therefore, rT3 levels may not correlate linearly with disease severity.
NT-proBNP and CRP were shown to be independent predictors of ICU mortality in our previous study [24], as well as in other studies. We found that FT3 had greater ability than NT-proBNP or CRP to predict pri-mary outcomes in whole populations, as indicated by larger AUCs and greater standardizedb values. In the present study, the predictive ability of FT3 level was independent of NT-proBNP and CRP levels as well as APACHE II scores. The addition of FT3 levels to APACHE II scores could significantly improve the abil-ity to predict ICU mortalabil-ity, as demonstrated by the IDI and NRI. In the subgroup of patients with cardiovascu-lar disease, the AUC for FT3 (0.813 ± 0.038) was very close to that for NT-proBNP (0.801 ± 0.036) and APACHE II score (0.816 ± 0.038). In the sepsis sub-group, the AUC for FT3, NT-proBNP and CRP levels (0.633 ± 0.055, 0.666 ± 0.054 and 0.627 ± 0.056, respec-tively) were close but much smaller than the APACHE II score (0.755 ± 0.045). These results suggest that FT3 levels are more useful than NT-proBNP or CRP levels for predicting ICU mortality in unselected ICU patients and are not inferior to NT-proBNP or CRP levels in patients with cardiovascular disease or sepsis.
Limitations
This study has several limitations. First, the inclusion of some patients with undetected thyroid disease before ICU admission may not be ruled out in the present study, even though we tested patients by palpation of the thyroid carefully when they were admitted to the ICU to exclude those with thyroid nodules. Second, although we excluded patients undergoing any replace-ment therapy except insulin use, as well as those taking oral amiodarone, it is clear that many other drugs (for example, propranolol, barbiturates, benzodiazepines, fur-osemide and dopamine) may have interfered with thyr-oid function, it is difficult to adjust for these potential confounders in clinical practice because so many drugs are involved and some increase and others decrease thyroid hormone levels. However, blood samples were obtained from patients at the time they were admitted to the ICU. Before we obtained blood samples, most of the patients had not been given these drugs. Addition-ally, many drugs cause abnormal thyroid function tests by affecting the concentration of TBG or the binding ability of TBG. Conversely, FT3 levels are not affected by these factors. So, the main conclusion of the study that FT3 was the most powerful and only independent predictor of ICU mortality among the complete thyroid indicators is relatively reliable.
Conclusion
In this large-scale study of unselected ICU patients, we found that FT3 was the most powerful and only inde-pendent predictor of ICU mortality among the com-plete thyroid hormone indicators. FT3 had greater ability than NT-proBNP or CRP to predict primary outcomes. Addition of FT3 levels to APACHE II scores significantly improved the ability to predict ICU mor-tality, as demonstrated by IDI and NRI. The FT3 levels were negatively correlated with CRP and NT-proBNP levels.
Key messages
• FT3 level was the most powerful and only inde-pendent predictor of ICU mortality among the com-plete thyroid indicators.
• Addition of the FT3 level to APACHE II score
could significantly improve the ability to predict ICU mortality, as demonstrated by IDI and NRI indices.
• The level of FT3 was negatively correlated to
APACHE II score, NT-proBNP and CRP.
Abbreviations
AUC: area under the curve; APACHE II: Acute Physiology and Chronic Health Evaluation II; BNP: brain natriuretic peptide; CRP: C-reactive protein; eGFR: estimated glomerular filtration rate; FT3: free triiodothyronine; FT4: free thyroxine; IDI: integrated discrimination improvement; IFN: interferon; IL:
interleukin; NF-κB: nuclear factorκB; NRI: net reclassification improvement; NTIS: nonthyroidal illness syndrome; ROC curve: receiver operating characteristic curve; rT3: reverse triiodothyronine; T3: triiodothyronine; T4: thyroxine; TNF: tumor necrosis factor; TSH: thyroid-stimulating hormone; TT3: total triiodothyronine; TT4: total thyroxine; T3/rT3: ratio of rT3 to T3.
Author details
1Department of Emergency, Xinhua Hospital of Shanghai Jiaotong, No. 1665, Kongjiang Road, Shanghai, 200092, China.2Department of Cardiology, Shanghai Institute of Cardiovascular Diseases, Zhongshan Hospital of Fudan University, No. 180, Fenglin Road, Shanghai, 200032, China.
Authors’contributions
FW, HW and SP carried out data collection, contributed to the design of the study and helped to draft the manuscript. WP and JG participated in the design of the study, performed the statistical analysis and drafted the manuscript. SW participated in the data collection. All authors read and approved the final manuscript.
Competing interests
The authors declare that they have no competing interests.
Received: 7 September 2011 Revised: 23 November 2011 Accepted: 19 January 2012 Published: 19 January 2012
References
1. Van den Berghe G:The neuroendocrine response to stress is a dynamic process.Best Pract Res Clin Endocrinol Metab2001,15:405-419.
2. Marx C, Petros S, Bornstein SR, Weise M, Wendt M, Menschikowski M, Engelmann L, Höffken G:Adrenocortical hormones in survivors and nonsurvivors of severe sepsis: diverse time course of
dehydroepiandrosterone, dehydroepiandrosterone-sulfate, and cortisol.
Crit Care Med2003,31:1382-1388.
3. Schuetz P, Müller B, Nusbaumer C, Wieland M, Christ-Crain M:Circulating levels of GH predict mortality and complement prognostic scores in critically ill medical patients.Eur J Endocrinol2009,160:157-163. 4. Slag MF, Morley JE, Elson MK, Crowson TW, Nuttall FQ, Shafer RB: Hypothyroxinemia in critically ill patients as a predictor of high mortality.JAMA1981,245:43-45.
5. Rothwell PM, Lawler PG:Prediction of outcome in intensive care patients using endocrine parameters.Crit Care Med1995,23:78-83.
6. Rothwell PM, Udwadia ZF, Lawler PG:Thyrotropin concentration predicts outcome in critical illness.Anaesthesia1993,48:373-376.
7. Docter R, Krenning EP, de Jong M, Hennemann G:The sick euthyroid syndrome: changes in thyroid hormone serum parameters and hormone metabolism.Clin Endocrinol (Oxf)1993,39:499-518.
8. McIver B, Gorman CA:Euthyroid sick syndrome: an overview.Thyroid
1997,7:125-132.
9. De Groot LJ:Dangerous dogmas in medicine: the nonthyroidal illness syndrome.J Clin Endocrinol Metab1999,84:151-164.
10. Chopra IJ:Nonthyroidal illness syndrome or euthyroid sick syndrome?
Endocr Pract1996,2:45-52.
11. Mangas-Rojas A, García-Rojas JF, Barba Chacón A, Millán Núñez-Cortés J, Zamora-Madaria E:[Changes in the hypophyseal-thyroid axis and their prognostic value in sepsis] [in Spanish].Rev Clin Esp1990,187:395-398. 12. Angelousi AG, Karageorgopoulos DE, Kapaskelis AM, Falagas ME:
Association between thyroid function tests at baseline and the outcome of patients with sepsis or septic shock: a systematic review.Eur J Endocrinol2011,164:147-155.
13. Ilias I, Stamoulis K, Armaganidis A, Lyberopoulos P, Tzanela M, Orfanos S, Theodorakopoulou M, Tsagarakis S, Dimopoulou I:Contribution of endocrine parameters in predicting outcome of multiple trauma patients in an intensive care unit.Hormones2007,6:218-226.
14. Türe M, MemişD, Kurt I, Pamukçu Z:Predictive value of thyroid hormones on the first day in adult respiratory distress syndrome patients admitted to ICU: comparison with SOFA and APACHE II scores.Ann Saudi Med
2005,25:466-472.
16. Bello G, Pennisi MA, Montini L, Silva S, Maviglia R, Cavallaro F, Bianchi A, De Marinis L, Antonelli M:Nonthyroidal illness syndrome and prolonged mechanical ventilation in patients admitted to the ICU.Chest2009, 135:1448-1454.
17. Maldonado LS, Murata GH, Hershman JM, Braunstein GD:Do thyroid function tests independently predict survival in the critically ill?Thyroid
1992,2:119-123.
18. Ray DC, Macduff A, Drummond GB, Wilkinson E, Adams B, Beckett GJ: Endocrine measurements in survivors and non-survivors from critical illness.Intensive Care Med2002,28:1301-1308.
19. Chinga-Alayo E, Villena J, Evans AT, Zimic M:Thyroid hormone levels improve the prediction of mortality among patients admitted to the intensive care unit.Intensive Care Med2005,31:1356-1361.
20. Ray DC, Drummond GB, Wilkinson E, Beckett GJ:Relationship of admission thyroid function tests to outcome in critical illness.Anaesthesia1995, 50:1022-1025.
21. Peeters RP, Wouters PJ, van Toor H, Kaptein E, Visser TJ, Van den Berghe G: Serum 3,3’,5’-triiodothyronine (rT3) and 3,5,3’-triiodothyronine/rT3 are prognostic markers in critically ill patients and are associated with postmortem tissue deiodinase activities.J Clin Endocrinol Metab2005, 90:4559-4565.
22. Sharshar T, Bastuji-Garin S, Polito A, De Jonghe B, Stevens RD, Maxime V, Rodriguez P, Cerf C, Outin H, Touraine P, Laborde K, Groupe de Réflexion et d’Etude des Neuromyopathies En Réanimation:Hormonal status in protracted critical illness and in-hospital mortality.Crit Care2011,15:R47. 23. Plikat K, Langgartner J, Buettner R, Bollheimer LC, Woenckhaus U,
Schölmerich J, Wrede CE:Frequency and outcome of patients with nonthyroidal illness syndrome in a medical intensive care unit.
Metabolism2007,56:239-244.
24. Wang F, Pan W, Pan S, Wang S, Ge Q, Ge J:Usefulness of N-terminal pro-brain natriuretic peptide and C-reactive protein to predict ICU mortality in unselected medical ICU patients: a prospective, observational study.
Crit Care2011,15:R42.
25. National Kidney Foundation:K/DOQI clinical practice guidelines for chronic kidney disease: evaluation, classification, and stratification.Am J Kidney Dis2002,39:S1-S266.
26. Youden WJ:Index for rating diagnostic tests.Cancer1950,39:32-35. 27. Nagelkerke N:A note on a general definition of the coefficient of
determination.Biometrika1991,78:691-692.
28. Pencina MJ, D’Agostino RB Sr, D’Agostino RB Jr, Vasan RS:Evaluating the added predictive ability of a new marker: from area under the ROC curve to reclassification and beyond.Stat Med2008,27:157-172. 29. Cook NR, Ridker PM:Advances in measuring the effect of individual
predictors of cardiovascular risk: the role of reclassification measures.
Ann Intern Med2009,150:795-802.
30. Economidou F, Douka E, Tzanela M, Nanas S, Kotanidou A:Thyroid function during critical illness.Hormones2011,10:117-124.
31. Becker RA, Vaughan GM, Ziegler MG, Seraile LG, Goldfarb IW, Mansour EH, McManus WF, Pruitt BA Jr, Mason AD Jr:Hypermetabolic low
triiodothyronine syndrome of burn injury.Crit Care Med1982,10:870-875. 32. Acker CG, Singh AR, Flick RP, Bernardini J, Greenberg A, Johnson JP:A trial
of thyroxine in acute renal failure.Kidney Int2000,57:293-298. 33. Dietrich JW, Stachon A, Antic B, Klein HH, Hering S:The AQUA-FONTIS
study: protocol of a multidisciplinary, cross-sectional and prospective longitudinal study for developing standardized diagnostics and classification of non-thyroidal illness syndrome.BMC Endocr Disord2008, 8:13.
34. Wajner SM, Goemann IM, Bueno AL, Larsen PR, Maia AL:IL-6 promotes nonthyroidal illness syndrome by blocking thyroxine activation while promoting thyroid hormone inactivation in human cells.J Clin Invest
2011,121:1834-1845.
35. Boelen A, Platvoet-Ter Schiphorst MC, Wiersinga WM:Soluble cytokine receptors and the low 3,5,3’-triiodothyronine syndrome in patients with nonthyroidal disease.J Clin Endocrinol Metab1995,80:971-976.
36. Hartemink KJ, Twisk JW, Groeneveld AB:High circulating N-terminal pro-B-type natriuretic peptide is associated with greater systolic cardiac dysfunction and nonresponsiveness to fluids in septic vs nonseptic critically ill patients.J Crit Care2011,26:108.e1-e8.
37. Opasich C, Pacini F, Ambrosino N:Sick euthyroid syndrome in patients with moderate to severe chronic heart failure.Eur Heart J1996, 17:1860-1866.
38. Pinelli M, Bindi M, Cassetti G, Moroni F, Pandolfo C, Rosada J, Castiglioni M: Relationship between low T3 syndrome and NT-proBNP levels in non-cardiac patients.Acta Cardiol2007,62:19-24.
39. Coceani M, Iervasi G, Pingitore A, Carpeggiani C, L’Abbate A:Thyroid hormone and coronary artery disease: from clinical correlations to prognostic implications.Clin Cardiol2009,32:380-385.
40. Ho KM, Lee KY, Dobb GJ, Webb SA:C-reactive protein concentration as a predictor of in-hospital mortality after ICU discharge: a prospective cohort study.Intensive Care Med2008,34:481-487.
doi:10.1186/cc11151
Cite this article as:Wanget al.:Relationship between thyroid function and ICU mortality: a prospective observation study.Critical Care201216: R11.
Submit your next manuscript to BioMed Central and take full advantage of:
• Convenient online submission
• Thorough peer review
• No space constraints or color figure charges
• Immediate publication on acceptance
• Inclusion in PubMed, CAS, Scopus and Google Scholar
• Research which is freely available for redistribution