International Journal of Emerging Technology and Advanced Engineering
Website: www.ijetae.com (ISSN 2250-2459,ISO 9001:2008 Certified Journal, Volume 4, Issue 12, December 2014)
33
A Study on Using AHP Technique for Optimum Location
Selection
Yongwon (Conrad) Cho
1, Jinwon (Frank) Choi
21
Director Research Engineer, Virtual Builders Co., Ltd. 2CEO & Co-Founder, Virtual Builders Co., Ltd.
Abstract—Many Peoples make online content while many showing of the traditional boundaries, production and consumption are un-label. The evolution of online access to information technology facilitates comparable to professional and amateur engineers are born, focusing on common interests among people formed community is growing together. Recently, based on these wide range of public companies can take advantage of collective intelligence to effectively 'Crowd sourcing' has attend to attracted. This study, the best location for AHP techniques and subsequent analysis based on Crowd sourcing, so spatial information for crowd mapping in the field of development of the concept proposed.
Keywords— Spatial Information, GIS, AHP technique, Crowd sourcing, User Participation, Google Earth.
I. INTRODUCTION
Crowd sourcing is since 2006 contributing editor „Jeff Howe‟ of „Wired Magazine‟ presents a concept for the first time (e.g. [1]). That means of public, 'Crowd' and the external resource utilization, 'Outsourcing' is a portmanteau of the company's manufacturing, service and problem-solving process an unspecified number of specific community or the public to participate in raise efficiency of the approach.
In fact, companies that participate in the activities of the general public that had been long. Is not a new concept.
Competition from the old form of advertising firms to get ideas or the general public, such as product development with the participation of potential customers have been derived through the development (e.g. [2]).
Why this old concept revisited again recently received? Once, Web 4.0 era is approaching 'Youtube', 'Facebook' or 'Twitter', etc. SNS (Social Network Service) is center enabled and user participation. Because online technology evolves.
Gathered online creating content for public consumption are numerous and it also created new words. 'Producer + Consumer' to join the 'Prosumer' place, 'Creator + Consumer' to join the 'Cresumer' is called.
Already on-line is not on the lookout for the production and consumption.
Also, thorough history of the community area centered to around the development of the online form, but they are not necessarily in the same area around the private interests was to form a community. People with common interests to share with each other by exchanging information about online users are getting smarter over time, as good as a professional engineer and amateur engineers to be born. Only then could the old company are now a variety of activities that the general public (e.g. [2]).
In this study, taking advantage of user participation Crowd sourcing the best commercial location analysis techniques for utilizing AHP 'Google Earth' via mash-up program on the experiment.
II. SPATIAL INFORMATION TECHNICAL TRENDS There are at least 170 companies today working on indoor location, indoor maps, building tracking and indoor navigation add to outdoor position. The growth of this market has been impressive over the last 10 years. Indoors is the last mile and the next frontier for the location services market. Indoor maps emerged rapidly in 2009 as started up such as Point Inside, Micello and Nokia. Released their indoor content, while indoor mapping data is available for indoor navigation applications, associated location determination is still a challenge. A number of tagging & infrastructure based technologies can deliver to precise indoor location, but it is tough to make these solutions ubiquitous.
A. Crowd sourcing
When As mentioned earlier, many of Crowd sourcing development and through user participation can be consumed. Today based on the evolution of online communication technologies with the public to show the infinite possibilities (e.g. [3]).
International Journal of Emerging Technology and Advanced Engineering
Website: www.ijetae.com (ISSN 2250-2459,ISO 9001:2008 Certified Journal, Volume 4, Issue 12, December 2014)
[image:2.612.318.567.130.299.2]34
Figure 1 The advantage of Crowd sourcing (SUPERHUB).
In this study, the 'Google Earth' on their GPS location will be used to collect the floating population.
B. Crowd mapping
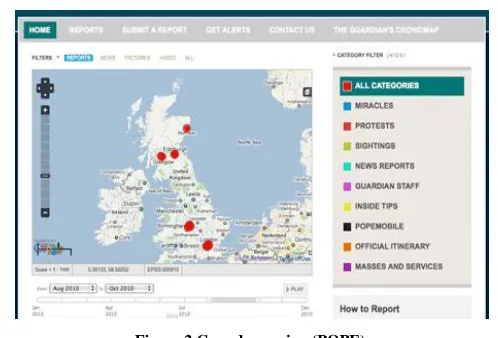
As said, Crowd mapping is designed and built by the team behind Ushahidi, a platform that was originally built to crowd source crisis information. As the platform has evolved, so have its uses. Crowd mapping now allows users to set up their own deployments of Ushahidi without having to install it on a web server. Since its release in 2010, prominent deployment of Crowd mapping have documented the global 'occupy' protests and the 2011 London anti-cuts protest (e.g. [4]).
On 31 December 2010, the Ushahidi team announced Crowd mapping: Checkins, a geo-social add on to Crowd mapping that allows users to create a white label alternative to sites like Foursquare and Gowalla (e.g. [4], [5]). Rather than filling out submission forms online, checkins allow Crowd mapping users to expedite data entry to their deployment, focus first on location and adding more detailed information later (e.g. [6]). Ushahidi describes the effort as 'checkins with a purpose'.
Figure 2 Crowd mapping (POPE).
C. User participation
Wikipedia users to make their way directly participated map programs are gaining popularity recently. Focusing on user participation in Wikipedia map Global Positioning System (GPS)-equipped people to use a smartphone without any prior knowledge help us be able to create a map of the world. Participation typically made of an open-source map „Waze‟ and Open Street Map there (e.g. [7]).
Israel Tal Aviv „Waze‟ for the first time in 2006, began. Users are not marked on the map into a dead end when the Wise stood no way connected to the place on the map to display the next place to visit for people who can help. „Waze‟ is now the driver of the 14 million people worldwide and is used to edit the map and 45,000 people living in 5,000 people in his area manager to verify the accuracy of the map is active (e.g. [7]).
[image:2.612.49.290.136.321.2]International Journal of Emerging Technology and Advanced Engineering
Website: www.ijetae.com (ISSN 2250-2459,ISO 9001:2008 Certified Journal, Volume 4, Issue 12, December 2014)
35 Recent popular location-based social network services company Foursquare have the same characteristics of the open street map to identify the user where their friends are staying open, make sure that you had to use a street map unveiled last month.
Disaster relief organizations are also 'maps of the terrain is changed just change' increasingly rely on participatory map. Earthquake in 2010 significantly changed the topography of the entire country rescuers in Haiti is that using the example of the open street map. Nine trillion won at the time of the Haiti relief efforts using real-time information to modify the map where the terrain is changed when it arrived and prayed to inform the open street map.
Jonathan Bennett, open street map users "that there is no other way to create a map from the open street map is not inferior to the rate of progress," he said (e.g. [7]).
D. Data management for Big Data
Big Data and efficient processing of such data, analysis, and in order to take advantage of was the emergence, Big Data is usually data volume, variety, velocity as a combination of three factors is characterized by changes (e.g. [8]). Big Data and analysis techniques for processing such data, the text mining, opinion mining, social network analysis, cluster analysis has dual images similar to nested characteristics of the object together with the cluster analysis technique was used for outgoing (e.g. [9]).
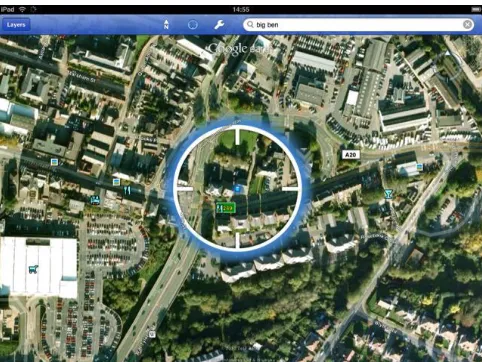
E. Google Earth
Google Earth is a virtual globe, map and geographical information program that was originally called EarthViewer 3D created by Keyhole, Inc, a Central Intelligence Agency (CIA) funded company acquired by Google in 2004 (see In-Q-Tel). It maps the Earth by the superimposition of images obtained from satellite imagery, aerial photography and geographic information system (GIS) 3D globe (e.g. [10]).
For other parts of the surface of the Earth, 3D images of terrain and buildings are available. Google Earth uses digital elevation model (DEM) data collected by NASA's Shuttle Radar Topography Mission (SRTM) (e.g. [11]). This means one can view almost whole earth in three dimensions. Since November 2006, the 3D views of many mountains, including Mount Everest, have been improved by the use of supplementary DEM data to fill the gaps in SRTM coverage (e.g. [12]).
Many people use the applications to add their own data, making them available through various sources, such as the Bulletin Board Systems (BBS) or blogs mentioned in the link section below.
Google Earth is able to show all kinds of images overlaid on the surface of the earth and is also a Web Map Service client. Google Earth supports managing three-dimensional Geospatial data through Keyhole Markup Language (KML) (e.g. [13]).
[image:3.612.325.565.219.400.2]In this study, to show the best position for the exact location of their 'Google Earth' on the show.
Figure 3 Google Earth.
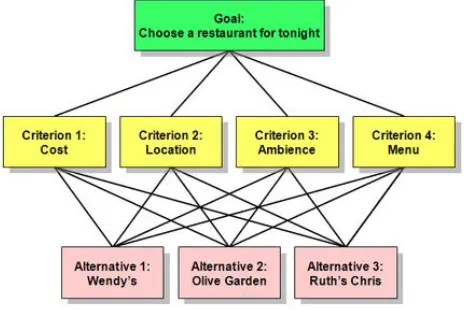
F. AHP technique
AHP technique is 'Analytic Hierarchy Process'. AHP full name is 'Analytic Hierarchy Process and methods' (e.g. [14]).
That is the whole process of decision after it is divided by the number of solving, step by step analysis method to reach a final decision (e.g. [14]).
In this study, the experimental conditions are set for some suggestion that these conditions was tested by applying the AHP technique.
[image:3.612.329.561.546.701.2]International Journal of Emerging Technology and Advanced Engineering
Website: www.ijetae.com (ISSN 2250-2459,ISO 9001:2008 Certified Journal, Volume 4, Issue 12, December 2014)
36
III. EXPERIMENT FOR AHPTECHNIQUE
In this study, to establish the following our topic were experiment: 'What would be found in which place?' For calculating the AHP technique, we summary multiple properties establishments, subway accessibility, land acquisition costs and disgust facilities have or not. We selected test-bed and construct database, finally visualization. We would like to find the best location to build a franchises shop using GIS with the assistance of AHP technique. 3 locations were selected to make experiment. The best location was selected among three candidates and shown in GIS and Google Earth.
A. Solution
First, we constructed data in GIS and selected criteria for AHP: State, accessibility, economy and environment. Second, we survey the score of respective criterion of each candidate using GIS. Third, we use AHP to compute total score of each candidate and suggest where the best location. The data and results are visualize in GIS and Google Earth. B. Data Collection
[image:4.612.322.564.124.317.2]Using an open data source with the increase if data quality, accessibility and availability is more and more popular. 'Seoul open data square' can provide the detail data about social and economic. It contributes to the creation of a variety of private business.
Figure 5 Evaluate the items score.
C. Experimental Area
We chose Gwangjin-gu in Seoul, South Korea. Because the most recent floating population in Korea showed areas and excellent proximity to the laboratory were selected. Below figure is Korea internet news script and choose experiment area image.
Figure 6 Experiment area and news script (Digital Times NEWS).
[image:4.612.325.563.363.483.2]Where we have about 3 locations, some conditions gave the score.
Figure 7 Comprehensive evaluation criteria scores.
[image:4.612.326.562.503.663.2]International Journal of Emerging Technology and Advanced Engineering
Website: www.ijetae.com (ISSN 2250-2459,ISO 9001:2008 Certified Journal, Volume 4, Issue 12, December 2014)
[image:5.612.49.291.181.394.2]37 Figure 8. will be described. Example economy is more important than accessibility. So its score comparing to accessibility is 3.
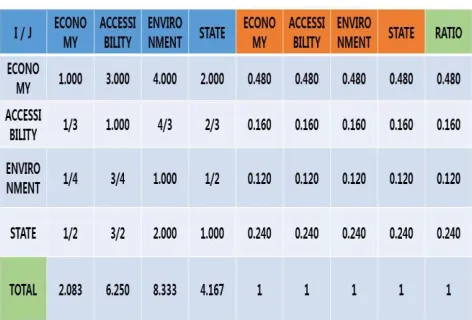
Figure 9 Calculate the relative proportion of assessment items.
We will calculate the consistency ratio. Related to the expression below. 3 * 33 2 * 32 1 * 31 3 * 23 2 * 22 1 * 21 3 * 13 2 * 12 1 * 11 3 2 1 33 32 31 23 22 21 13 12 11 w a w a w a w a w a w a w a w a w a w w w a a a a a a a a a t bytheweigh Multiplied (1) weight ytheweight Multipiedb yratio
Consistenc () (2)
Figure 10 Consistent Evaluation.
Now, we make CI. CI is Consistency Index. Seeing the indicator how much have consistency about result. Do have not consistency: Someone „A‟ is more important than „B‟ and „B‟ is more important „C‟, but evaluate „A‟ is less important „C‟. When someone respond „A‟ is twice better than „B‟ and „B‟ is three times better than „c‟, „A‟ is six times better than „C‟. C.I is to verify the logical contradiction for response. If C.I is less than 0.1, that means comparison have a consistent.
ex istencyInd RandomCons I C R
C. . (3)
- C.R : Consistency Ratio
[image:5.612.53.284.438.701.2]- Random Consistency Index
Figure 11 Consistency Index..
[image:5.612.326.566.486.632.2]Value of C is biggest, it mean C is the best location to build the shop. We use to perform AHP: Excel, GIS, or some programming language. We use to Excel.
Figure 12 Derived final relative importance.
•A: 0.480 x 0.333 + 0.160 x 0.429 + 0.120 x 0.200 + 0.240 x 0.429 = 0.355
International Journal of Emerging Technology and Advanced Engineering
Website: www.ijetae.com (ISSN 2250-2459,ISO 9001:2008 Certified Journal, Volume 4, Issue 12, December 2014)
38 •C: 0.480 x 0.556 + 0.160 x 0.429 + 0.120 x 0.600 + 0.240 x 0.143 = 0.441
IV. GOOGLE EARTH MASH-UP TO EXPERIMENT Blue one is structured data. The properties population density, resident population, and red one is unstructured data.
[image:6.612.325.565.174.370.2]When we visual the data we 'Google Earth' icons are the big data they updated real time and so on.
Figure 13 GIS platform layers to address Big Data & data construction.
What did we use GIS to do? Structure data, Inquiry data, and represent data? We use the GIS to allocate the flower store and input the inquiry data. Population density, current population and calculate these data within GIS.
Figure 14 Using ArcGIS & Google Earth.
[image:6.612.49.287.250.444.2]If possible, please show the area of location C with its attributes in this slide. You can see the location C from this animation (the last part).
Figure 15 Best Location (Yellow Round Point).
V. CONCLUSION
We have selected the best location through a simple experiment made the results. Simply not only one program is used, appropriately using multiple programs results showed efficient (Google Earth, Arc GIS and AHP technique).
And materials, as well as our existing data, you turned on the GPS to determine the flow of people around, more accurate data is available, were confirmed. This mean is through user participation, as we want accurate data can be obtained.
User participation on the basis of Crowdsourcing, Crowd game and Crowd map will be able to develop.
Acknowledgement
This research was supported by a grant (11 High-tech G11) from Architecture & Urban Development Research Program funded by Ministry of Land, Infrastructure and Transport of Korean government.
REFERENCES
[1] H. Jeff, Crowdsourcing, Google Image search, 2010.
[2] J. H. Yoo, The wisdom of the masses to be successful crowdsourcing is Mine, LG Business Insight, pp.46-53, 2010.
[3] Crowdsourcing Through Knowledge Marketplace, SpinAct, 2010. [4] Ushahidi, Announcing checkins for Ushahidi and Crowdmap,
[image:6.612.49.290.517.698.2]International Journal of Emerging Technology and Advanced Engineering
Website: www.ijetae.com (ISSN 2250-2459,ISO 9001:2008 Certified Journal, Volume 4, Issue 12, December 2014)
39 [5] Ushahidi, Crisis-Mapping Platform Ushahidi Announces
Crowdmap:CI, "Checkins With a Purpose", ReadWrite, 2011. [6] Ushahidi, “Launches Crowdmap Checkins”, Geo Spatial World,
2011.
[7] Wikipedia…Today, Wikimap, Hot Issue User Participation (Crowd Mapping) Map, Kyunghyang News, 2012.
[8] O'Reilly Radar Team, “Planning for Big Data”, O'Reilly, 2012. [9] M. M. Kang, S. R. Kim, S. M. Park, “Analysis and utilization of Big
Data, Journal of Information Science”, vol. 30, pp. 25-32, 2013. [10] Wikipedia, Google Earth, Google Inc, 2008.
[11] Farr et al., 2007, The Shuttle Radar Topography Mission, v. 45, Reviews of Geophysics, doi: 1029/2005RG000183.
[12] "Google Earth Community: Nov. 23rd — Thanksgiving Day imagery update".
[13] "Keyhole Markup Language — Google Developers". Developers.google.com. 2012-03-01. Retrieved 2013-06-15. [14] R. R. Bishu, and K. P. Rajurkar, (1999), Analytical Hierarchy